AMAZON multi-meters discounts AMAZON oscilloscope discounts
Chart Recorders are data acquisition instruments used to generate a chart or graph of data versus time.
Features that chart recorders and strip charts offer include:
- auxiliary outputs
- user interfaces
- communications with computers
- application software
- memory and storage functions
- built-in transducers
Note: Simple (inexpensive) ink-chart plotters may offer none of the above features.
Common signal inputs for chart recorders and strip charts include:
- DC voltage
- DC current
- AC voltage
- AC current
- frequency
- charge
Common sensor inputs for chart recorders and strip charts include:
- accelerometers
- thermocouples
- thermistors
- RTDs
- strain gauges or bridges
- LVDTs
- RVDTs
Specialized inputs may include:
- encoders
- counters or tachometers
- timers or clocks
- relays or switches
Common applications include:
- temperature measurements
- humidity measurements
- chromatography
- spectroscopy graphs
- misc. plots generated from data acquired from lab/test equipment outputs
Common formats of chart-recorder output data include:
- circular x-y plotter: rotate
at constant velocity -- rotation time may span from minutes to days
-- while variable(s) is (are) plotted radially (see image below). In
an X-Y plotter two selectable variables are plotted against each other
in rectilinear coordinates. Plotted variables may include
mathematical functions of data input. Circular plotters
are
inexpensive (initially), compact-sized, and simple to operate. They require a continuous supply of ink pens and chart paper.
- strip-chart: variables are plotted with respect to time, as the paper strip
advances uniformly through the plotter. Strip often comes off
a roll for space conservation. Require a continuous supply of ink cartridges and chart paper. The last two images show two strip-chart recorders
from Yokogawa and ABB.
- paperless: plots and trending recorded on to hard-disk or external computer. Graphs visible
on video monitor.
- video graphing: don't require paper or ink. Graphs visible
on video monitor.
- hybrid: combines features of strip-chart and paperless recorders. Yokogawa is an example of a manufacturer of hybrid recorders. The Yokogawa DR130 is an example of a hybrid recorder (see image below).

above: DR130 Portable Hybrid Recorder from Yokogawa.

above: Battery-powered Temperature Chart Recorder, -20 to +120°F, 7 Day, 8" Chart from Dickson.

above: The μR1800 is a small recorder from Yokogawa with effective recording width of 180 mm.
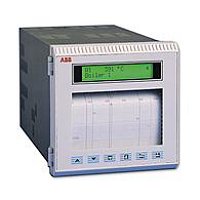
above: ABB Commander 250-mm Strip Chart Recorders
Specifications for strip charts and chart recorders include:
- differential analog input channels: use the difference between two signals as an input; common mode is filtered out. Some systems offer differential inputs which are combinations of two single-ended inputs; here, twice the number of differential channels are available as compared to single-ended inputs.
- digital I/O channels: Digital or discrete channels are used for low-level (on-off) signals used in applications such as communication, user interface, or control.
- sampling frequency: frequency of the analog signal sampling and conversion to a digital value
- resolution: "granularity" of the digital word representing the analog value. A ten-bit number contains 210, or 1024, increments. A 0-10V signal could therefore be resolved into approximately 0.01V increments. A 12-bit representation would be in 212 (4096) increments, or divisions of 0.0024V for the same signal. Each additional bit doubles the resolution, and one bit is required for the polarity (sign) of a number.
- accuracy: depends on the signal conditioning linearity, hysteresis, temperature considerations, etc. Often noted as the percent full-scale of measurement range.
Links:
Wikipedia definition of Chart Recorder
PREVIOUS: Data Loggers and Recorders | NEXT: Paperless Chart Recorders