By SIDNEY L. SILVER
When low-level repetitive signals are buried in noise that can't be filtered out, these methods pinpoint the signals. Biomedical electronics, vibration studies for oil exploration, investigating signals from outer space, analyzing the molecules of materials are some of the many applications.
IN the physical and biophysical sciences, it is often necessary to observe repetitive waveforms whose parameters are obscured by noise. The noise sources may include interference from nearby equipment, power-line pickup, system ground loops, and random noise. These disturbing elements set a fundamental limit on the ultimate sensitivity, or resolution, which defines the minimum detectable signal increment that can be handled by a precision instrument. In principle, where the signal of interest and the noise occupy a different portion of the frequency spectrum, conventional filtering techniques are entirely satisfactory.
Random noise, however, includes all extraneous interference such as the effect produced by thermal fluctuations, and by statistical variations due to the quantized nature of the physical phenomena being measured. Since this type of noise is generally distributed over a wide range of frequencies, selective filtering is useless because no matter where the passband is located on the frequency scale, some of the noise will always pass through the system. This presents a difficult problem in spectral analysis, namely that of isolating and extracting a usable output signal when the input level is extremely small in comparison with the incoherent background noise level of the measurement system.
To overcome this problem, a powerful technique known as signal averaging, or signal recovery, is being employed to pull desired signals out of non-filterable noise. This technique is a form of spectrum accumulation which makes use of the redundant information inherent in repetitive waveforms. A basic requirement for signal averaging is that a time reference signal be made available which bears a fixed relationship to the desired signal, but not to the noise. This may be accomplished by using a synchronizing pulse (usually derived from the physical parameter being measured) to identify each repetition of the waveform segment to be examined. Thus, by time-locking the repetitive component to the system trigger, it is possible to extract a coherent pattern, even if the spurious noise is much greater in magnitude than the signal of interest. The overall result is a substantial improvement in system sensitivity, dynamic range, resolution, and accuracy.
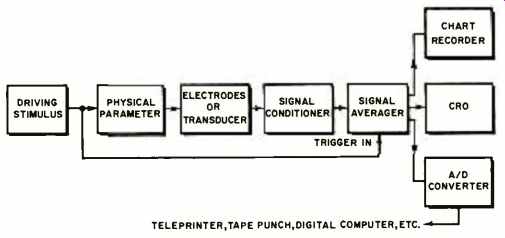
Fig. 1. Block diagram of typical measurement setup using signal averaging
to optimize the signal-to-noise ratio.
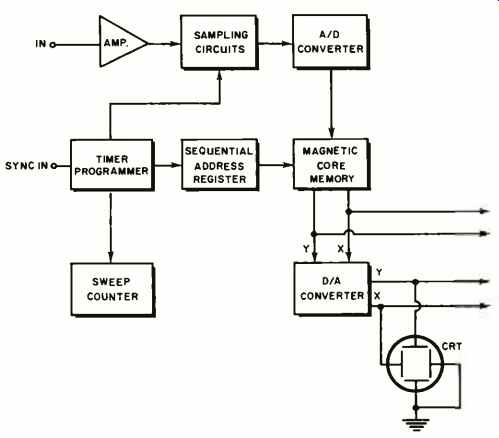
Fig. 2. Diagram showing basic elements of a digital averager.
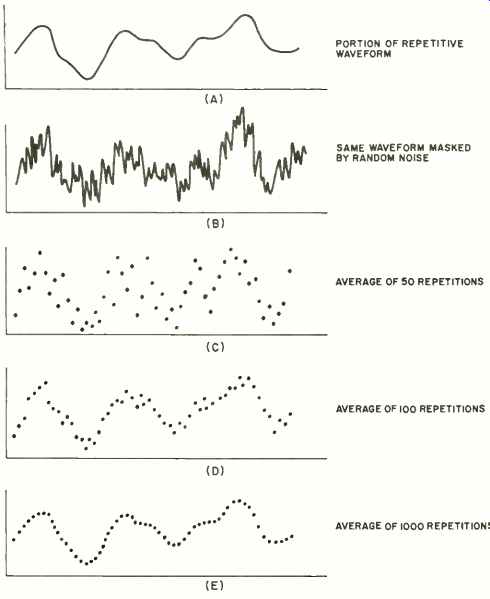
Fig. 3. Graphs A through E demonstrate that signal recovery by digital
averaging produces gradual signal-to-noise improvement.
Signal-averaging equipment has found wide application in biomedical electronics in which the analysis, diagnosis, and monitoring of physiological phenomena is accomplished by the measurement of bio-electrically transduced potentials. Using evoked response techniques, the cause-and-effect relationship between various stimuli and the particular responses can be determined, even in cases where the signals of interest are concealed in a blanket of spontaneous noise. Signal recovery enables the researcher or clinician to study in detail the reaction of a muscle to a nerve impulse, the events relating to the cardiac cycle, and the response of the brain to such stimuli as sound, light, and touch. In all of these electrophysiological measurements, the small electrical impulses associated with each phenomenon can easily be separated from the inherently noisy environment. Moreover, by interfacing a signal averager with a computer, it is possible to analyze large amounts of medical data from clinical records to determine the statistical influence or significance of various parameters. These results can be used to measure the effects of specific treatments and to develop improved diagnostic procedures.
In analytical instrumentation, the averaging process is particularly useful in many types of spectroscopy for determining the chemical composition of liquid, solid, and gaseous material. Some of these fields include spectrophotome--try in the infrared, visible, and ultraviolet ranges, nuclear magnetic resonance, fluorescence analysis, and x-ray diffraction spectrometry. In each of these application areas, there is a scanning process in which a sample specimen under investigation is subjected to a varying magnetic or electric field. Generally there is absorption of energy by the sample, and since different samples have distinct patterns, or spectra, the elements or compounds contained within the specimen can thus be identified. These characteristic patterns are formed by detecting the energy absorbed and plotting it as a function of the values of the field which created the absorption. Here signal averaging of the detected signal is often required when working with sample specimens whose spectra are difficult to obtain because of very small quantity or extremely high dilution.
Other applications where signal recovery has proven valuable are molecular beam analysis, pulsed ultrasonic flaw detection, vibration studies in seismic exploration of oil, transient-response analysis, and the investigation of pulsar signals from outer space. In effect, the averaging technique enhances the signal-to-noise ratio in many measurements where extensive random noise interferes with the recovery of repetitive waveshapes, and which require sophisticated signal processing to sift useful information from the raw data.
Principles of Operation
Fig. 1 shows a typical measurement setup which incorporates signal averaging to optimize the signal-to-noise ratio.
Here the pickup may consist of an electrode array for biomedical phenomena or a suitable transducer for converting the physical quantity into corresponding electrical signals. The signal conditioner provides a variable bandwidth characteristic and includes a low-noise, high-gain differential amplifier to supply sufficient drive for the signal averager. To obtain the required sync pulse, it is possible to use a recurrent peak of the repetitive signal as a reference trigger, provided it occurs prior to the spectral region of interest. In this case, an external driving stimulus excites the system in order to evoke a response from the physical parameter. Another way to create the scanning process is to derive a sync pulse from a contact closure at the start of the scan by pulsing the physical quantity with a mechanical chopper. During the signal-averaging process, the clearly defined output signal is continuously available for observation on a monitoring scope, or read out on demand or by programmed command on a chart recorder.
Signal recovery can be accomplished with either analog or digital circuitry. In the digital averager shown in Fig. 2, the input signal (which is often a composite of signal plus noise) is sampled or sliced into small segments at equally spaced intervals, and the resulting information stored in a 1000-word magnetic-core memory. The sync pulse provides an indication to the sampling circuits when to initiate the scanning cycle. As the signal repeats itself, a new sample of the composite waveform is taken and added to the original information, thus building up the data samples in each memory channel After a sufficient number of repetitions, the voltage level of the desired signal in each channel will be proportional to the average value for that particular segment of the signal waveform (Fig. 3). In this process, the signal of interest is reinforced at an algebraic rate while the random noise (not being synchronous with the trigger) is added at an r.m.s. rate. In effect, the signal portion of the input waveform is a constant for any sampling point, so that its contribution to the stored sum is multiplied by the number of repetitions. By contrast, the noise, which makes both positive and negative amplitude excursions at any sampling point, varies in proportion to the square root of the data samples taken. As an example, after 10,000 repetitions of the waveform, the signal is 10,000 times stronger, while the noise is Vio,000, or 100 times greater. Thus, the signal-to-noise voltage ratio is 100 to 1, or an improvement of 40 dB. In practice, any continued enhancement of the signal-to-noise ratio (up to a maximum of 60 dB) depends upon the instrumentation limit of the measuring system and the stability of the input signal itself. Provision is made for calibrating and stabilizing the output signal, so that the waveform amplitude remains effectively constant as the noise component diminishes about the desired signal level.
Stimulus-Evoked Response Measurements
Almost all physiological functions of the human body are accompanied by bioelectrical changes, the measurement of which provides an effective means for studying the condition of various organs. In these measurements, an array of biopotential electrodes acts as the interface between the living tissue and electronic instrumentation. These probes detect the minute impulses produced by electrochemical reactions within the body and transform them into analogous electrical form. However, due to ambient noise originating in the measurement system, as well as within the biological system, the low-level signals of interest tend to be swamped out, thus making it virtually impossible to perform many useful electrophysiological measurements without some form of signal recovery.
Fig. 4 shows an automatic measuring system in which signal averaging is used to process electrical signals produced by various external sensory stimuli. Here a selective stimulus, e.g., light flash, audio tone burst, or tactile stimulator, is applied repeatedly to the subject being tested, in order to evoke a response potential and also to initiate operation of the averaging circuits. Using the appropriate sensor for a particular analysis, this instrumentation system can be employed in many areas of biomedical data acquisition, such as electroencephalography (EEG) for studying evoked response signals from various portions of the brain, audiometry for testing hearing acuity, electrocardiography (ECG) for investigating the series of complex electrical changes repeated at every heart beat, electromyography (EMG) for time averaging of nerve impulses along portions of the muscles, and electro-retinography (ERG) for measuring the electrical activity of the retina following light absorption.
The heart of the measurement system is a logic device, or programmer, which controls the automatic function of various components so that they operate in proper time sequence. In preparing for a run, or analysis sweep, a number of processing parameters are preselected, such as the desired stimulus characteristics (i.e., frequency, presentation rate, duration, and rise and fall times), analysis time, and the desired roll-off characteristics of the driver amplifier.
During the run, the two-channel chart recorder displays the raw output of the driver amplifier in one of its channels, and the averaged responses processed by the signal averager on the other channel.
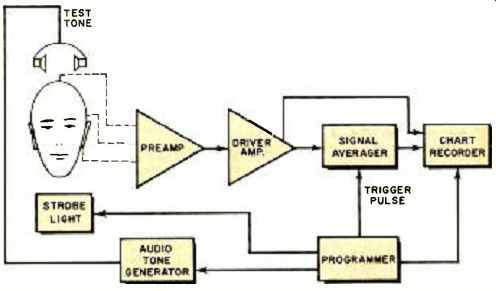
Fig. 4. Block diagram showing an automatic biomedical instrumentation
system for stimulus-evoked response measurements.
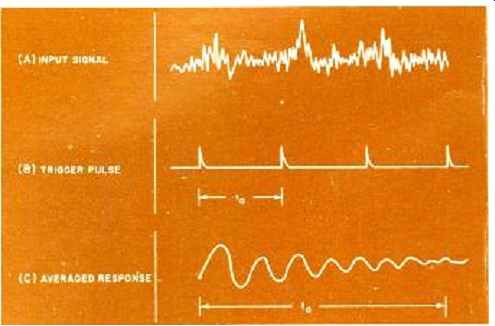
Fig. 5. Graphs demonstrating signal averaging of EEG signal. The raw
input data (A) uses a trigger pulse (B) to produce an averaged evoked
response (C) of analysis time t;
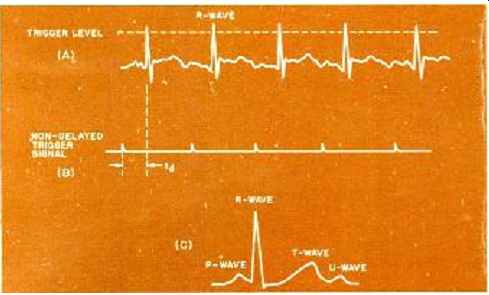
Fig. 6. Signal recovery technique in which amplified ECG signal (A) is
delayed in relation to trigger pulse (B) derived from the R-wave. The
smoothed averaged response (C) is shown after 100 sweeps. Letters are
standard medical notations associated with different events of cardiac
cycle.
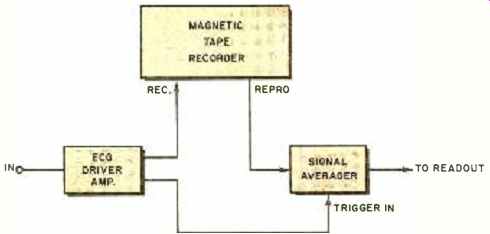
Fig. 7. Block diagram showing how magnetic tape recorder is used to introduce
a fixed time delay during an ECG analysis.
Initially, the raw signals are recorded at a very low chart speed so that any spurious noise pulses generated by variations in contact potential (due to displacement of the electrodes) can readily be observed. The low chart speed is also convenient for monitoring the gradual build-up of the stimulus-evoked signals with time. After a predetermined number of responses have been accumulated, the recorder drive is automatically speeded up to provide an expanded, detailed trace of the actual processed signals used for the analysis. Usually the chart recorder is equipped with a pair of event markers, one of which is activated by the sync pulse to record the beginning and duration of each stimulus, and the other to manually record an identifying mark at any time during the measurement. The interpretation of the recorded signals involves a technique of pattern recognition where the measured parameters of the waveforms are compared with those associated with normal and pathological subjects, so that a diagnosis can be made.
In a typical EEG analysis, a number of surface electrodes are attached to the subject's head, one of the electrodes being connected to the system ground. Here the repetitive flash of a xenon-filled strobe lamp is used to evoke an optical response from the brain, the stimulus also serving as the trigger mechanism to start the analysis sweep. As a result, rhythmic variations are picked up by the sensors, the changes representing the positive and negative charges that shift throughout the brain. These transduced signals are quite low in amplitude and frequency, ranging from 10 to 100 µV at 1 to 100 Hz. After a sufficient number of stimuli have been applied, all non-repetitive variations of the signal due to unrelated brain activity tend to be suppressed, so that a clean averaged response is retrieved at the output.
In the example shown in Fig. 5C, the average response (shown as an analog plot) taken over analysis time i, indicates that the primary response of the raw EEG waveform (Fig. 5A) contains signal components that are very much like repetitive bursts of damped sine waves. These variations are referred to as alpha waves (normally about 10 Hz)
and represent the dominant rhythm of the brain's cortex when the subject is in a relaxed state with the eyes closed.
In this case, the relatively smooth alpha rhythm of the averaged response serves as a good indication of a normally functioning brain. Signal recovery enables the diagnostician to observe any secondary or tertiary responses overriding, or even blocking, the alpha waves, in order to find any characteristic pattern associated with various types of brain disorders. By pairing the electrode leads in various combinations through a selector switch, any abnormal activity of the brain can then be localized. Another important application of the EEG is the detection of toxic states, such as in the diagnosis of barbiturate intoxication.
Using the same EEG probes, the instrumentation system can also be employed to measure the hearing ability and determine the auditory threshold of a subject. Here the primary electrode is attached to the post-auricular area of the head, the other to the vortex, and the ground electrode to the ear lobe. The stimulus consists of a series of audible tones of varying pitch, duration, and intensity; and these are fed repeatedly to the subject via headphones or a loudspeaker. The resulting evoked brainwave response is lifted from the dense background noise by signal recovery, and subsequently written out for evaluation. Since the subject is not required to respond voluntarily to the auditory stimulus, this technique is ideal for testing infants and non-cooperating adults.
To perform an ECG analysis, a number of surface electrodes are placed on the limbs of the body to detect the electrical potentials emanating from the heart. Normally, when a measurement is taken with the subject at rest, the raw ECG waveform is quite clean, but when he is exercising, the heart signals are obscured by high-amplitude spikes generated by the muscles (other than the heart) in the vicinity of the electrodes. In this case, signal averaging is necessary to retrieve not only the slowly varying signals but also the stationary ones. As indicated in Fig. 6A, the transduced signals consist of a series of complex repetitive waveforms (in the millivolt range) in which a recurrent peak, known as the R-wave, appears as the most prominent point of any heart cycle. The R-wave is produced by contractions
of the ventricles of the heart and provides a naturally occurring reference point for triggering the signal averager.
However, it cannot be used directly to synchronize the successive heart cycles because the interval between peaks varies from one heart beat to another.
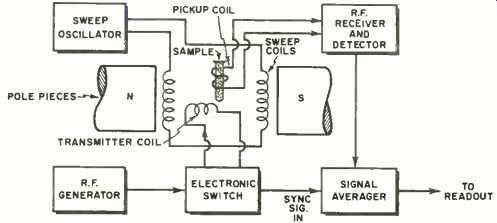
Fig. 8. Block diagram of nuclear magnetic resonance spectrometer.
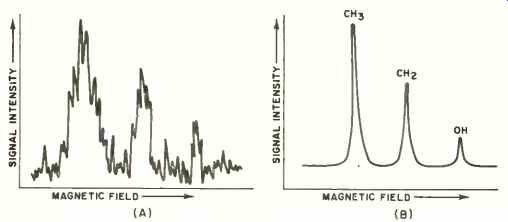
Fig. 9. Comparison of NMR spectra of ethyl alcohol (CH,CH2OH) at 40 MHz.
In (A) the resonant peaks are immersed in random noise before signal averaging.
In (B) the characteristic pattern is clearly defined by averaging over
100 repetitions of the test.
To offset this problem, a fixed time delay is established between each R-wave in order to average the complete cardiac cycle from precisely the same reference point each time. The time-delay interval is pre-set so that the heart cycle is initially scanned at the base line preceding the onset of the P-wave, this wave representing the contractions of the auricles of the heart. Fig, 6C shows an expanded trace of the cardiac cycle in which the extraneous background noise is effectively eliminated after 100 sweeps of the signal averager.
A convenient method of implementing the delay time is given in Fig. 7. Here the amplified ECG signal is simultaneously fed to a magnetic tape-recording system and the trigger circuit of the signal averager. The delayed signal is obtained because of the physical separation of the record and reproduce heads. Clearly the time delay (typically 0.2 second) is directly proportional to the distance between the heads and inversely proportional to the speed of the tape.
Pulsed Nuclear Magnetic Resonance
In many types of liquid, solid, and gaseous materials, the nuclei of certain atoms have properties similar to small magnets. Hence, they are capable of absorbing r.f. energy at specific (resonant) frequencies when these substances are subjected to a magnetic field. This phenomenon, known as nuclear magnetic resonance (NMR), provides valuable data on the molecular structure of complex mixtures and compounds, as determined by certain characteristic patterns displayed on the readout device. These spectra, which often appear as very sharp resonant lines, would be rather difficult to interpret precisely without the aid of signal recovery, since any random fluctuations in the measurement system would tend to blur the finely separated lines. With signal averaging, many rapid scans of full spectra could be accumulated to resolve the narrow spectral peaks from the extraneous background noise.
In the pulsed NMR system shown in Fig. 8, the sample specimen to be analyzed is placed within a pickup coil positioned between the poles of a permanent magnet. A driving (transmitter) coil, also contained in the magnetic field gap, is connected to a source of r.f. energy and pulsed by an electronic switch to provide a reference signal for the signal averager. Simultaneously, the magnetic field of the sweep coils is varied continuously (from zero to about 14 kilogauss) and swept through the condition of resonance.
To minimize direct coupling from the drive (r.f.) generator, the pickup coil is oriented so that its field is perpendicular to the magnetic fields of the drive and sweep coils.
As the nuclei of the sample specimen come under the influence of the swept magnetic field, they respond by " precessing," or wobbling around the direction of the field.
This phenomenon is somewhat analogous to the gyroscopic action of a spinning top. When the drive frequency of the r.f. generator is tuned so that it is equal to the frequencies of precession, the two oscillating systems are brought into resonance with each other, and the nuclei "flip" over, thereby absorbing power from the driving field. For a given drive frequency, different nuclei absorb energy at different points on the magnetic field sweep depending upon their nuclear properties. This absorption is large enough to induce a series of voltages across the pickup coil, which are amplified and detected by the receiver and presented on a chart recorder as a function of the applied field. The resultant NMR spectrum has a unique spectral position in which the number of peaks, amplitude range, and relative location of the peaks with respect to one another, yield a detailed pattern, or "fingerprint" of the molecular environment.
Fig. 9 illustrates an example of NMR spectrometry in which a very weak concentration of an unknown liquid is applied to the measurement system.
Before signal recovery is employed (Fig. 9A), the characteristic resonance peaks which would normally identify the substance, are hidden by spontaneous noise in the system. After 100 sweeps of the signal averager, the spectral lines emerge as three distinct peaks of different amplitudes (Fig. 9B), each peak corresponding to the frequency of resonant absorption. The amount of energy absorbed in the areas enclosed by the resonant peaks are observed to be in ratios of 3:2:1, which are proportional to the number of hydrogen protons in each molecular group. Thus, according to the magnetic resonance spectrum, the liquid under test is identifiable as ethyl alcohol (ethanol), whose chemical structure is designated as CH3CH2OH. Pulsed NMR measurements can also provide useful information regarding the relative strength of molecular components in a wide variety of substances. For example, the moisture content in such materials as wood, plastics, and minerals can be determined by separating the narrow resonant peaks of the water molecules from the comparatively broad peaks which characterize solid material. Similarly, the presence of oil molecules, which also exhibit sharp spectral lines, can be detected accurately in various mixtures.
In other applications, pulsed NMR techniques are used in geophysical prospecting to determine the magnetic field of various ores and rock samples, and also in making precise measurements of the earth's magnetism.