AMAZON multi-meters discounts AMAZON oscilloscope discounts
The recording of sound waves in a two-dimensional pattern (the hologram) and the use of the hologram to reconstruct the entire sound field throughout a three-dimensional region of space. Acoustical holography is an outgrowth of optical holography, invented by Dennis Gabor in 1948. The wave nature of both light and sound make holography possible. Acoustical holography involves reconstruction of the sound field that arises due to radiation of sound at a boundary, such as the vibrating body of a violin, the fuselage of an aircraft, or the surface of a submarine. Both acoustical holography and optical holography rely on the acquisition of an interferogram, a two-dimensional recording at a single frequency of the phase and amplitude of an acoustic or electromagnetic field, usually in a plane. Gabor called this interferogram a hologram.
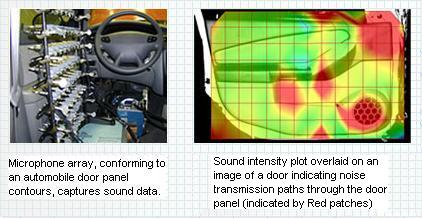
Above: To visualize noise transmission paths through a vehicle dool panel and to compare different inserts for transmission loss charecterstics.
Two distinct forms of acoustical holography exist. In farfield acoustical holography (FAH), the hologram is recorded far re moved from the source. This form of acoustical holography is characterized by the fact that the resolution of the reconstruction is limited to a half-wavelength. This resolution restriction is removed, however, when the hologram is recorded in the acoustic nearfield, an important characteristic of near-field acoustical holography (NAH), invented by E. G. Williams and J. D. Maynard in 1980.
Nearfield acoustical holography (NAH) has been used in the auto motive industry to study interior noise and tire noise, in musical acoustics to study vibration and radiation of violin-family instruments, and in the aircraft industry to study interior cabin noise and fuselage vibrations. Applications are also found in under water acoustics, especially in studies of vibration, radiation, and scattering from ships and submarines.
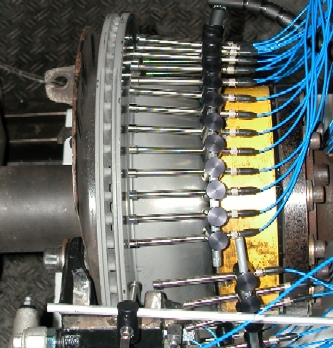
Above: Acoustic holography may be used
to visualize the location on the disc brake assembly where brake squeal
is generated. Here, a circular 38-microphone array was used to capture
acoustic pressure data close to the disc brake assembly surface.
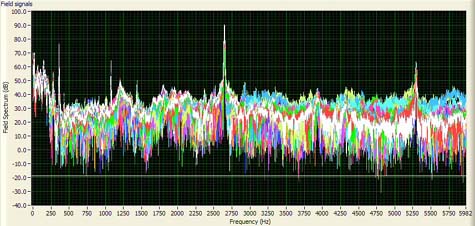
Above: Test results shows shows the frequency spectrum at a loud squeal
instant. The major squeal was found at 2649Hz and its sceond harmonic
was found at 5296Hz.
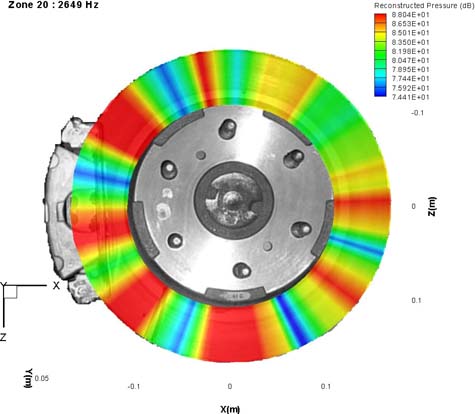
Above: Image shows the acoustic pressure
distribution at the major squeal frequency 2649Hz.
Typically, temporal acoustic data are acquired by measurement of the acoustic pressure with a single microphone or hydrophone, which scans an imaginary two-dimensional surface. In some cases, an array of microphones is used and the pressure is measured instantaneously by the array. The measured data are processed in a computer to reconstruct the pressure at the surface of the object as well as the vibration of the surface. The measured time data are Fourier-transformed into the frequency domain, creating a set of holograms, one for each frequency bin in the transform. In the inversion process, each hologram is broken up into a set of waves or modes whose propagation characteristics are known from basic principles. Each wave or mode is then back-propagated to the source surface by multiplication by the known inverse propagator, and the field is then recomposed by addition of all these waves or modes.