AMAZON multi-meters discounts AMAZON oscilloscope discounts
SOUND-ABSORBING TREATMENT
When sound impinges on the boundary surfaces of a room, part of its energy is absorbed and transmitted, and part is reflected back into the room. Sound levels in a room can be reduced by effective use of sound-absorbing treatment, such as fibrous ceiling boards, curtains, and carpets.
In the room with no acoustical treatment shown below, office workers hear direct sound energy from the computer equipment as well as reflected sound energy from the ceiling, floor, and walls. The computer operators, on the other hand, primarily hear direct sound from the nearest sound source, the computer. If sound-absorbing materials are added to the room, the office workers will hear considerably less sound because the reflected sound is reduced in their part of the room. The sound level near the computer equipment, however, is due mainly to direct sound and remains unchanged.
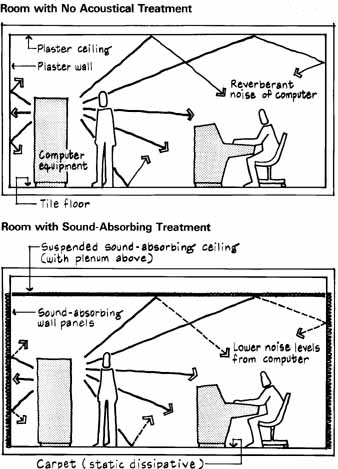
(above) Room with No Acoustical Treatment; (below)
Room with Sound-Absorbing Treatment
NOISE REDUCTION OUTDOORS AND WITHIN ENCLOSURES
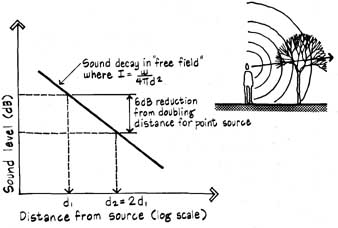
Free Field
Free-field conditions occur when sound waves are free from the influence of reflective surfaces (e.g., open areas outdoors, anechoic rooms*). Under free-field conditions, sound energy from point sources (e.g., warning siren, truck exhaust) spreads spherically and drops off 6 dB for each doubling of distance from the source. Line sources of vehicular traffic consist of successive point sources which reinforce each other. Sound energy from line sources spreads cylindrically, not spherically, and drops off only 3 dB for each doubling of distance.
Reverberant Field
Indoors, sound energy drops off under free-field conditions only near the source (usually < 5 ft for small rooms). Because room surfaces reflect sound, there will be little further noise reduction with distance away from the source (called reverberant field). The more absorption in a room, the less the buildup of sound energy in the reverberant field. As shown on the graph below, the reverberant buildup of sound is lower for situation 2 than for situation 1 due to a greater amount of absorption.
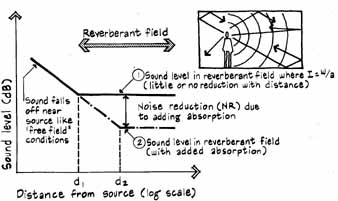
Note: Beyond distance d = sqr rt (a/(6 x pi))from the source, the sound level is relatively constant and depends primarily on the total room absorption a, where a is measured in sabins.
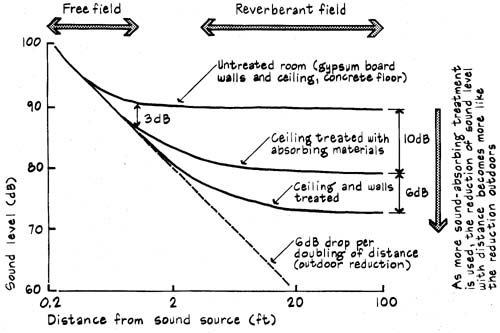
EFFECT OF ADDING SOUND-ABSORBING TREATMENT TO ROOMS
The addition of sound absorption to the ceiling of a small room (< 500 ft can reduce the reverberant sound levels by 10 dB as shown below for an example noise source. However, close to the source, the reduction will be only about 3 dB. If the ceiling and all four walls are treated with sound-absorbing material, the sound level in the reverberant field drops an additional 6 dB, but the sound levels near the source (in the free field) are not affected. Note that no reduction is achieved from further sound-absorbing treatment. Also, in this example the room initially was completely enclosed by sound-reflecting surfaces and had few furnishings to absorb sound energy. Thus a reduction of 6 to 8 dB in reverberant noise is more likely the upper limit for furnished spaces of comparable size.
SOUND ABSORPTION COEFFICIENT
The effectiveness of a sound-absorbing material can be expressed by its absorption coefficient a. This coefficient describes the fraction of the incident sound energy that a material absorbs. Theoretically, it can vary from 0 (no sound energy absorbed) to 1.0 (perfect absorption with all incident sound energy absorbed). Coefficients are derived from laboratory tests or estimated from measurements in finished rooms. In the laboratory test, sound energy from all directions is incident on the sample being tested (called random incidence).
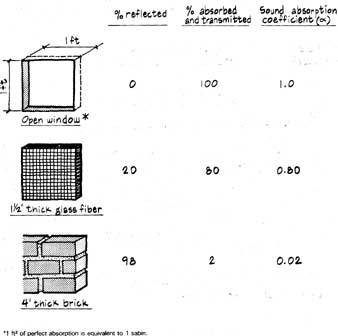
1 ft^2 of perfect absorption is equivalent to 1 sabin.
The total room absorption (i.e., the sum of all room surface areas times their respective sound absorption coefficients) for a space can be found by:
a = Sigma x S x alpha
where
S = surface area (ft^2)
a = total room absorption (sabins)
alpha = sound absorption coefficient at given frequency (decimal percent)
Absorption coefficients for building materials normally vary from about 0.01 to 0.99. However, acoustical testing laboratories sometimes report coefficients which exceed perfect absorption of 1 .0. This apparent impossibility can occur because of peculiarities of testing methods (e.g., effects from size of test specimen or exposed edges of test samples) and diffraction of sound energy.
Materials with medium to high sound absorption coefficients (usually > 0.50) are referred to as sound-absorbing; those with low coefficients (usually < 0.20) are sound-reflecting. The effect of a difference in coefficients between two materials at a given frequency is shown by the following table.
Difference in Coefficient |
Effect for Most Situations |
< 0. 10 0.10 to 0.40 > 0 40 |
Little (usually not noticeable) Noticeable Considerable |
Exceptions to the difference in absorption coefficient a given in the table are rooms used for hearing research, testing of sound-“ random incidence” alpha must have highly reflective surfaces (<<0.20). Even very small differences in alpha for the enclosing surfaces are therefore extremely important.
Note: Sound absorption coefficients for normal incidence a (i.e., sound waves perpendicular to the surface of the absorber) can be measured using a closed tube, called an impedance tube. With the sample to be tested placed at one end of the tube, pure tones can be generated and measured within the tube to determine the absorption efficiency of the sample. For materials with low absorption coefficients, alpha(n)= alpha/2 for materials with very high coefficients, alpha(n)= alpha/2. Details of the test are given by ASTM C 384.
REVERBERATION ROOMS
Reverberation rooms are fairly large (usually> 10,000 ft and all interior boundary surfaces are highly sound reflecting (a < 0.05 at 125 to 4000 Hz). Walls normally are painted concrete block, metal panels, or concrete. To pro vide isolation from exterior noises, enclosing constructions usually consist of double or triple layers (e.g., double walls, floated floors) and must be completely isolated from the rest of the building. That is, a room is constructed within a room!
Reverberation rooms can be used to measure the absorption efficiency of building materials (under provisions of ASTM test method C 423), sound power levels of noise-producing equipment (ANSI 51.21, ASHRAE 36), and can be the source or receiving room for sound transmission loss TL tests (ASTM E 90) and impact noise tests (ASTM E 492).
To measure sound absorption, a large sample of the material (72 ft is placed in the reverberation room. The time it takes a test sound signal to decay by 60 dB (roughly to inaudibility) after the source of sound is stopped is measured first with the sample in the room and again with the room empty. The difference in decay time defines the efficiency of the absorbing material. For example, the shorter the decay time, the more efficient the sound- absorbing material being tested.
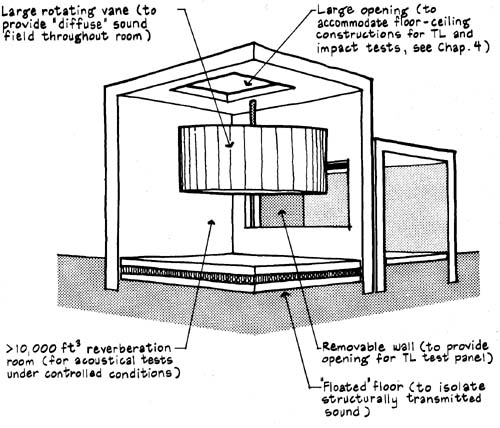
The sketch above depicts an example reverberation room which has a rotating vane to help achieve a diffuse reverberant sound field during test measurements by constantly changing the orientation of the surfaces enclosing the sound waves. The goal is to achieve diffusion over as wide a frequency range as possible. In addition, panels can be removed to provide openings between adjacent test rooms for evaluating the sound isolation effectiveness of wall and ceiling systems. The two adjacent rooms must be completely isolated from each other and from the rest of the building.
Test References
“Standard Test Method for Sound Absorption and Sound Absorption Coefficients by the Reverberation Room Method,” ASTM C 423.
Standard Method for Laboratory Measurement of Airborne Sound Transmission Loss of Building Partitions, ASTM E 90.
Standard Method of Laboratory Measurement of Impact Sound Transmission Through Floor-Ceiling Assemblies Using the Tapping Machine,” ASTM E 492.
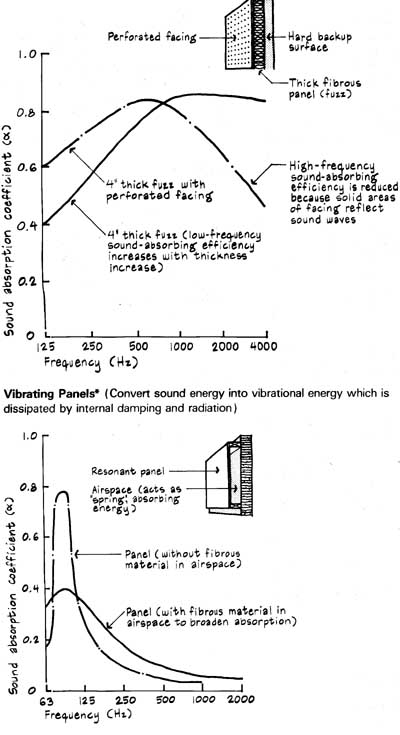
EFFECT OF THICKNESS ON ABSORPTION EFFICIENCY
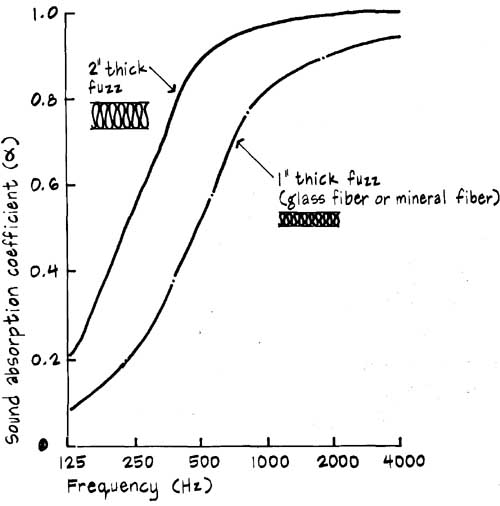
Sound absorption by porous sound absorbers (identified on drawings by a “ribbon candy” symbol) is predominately the indirect conversion of sound energy into thermal energy. The impinging sound wave has its energy reduced largely due to frictional flow resistance from the walls of mazelike interconnected pores. The amount of absorption that can be achieved is determined by the physical properties of thickness, density, and porosity for most porous materials, and fiber diameter and orientation for fibrous materials. Manufacturers try to optimize these properties to achieve high sound absorption efficiencies. Fibrous sound absorbers (such as glass fiber or mineral fiber) are sometimes referred to as fuzz.
As shown by the curves below, thickness has a significant effect on the efficiency of a porous sound absorber. It is also essential that the internal structure of a porous material has interconnected pores. For example, plastic and elastomeric foams which have closed, non-connected pores provide little sound absorption although they may be effective thermal insulators.
A simple test to determine if a porous material can be an effective sound absorber is to blow through it. If the material is thick and passes air under moderate pressure, it should be a good absorber.
Note: Porous sound absorbers are extremely poor sound isolators! Due to their soft, lightweight, interconnected structure, sound energy easily passes from one side of the material to the other. See Section 4 for a discussion of the principles of sound isolation.
RELATIVE EFFICIENCY OF SOUND ABSORBERS
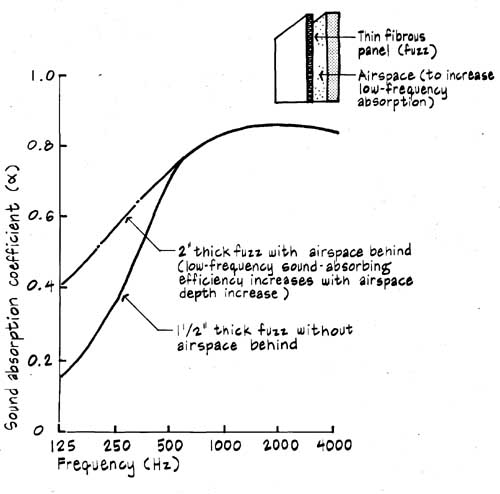
The basic types of sound absorbers are porous materials, vibrating (or resonant) panels, and volume resonators (called Helmholtz resonators). Porous sound absorbers (thick materials or thin materials with airspace behind) should be placed at location of maximum compression for impinging sound waves (e.g., lambda/4 distance from backup wall surface). Combinations of porous materials and vibrating panels or volume resonators can provide the uniform, or “flat,” sound absorption with frequency required in recording or radio/TV studios.
Thin Porous Materials (Convert sound energy into heat by friction)
Thick Porous Materials; Vibrating Panels (Convert sound energy into vibrational energy which is dissipated by internal damping and radiation)
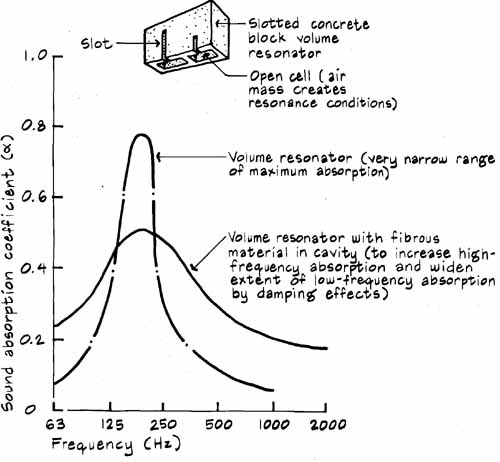
Volume Resonators (Reduce sound energy by friction at opening and by Inter-reflections within cavity)
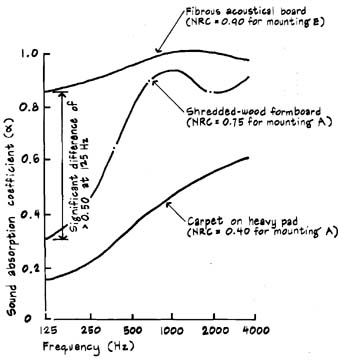
NOISE REDUCTION COEFFICIENT
The noise reduction coefficient NRC is the arithmetic average, rounded off to the nearest multiple of 0.05, of the sound absorption coefficients alpha at 250, 500, 1000, and 2000 Hz for a specific material and mounting condition. The alpha at 125 Hz and 4000 Hz, although measured during the ASTM C 423 test, are not used to calculate the NRC. Therefore, the NRC is intended as a single-number rating of sound-absorbing efficiency at mid-frequencies. It is not, as its name implies, the difference in sound levels between two conditions or between rooms (see also Section 4). The NRC can be found by:
NRC=[alpha(250) x alpha(500) x alpha(1000) x alpha(2000)]/ 4
where NRC = noise reduction coefficient (decimal percent)
alpha = sound absorption coefficient (decimal percent)
Be careful when selecting a product based on its NRC alone. Because the NRC is an average number over a limited frequency range, two materials may have identical NRCs but very different absorption characteristics. In addition, because the NRC does not include the alpha at 125 Hz and 4000 Hz, it should not be used to evaluate materials for rooms where music or speech perception is important (e.g., music practice rooms, courtrooms). As shown by the two curves at the top of the graph below, fibrous acoustical board panels have far greater absorption at 125 Hz than shredded-wood form board. Although the alpha differ by more than 0.50 at 125 Hz, the NRCs differ by only 0.15. Where low-frequency absorption may not be an important factor (e.g., lobbies, small offices), the NRC can be an adequate rating to compare materials.
EXAMPLE PROBLEM (NRC COMPUTATION)
Find the NRC for a carpet with the following sound absorption coefficients:
0.20 at 250 Hz, 0.35 at 500 Hz, 0.45 at 1000 Hz, and 0.55 at 2000 Hz.
NRC = 0.20 + 0.35 + 0.45 + 0.55 / 4 = = 155 / 4 = 0.39
This answer must be rounded off to the nearest 0.05 increment. Therefore, the NRC for this carpet will be 0.40.
SOUND ABSORPTION DATA FOR COMMON BUILDING MATERIALS AND FURNISHINGS
Material |
Sound Absorption Coefficient (125 Hz, 250 Hz, 500 Hz, 1000 Hz, 2000 Hz, 4000 Hz) |
NRC Number |
Walls: Sound-Reflecting: 1. Brick, unglazed 2. Brick, unglazed and painted 3. Concrete, rough 4. Concrete block, painted 5. Glass, heavy (large panes) 6. Glass, ordinary window 7. Gypsum board, 1/2 in thick (nailed to 2 X 4s, 16 in oc) 8. Gypsum board, 1 layer, 5/8 in thick (screwed to 1 X 3s, 16 in oc with airspaces filled with fibrous insulation) 9. Construction no. 8 with 2 layers of 5/8-in-thick gypsum board 10. Marble or glazed tile 11. Plaster on brick 12. Plaster on concrete block (or 1 in thick on lath) 13. Plaster on lath 14. Plywood, 3/8-in paneling 15. Steel 16. Venetian blinds, metal 17. Wood, 1/4-in paneling, with airspace behind 18. Wood, 1-in paneling with airspace behind Sound-Absorbing: 19. Concrete block, coarse 20. Lightweight drapery, 10 oz/yd flat on wall (Note: Sound-reflecting at most frequencies.) 21. Medium-weight drapery, 14 oz/yd draped to half area (i.e., 2 ft of drapery to 1 ft of wall) 22. Heavyweight drapery, 18 oz/yd draped to half area 23. Fiberglass fabric curtain, 8 1/2 oz/yd draped to half area (Note: The deeper the airspace behind the drapery (up to 12 in). the greater the low-frequency absorption.) 24. Shredded-wood fiberboard, 2 in thick on concrete (mtg. A) 25. Thick, fibrous material behind open facing 26. Carpet, heavy, on 5/8-in perforated mineral fiberboard with airspace behind 27. Wood, 1/2-in paneling, perforated 3/16-in-diameter holes, 11 % open area, with 2 1/2-in glass fiber in airspace behind Floors: Sound- Reflecting: 28. Concrete or terrazzo 29. Linoleum, rubber, or asphalt tile on concrete 30. Marble or glazed tile 31. Wood 32. Wood parquet on concrete Sound-Absorbing: 33. Carpet, heavy, on concrete 34. Carpet, heavy, on foam rubber 35. Carpet, heavy, with impermeable latex backing on foam rubber 36. Indoor-outdoor carpet Ceilings Sound-Reflecting: 37. Concrete 38. Gypsum board, 1/2 in thick 39. Gypsum board, 1/2 in thick, in suspension system 40. Plaster on lath 41. Plywood, 3/8 in thick Sound-Absorbing: 42. Acoustical board, 3/4 in thick, in suspension system (mtg. E) 43. Shredded-wood fiberboard, 2 in thick on lay-in grid (mtg. E) 44. Thin, porous sound-absorbing material, 3/4 in thick (mtg. B) 45. Thick, porous sound-absorbing material, 2 in thick (mtg. B), or thin material with airspace behind (mtg. D) 46. Sprayed cellulose fibers, 1 in thick on concrete (mtg. A) 47. Glass-fiber roof fabric, 12 oz/yd 48. Glass-fiber roof fabric, 37 1/2 oz/yd (Note: Sound-reflecting at most frequencies.) 49. Polyurethane foam, 1 in thick, open cell, reticulated 50. Parallel glass-fiberboard panels, 1 in thick by 18 in deep, spaced 18 in apart, suspended 12 in below ceiling 51. Parallel glass-fiberboard panels, 1 in thick by 18 in deep, spaced 6 1/2 in apart, suspended 12 in below ceiling Seats and Audience 52. Fabric well-upholstered seats, with perforated seat pans, unoccupied 53. Leather-covered upholstered seats. unoccupied 54. Audience, seated in upholstered seats 55. Congregation, seated in wooden pews 56. Chair, metal or wood seat, unoccupied 57. Students, informally dressed, seated in tablet-arm chairs Openings 58. Deep balcony, with upholstered seats 59. Diffusers or grilles, mechanical system 60. Stage Miscellaneous 61. Gravel, loose and moist, 4 in thick 62. Grass, marion bluegrass, 2 in high 63. Snow, freshly fallen, 4 in thick 64. Soil, rough 65. Trees, balsam firs, 20 ft ground area per tree, 8 ft high 66. Water surface (swimming pool) |
|
|
NRC (noise reduction coefficient) is a single-number rating of the sound absorption coefficients of a material. It is an average that only includes the coefficients in the 250 to 2000 Hz frequency range and therefore should be used with caution. See page 50 for a discussion of the NRC rating method.
* Refer to manufacturer’s catalogs for absorption data which should be from up-to-date tests by independent acoustical laboratories according to current ASTM procedures.
**Coefficients are per square foot of seating floor area or per unit. Where the audience is randomly spaced (e.g., courtroom, cafeteria), mid-frequency absorption can be estimated at about 5 sabins per person. To be precise, coefficients per person must be stated in relation to spacing pattern.
***The floor area occupied by the audience must be calculated to include an edge effect at aisles. For an aisle bounded on both sides by audience, include a strip 3 ft wide; for an aisle bounded on only one side by audience, include a strip 1 1/2 ft wide. No edge effect is used when the seating abuts walls or balcony fronts (because the edge is shielded). The coefficients are also valid for orchestra and choral areas at 5 to 8 ft per person. Orchestra areas include people, instruments, music racks, etc. No edge effects are used around musicians.
Coefficients for openings depend on absorption and cubic volume of opposite side.
Test Reference
“Standard Test Method for Sound Absorption and Sound Absorption Coefficients by the Reverberation Room Method,” ASTM C 423. Available from American Society for Testing and Materials (ASTM), 1916 Race Street, Philadelphia, PA 19103,
Sources
1. L. L. Beranek, “Audience and Chair Absorption in Large Halls,” Journal of the Acoustical Society of America, January 1969.
2, A. N. Burd et al., “Data for the Acoustic Design of Studios,” British Broadcasting Corporation, BBC Engineering Monograph no. 64, November 1966.
3. E. J. Evans and E. N. Bazley, “Sound Absorbing Materials,” H. M. Stationery Office, London, 1964.
4. R. A. Hedeen, Compendium of Materials for Noise Control, National Institute for Occupational Safety and Health (NIOSH), Publication no. 80-116, Cincinnati, Ohio, May 1980. (Contains sound absorption data on hundreds of commercially available materials.)
5. H. F. Kingsbury and W. J. Wallace, “Acoustic Absorption Characteristics of People,” Sound and Vibration, December 1968.
6. 1. Mariner, “Control of Noise by Sound-Absorbent Materials,” Noise Control, July 1957.
7. J. E. Moore and R. West, “In Search of an Instant Audience,” Journal of the Acoustical Society of America, December 1970.
8. R. Moulder and J. Merrill, “Acoustical Properties of Glass Fiber Roof Fabrics,” Sound and Vibration, October 1983.
9. “Performance Data, Architectural Acoustical Materials,” Acoustical and Insulating Materials Association (AIMA). (This bulletin was published annually from 1941 to 1974.)
10. W. E. Purcell, “Materials for Noise and vibration Control,” Sound and Vibration, July 1982.
11. W. Siekman, “Outdoor Acoustical Treatment: Grass and Trees,” Journal of the Acoustical Society of America, October 1969.
12. “Sound Conditioning with Carpet,” The Carpet and Rug Institute, Dalton, Ga., 1970.
Note: For flame spread ratings of finish materials, refer to current edition of “Building Materials,” available from Underwriters’ Laboratories (UL), North brook, IL 60062.
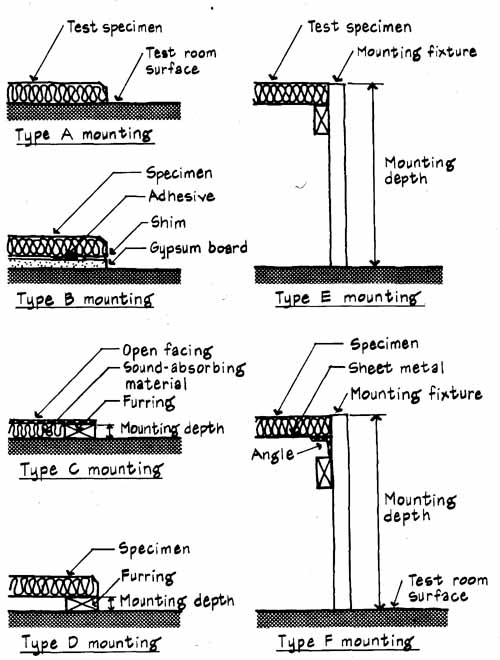
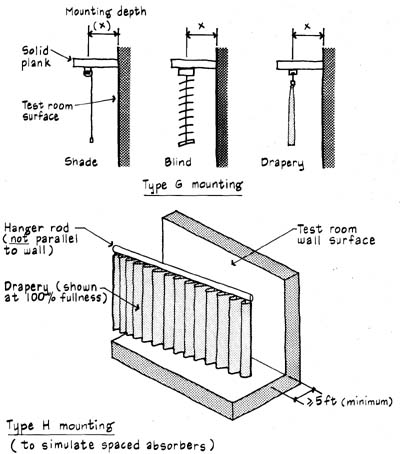
LABORATORY TEST MOUNTINGS
Laboratory tests to determine sound absorption efficiency should be con ducted according to the current ASTM C 423 procedures. The types of mounting shown below are intended to represent typical installation methods for sound-absorbing materials used in buildings. Mountings A, B, D, and F apply to most prefabricated products, F to sound-absorbing mechanical air-duct linings, and C is used for specialized applications. Numerical suffix indicates distance in millimeters that the test specimen is from test room surface (e.g., E-400 is mounting depth of 400 mm or 15 3/4 in).
When data is reported, the mounting method used during the test always should be indicated along with the sound absorption coefficients. Without identifying the mounting method, sound absorption data will be meaningless. For example, a product having an advertised sound absorption coefficient of 0.80 was used in a finished space; however, a sound absorption coefficient of only 0.40 was achieved because the actual installation (mounting A) did not duplicate the laboratory test, which had a deep airspace behind the sound- absorbing material (mounting E).
Samples to be evaluated by the ASTM C 423 laboratory test are installed on the floor of the reverberation room as depicted above. Therefore, the illustrations for mountings A through F appear to be upside down for ceiling applications.
Note: Numerical mounting designations by the Ceilings and Interior Systems Construction Association (CISCA) correspond to the ASTM mountings as follows: 1 is B, 2 is D, 4 is A, 5 is C, 6 is F, and 7 is E.
References
“Practice for Mounting Test Specimens During Sound Absorption Tests,” ASTM E 795. “Standard Test Method for Sound Absorption and Sound Absorption Coefficients by the Reverberation Room Method,” ASTM C 423.
PREFABRICATED SOUND-ABSORBING MATERIALS
Generic examples of the numerous commercially available prefabricated sound-absorbing materials are shown below. Most sound-absorbing tiles and panels are not sufficiently durable for wall application. For walls, use fibrous materials with protective open facings (e.g., perforated or expanded metal, perforated hardboard, metal slats), fabric-covered panels, or shredded-wood form-board.
Use membrane-faced or ceramic tile materials for humid environments such as swimming pools, locker rooms, and kitchens. (Sound energy readily passes through membranes with a thickness of less than 1 mil.)
Observe manufacturer’s recommendations for the cleaning and painting of porous sound-absorbing materials. Lightly tint or stain, rather than paint, sound-absorbing materials, because painting can seriously diminish the sound- absorbing efficiency by clogging the openings. For many situations, spray applications can achieve a thinner coating than brushes or rollers. (The out-of-print AIMA booklet “How to Clean and Maintain Acoustical Tile Ceilings” presents useful guidelines.) When in doubt, a painted specimen can be tested according to the provisions of ASTM C 643 to determine effects of paint (or compare painted to unpainted specimens following ASTM E 1050 procedures for determining absorption using an impedance tube).
aa-57.jpg
aa-58.jpg
Regular Perforated Tile; Fissured Tile or Panel; Random Perforated Tile; Textured and /or Patterned Tile or Panel; Slotted Tile or Panel; Membrane-Faced or Ceramic Tile Materials; Shredded-Wood Formboard; Glass-Fiber Blankets and Boards; Smooth Spray-On Material (Mineral or Cellulose Fibers)
Openings provide about 15 percent open area to allow painting without bridging over the holes. Avoid using oil and rubber-base paints which may clog pores. Materials with large perforations normally can be painted without serious reduction of sound-absorbing efficiency.
Use spray-on materials at 1 to 3 in thickness on hard backup surface or apply to open lath, which can provide increased absorption at low frequencies due to resonant-panel effects.
AREA EFFECT FOR SPACED SOUND ABSORBERS
The efficiency of a sound-absorbing material can be affected by its distribution and location in a room. For example, 25 panels of sound-absorbing material, each 2 ft by 2 ft. will absorb more sound energy per panel when spaced in a “checkerboard” pattern on a 200-ft plaster ceiling than a uniform coverage of the same material.
This increase in efficiency (called the area effect) is due to the diffraction of sound energy around the perimeters of the spaced sound-absorbing panels and to the additional absorption provided by the exposed panel edges. The efficiency of sound-absorbing panels increases as the ratio of perimeter to surface area increases. The 25 spaced absorbers have a ratio of perimeter to surface area 5 times the ratio for the 25 uniform-coverage absorbers. Sound energy reflected from the hard-surfaced plaster adjacent to the absorbent edges in the checkerboard configuration tends to spill over onto the absorbing panels. Therefore, the spaced absorbing material absorbs more sound energy than would be accounted for by its area. This kind of surface treatment also can be used to achieve a diffuse sound field, which is desired in music practice rooms. Note that the total absorption contributed by spaced absorbers in this example will only be slightly less than the absorption provided by coverage of the entire 200-ft ceiling.
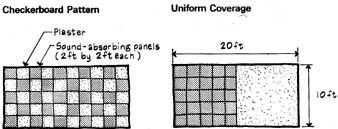
Checkerboard Pattern; Uniform Coverage
Reference
T. W. Bartel, “Effect of Absorber Geometry on Apparent Absorption Coefficients as Measured in a Reverberation Chamber,” Journal of the Acoustical Society of America, April 1981.
SUSPENDED SOUND-ABSORBING PANELS AND UNITS
Sound-absorbing materials are commercially available for installation in a spaced regular pattern. When these units (or panels) are installed with all edges and sides exposed, they can provide extremely high absorption per square foot of material because at least six surfaces will be exposed to sound waves. Absorption data for spaced units are normally presented in terms of sabins per unit at the recommended spacings. Note that the total absorption from suspended units is limited by the quantity that can be installed at the recommended spacings. For example, suspended units tend to shield each other when their density (expressed as ratio of exposed surface area of absorbers to area of ceiling) exceeds 0.5.
Examples of parallel, honeycomb, and egg-crate layout patterns of suspended, sound-absorbing panels are shown below. Suspended spaced absorbers can be used where a uniform or continuous application of conventional sound-absorbing materials is not feasible (e.g., industrial plants with extremely high ceilings).
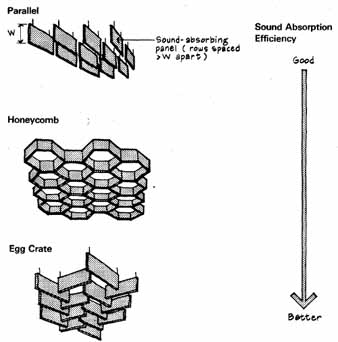
Sound Absorption Efficiency of layout patterns: Parallel
vs. Honeycomb vs. Egg Crate
Note: Suspended flat-panel and spaced sound-absorbing units (e.g., prisms, cones, tetrahedrons) should be well braced to prevent motion from air circulation in rooms.
APPLICATIONS FOR SOUND-ABSORBING MATERIALS
Reverberation Control
Sound-absorbing materials can be used to control reverberation so speech will not be garbled. The larger the room volume, the longer the reverberation time because sound waves will encounter room surfaces less often than in small rooms. Each doubling of the total amount of absorption in a room reduces the reverberation time by one-half. Sound absorption can make the sound seem to come directly from the actual source rather than from every where in the room. For example, in recreational facilities, it's important that instructions and warnings be identified with the actual source location.
Noise Reduction in Rooms
When correctly used, sound-absorbing materials can be effective in con trolling noise buildup within a room. However, they have a limited application for noise control and are not the panacea for all noise problems. For example, each doubling of the total amount of absorption in a room reduces the noise level by only 3 dB. Thus, as with other aspects of sound behavior, the law of diminishing returns can quickly limit the effectiveness of this approach to noise control. In large open-plan rooms, sound-absorbing materials can contribute to speech privacy by causing sound energy to decrease with distance according to the inverse-square law (see Section 6).
Echo Control
Sound-absorbing materials can be used to control echoes (usually simultaneously with controlling reverberation). Echoes are long-delayed, distinct re flections of sufficient sound level to be clearly heard above the general reverberation as a repetition of the original sound. Flutter echo, which can be heard as a rattle” or “clicking” from a hand clap, may be present in small rooms (or narrow spaces with parallel walls). It also can be effectively controlled with sound-absorbing materials. Control measures for creep echo (useless sound reflections concentrated near and along smooth concave surfaces) are presented in Section 3.
REVERBERATION TIME
Until the pioneering work of Wallace Clement Sabine, beginning in 1895 at age 27, criteria for good listening conditions in rooms were largely nonexistent. Professor Sabine was asked to improve the atrocious listening conditions for speech in the new lecture hall in the Fogg Art Museum, Harvard University, Cambridge, Massachusetts (Richard Morris Hunt, architect; see plan and section drawings below). Sound in the hall would persist for about 5 1/2 s due to the multiple reflections from the hard-surfaced plaster finish materials in the hail. Because most English-speaking persons can complete 15 syllables in 5 1/2 s, words were almost impossible to understand nearly everywhere in the hall.
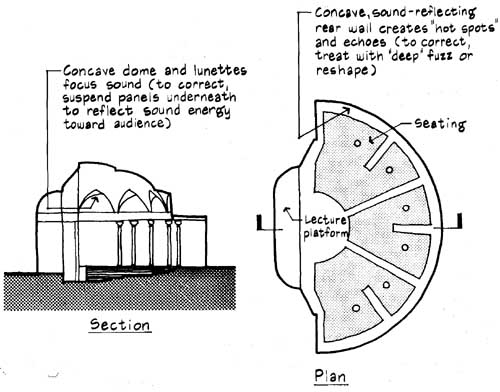
Section; Plan
Sabine recognized that the problem of the persistence of reflected sound energy was due to the size of the room* and its furnishings, including the occupants. He called this persistence the “duration of audibility of residual sound.” Repeated tests were conducted in the hall using organ pipes as noise sources. The organ pipes had an initial sound level in the hall of about 60 dB above a young listener’s threshold of audibility at a frequency of 512 Hz.
The size of a room affects the average length of reflections, called the mean free path. Note: The mean free path is approximately equal to 4V/S, where V is room volume in cubic feet and S is surface area in square feet.
Sabine used his disciplined sense of hearing to judge when the sound from the organ pipes ceased to be audible. The time it took the sound to decay the estimated 60 dB (or to one-millionth, 1 / 1000000) of its initial sound level was measured by chronograph and defined by Sabine to be what is now called the reverberation time. Sabine was able to conduct his tests only at night (between midnight and 5 a.m.) when it was relatively quiet—after the streetcars stopped running and before the milkmen started rattling their carts over the cobblestones.
With the help of two student laboratory assistants, seat cushions were borrowed from nearby Sanders Theater. These 3-in-thick cushions were made of porous, sound-absorbing hair-fiber material covered with canvas and light damask cloth. The more cushions brought in, the greater the total room absorption and the lower the reverberation time. Sabine found that he could lower the reverberation time to about 1 s when nearly 550 cushions, each r- about 1 m long, covered the platform, bench seats, aisles, and rear wall to the ceiling. Consequently, the first unit of sound absorption was a meter length of a seat cushion from the Sanders Theater!
The results of Sabine’s work made it possible to plan reverberation time in advance of construction. For the first time, desired reverberation time in rooms, at least at 512 Hz, could be the result of design, not luck or faithful re production. The equation which Sabine defined and proved empirically is:
T=0.05 (V/a))
where T = reverberation time, or time required for sound to decay 60 dB after the source has stopped (s)
V = room volume (ft)
a = total ft of room absorption (sabins, so named to honor W. C. Sabine)
The above formula (often referred to as the Sabine formula) is generally used by testing laboratories to compute absorption coefficients and is appropriate for use in most architectural work. It is reasonably accurate when sound field conditions are diffuse (e.g., sound absorption uniformly distributed) and room dimensions don't vary widely (e.g., compact rooms without one extremely long dimension, rooms without deep side pockets, or transepts in a church). It should not be used for recording studios or anechoic chambers, which have extremely high ratios of absorption to room volume. In these cases the Eyring formula should be used.
References
L. L. Beranek, “The Notebooks of Wallace C. Sabine,” Journal of the Acoustical Society of America, March 1977.
L. L. Beranek and J. W. Kopec, “Wallace C. Sabine, Acoustical Consultant,” Journal of the Acoustical Society of America, January 1981.
W. D. Orcutt, Wallace Clement Sabine, A Biography, Plimpton, Norwood, Mass., 1933 (no longer in print, but should be available in most university libraries).
W. C. Sabine, Collected Papers on Acoustics, Dover, New York, 1964 (reprint of 1922 Harvard University Press publication).
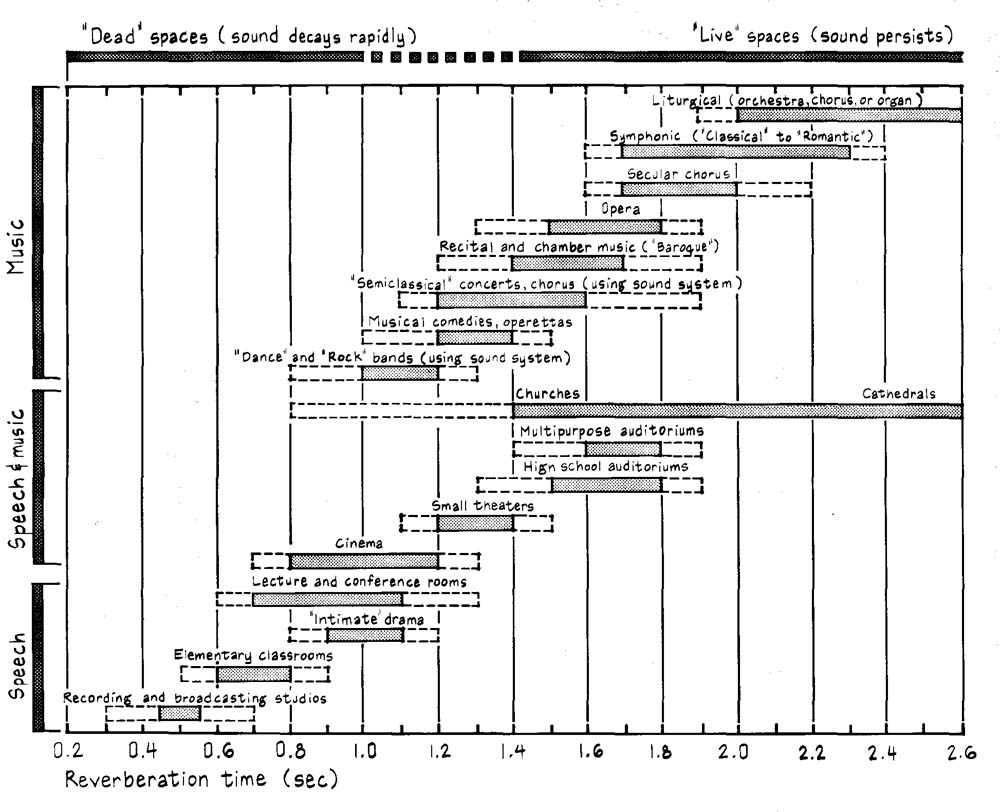
OPTIMUM REVERBERATION TIME
The preferred ranges of reverberation time at mid-frequency (average of reverberation at 500 and 1000 Hz) for a variety of activities are given on the bar graph below. The ranges, based on the experience of normal-hearing listeners in completed spaces, are extended by dashed sections at the ends of the bars to indicate the extreme limits of acceptability. Satisfactory listening conditions can be achieved in auditoriums which have different reverberation times within the preferred range, provided other important acoustical needs are fulfilled. In general, large rooms should be nearer the upper end of the reverberation time ranges than smaller rooms of the same type (see Section 3). For ex ample, liturgical organ music is composed for church- or cathedral-sized rooms; chamber music is intended for small rooms.
Note: Long reverberation times degrade speech perception
of hearing-impaired persons far more than normal-hearing persons.
For hearing-impaired and elderly listeners, reverberation times
should be well below most of the values in the graph (e.g., < 0.5
s for satisfactory speech perception).
Reference
R. B. Newman, “Acoustics” in J. H. Callender (ed.), Time-Saver Standards for Architectural Design Data, McGraw-Hill, New York, 1974, p. 696.
Next: Example Problem (Reverberation Time)
Prev: Introduction