AMAZON multi-meters discounts AMAZON oscilloscope discounts
ANCIENT THEATERS
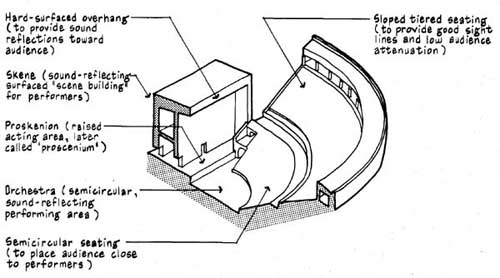
Open-air Greek and Roman theaters (constructed about 2000 years ago) most often had good listening conditions for drama and instrumental recitals by small groups. The Greek theaters usually were located on steep hillsides in quiet rural locations. Successful sites had few gusty winds (which cause noise when they blow past trees, buildings, and audience). Seating layouts were semicircular so the audience would be close to the stage, thus reducing sound energy loss by distance (see Section 1 for inverse-square law). The tiers were constructed with a steep rise (> 200) to provide good sight lines, permit reflected sound energy from the orchestra floor, and reduce attenuation caused by the seated audience. The unoccupied seats (with backs or risers sloped backward by about 100) and the heads of the audience also scattered sound to adjacent areas (cf., R. S. Shankland, “Acoustics of Greek Theatres,” Physics Today, October 1973). In addition, actors wore masks which exaggerated their expressions and reinforced their voices since conical-shaped megaphones were built into the mouths of the masks. However, onstage whispers were not audible throughout the audience area. Some characteristic de sign features of ancient theaters are shown below.
Modern open-air theaters should be designed to achieve low noise intrusion (see Section 4) and satisfactory distribution of sound. However, an enclosure is required to achieve the reverberation and fullness of tone needed for modern symphonic music and opera (especially since the nineteenth century).
Note: For comprehensive studies of the development of the ancient theater, see:
M. Bieber, The History of Greek and Roman Theater, Princeton University Press, Princeton, N.J., 1961, and G. C. lzenour, Theater Design, McGraw-Hill, New York, 1977.
DIRECTIVITY CONTOURS FOR SPEECH
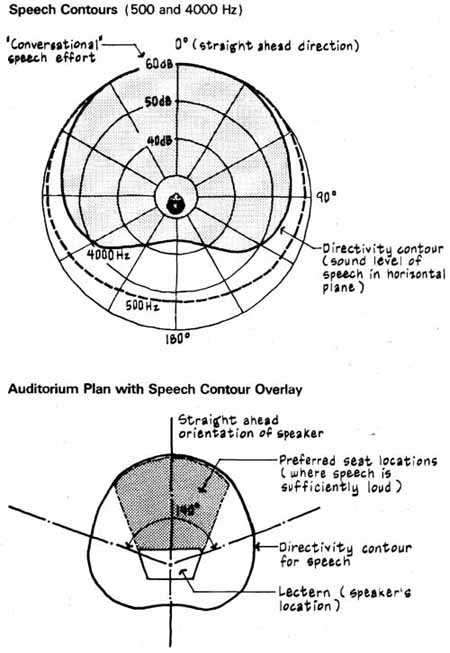
The polar coordinate graph below plots contours of sound levels for speech. The shapes of the contours show the directional characteristics of speech at low frequencies (<= 500 Hz to represent vowels, which contribute to the tone of an individual’s speech) and at high frequencies (=> 4000 Hz to re present consonants, which strongly influence intelligibility of sibilants). 00 is the direction the speaker is facing, 180° the direction behind the speaker. Sound levels at low frequencies are diminished very little at the sides (90° orientation) and moderately at the rear (8 dB lower). However, sound levels at high frequencies are diminished by about 6 dB at the sides and 20 dB (about one- fourth as loud) at the rear. When speakers turn their backs to the audience, consonants can become completely inaudible!
Speech Contours (500 and 4000 Hz); Auditorium Plan with Speech
Contour Overlay
AUDIENCE SEATING
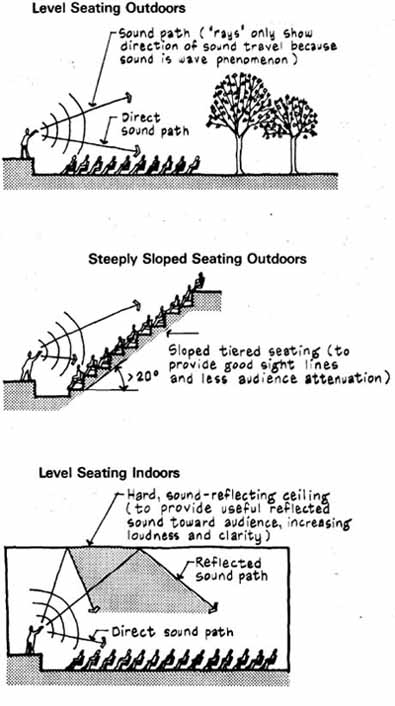
Sound level outdoors falls off with distance (as sound spreads outward it loses energy according to the inverse-square law) and from audience attenuation (as sound grazes the seated audience it's scattered and absorbed). When steeply sloped seating is used, the sound level outdoors falls off primarily with distance. An overhead sound-reflecting panel or ceiling, as shown by the illustration below, can provide reflected sound to rein: force the direct sound. For example, installing a hard, sound-reflecting enclosure outdoors near the sound source can greatly improve listening conditions by reflecting sound energy toward the audience and by shielding the audience from noise sources located behind the enclosure.
Level Seating Outdoors; Steeply Sloped Seating Outdoors; Level
Seating Indoors
SIGHT LINE BASICS
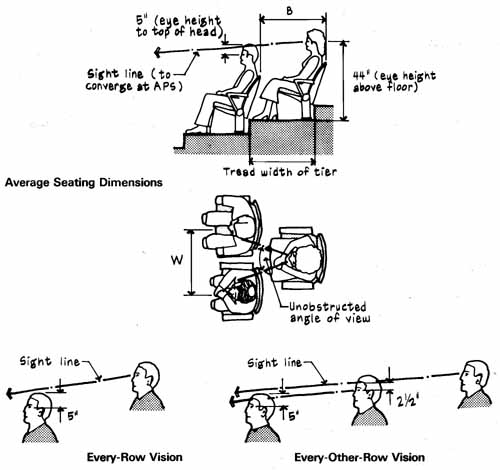
Unobstructed sight lines (i.e., straight lines drawn from eyes of seated occupants to stage area) from all seats to the front of the forestage allow full view of performers and unobstructed propagation of the direct sound. Sight lines are normally drawn to converge at a point on stage called the arrival point of sight APS. Audiences should be able to hear and to see clearly and comfortably to fully perceive the intended effects of performances. Laterally staggered seating layouts can achieve satisfactory every-other-row vision for back- to-back seat dimension B of 40 in for continental seating and 36 in for radial and parallel aisle seating. Non-staggered seating layouts can't achieve satisfactory conditions for every-other-row vision (cf., G. C. Izenour, Theater Design, McGraw-Hill, New York, 1977, p. 26). Shown below are sight lines for every-row and every-other-row seating layouts, and average seating dimensions.
Average Seating Dimensions; Every-Row Vision; Every-Other-Row
Vision; Note: To achieve liveness within a reasonable room volume, the
back-to-back seat dimension B and center-to-center seat dimension W should
be as small as possible consistent with the requirements for comfort and life safety.
SIGHT LINE LAYOUTS
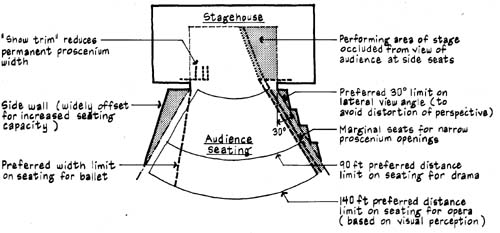
For proscenium theaters, lateral sight lines (shown in plan view below) normally should be within a preferred “view angle” of 300. View angle is measured from the perpendicular at the end of the proscenium opening. In multi purpose auditoriums, the proscenium line may vary from full width for ballet and symphonic orchestra (often located downstage to provide orchestra en closure of shallow depth) to smaller widths for drama and music performance by soloists.
Plan View
Detail at Stage
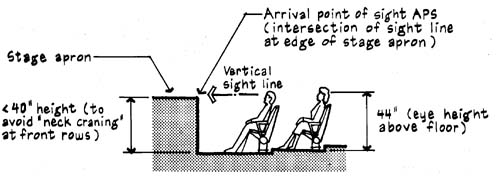
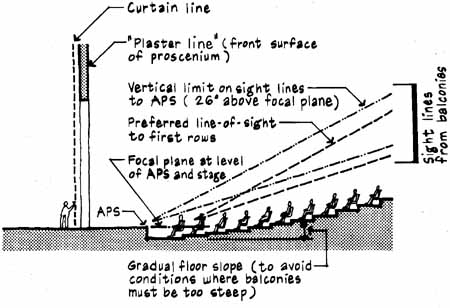
Floor and balcony slopes should be designed so seated audience will have unobstructed view of entire performing area, performers, and scenery. For ex ample, the vertical sight lines shown below illustrate acceptable viewing conditions and preferred layout of seating in the front of auditorium where an uninterrupted view of entire stage floor is essential for ballet. Balconies should not have excessive floor slope (> 26°), and the top balcony should not be more than 65 ft above the stage to avoid vertigo. A balcony view of the first few rows of main floor seating also may be desirable to achieve a sense of congregation with audience below and the proscenium arch should not obstruct the view of bottom 7 ft of the backstage wall.
Section View
References
J. R. Hyde and J. von Szeliski, “Acoustics and Theater Design,” 12th International Congress on Acoustics, Proceedings of the Vancouver Symposium on Acoustics and Theatre Planning for the Performing Arts, August 1986, pp. 55-60.
J. Mielziner, Theatre Check List, Wesleyan University Press, Middletown, Conn., 1969.
CHECKLIST FOR LECTURE ROOMS
When auditoriums are used primarily for speech (e.g., theaters, conference rooms, classrooms), the design goal should be high intelligibility of spoken words throughout the room. To achieve high signal-to-noise ratios (> 15 dB), rooms should be shaped to direct sound from the speaker’s location toward the audience, designed to avoid echoes and “hot” (or “bright”) spots, and planned to have low background noise levels. Important acoustical parameters affecting the perception of speech in lecture rooms are summarized by the list below.
1. To help achieve satisfactory loudness, provide compact room shape with relatively low room volume. Volume per seat ratio should be 80 to 150 ft per person.
2. Reverberation times should be less than 1.2 s from 250 to 4000 Hz for theaters and less than 0.8 s for classrooms. Long reverberation times reduce the intelligibility of speech the same way noise masks speech signals (see Section 6). Select sound-absorbing finishes so absorption will be constant within the frequency range for speech. It is preferable to place absorption on side walls rather than on ceilings. In small rooms, use sound-absorbing panels with air space behind to prevent “boominess” at low frequencies.
3. Distance between speaker and the rear of the audience area should be short so that loudness will be sufficient throughout the room and the audience will have ability to see the person talking. For drama, it's difficult to see expressions of performers beyond 40 ft gestures beyond 65 ft. and large body movements beyond 100 ft. For fan-shaped rooms, seating should be within 1400 angle measured at the location of the speaker (see auditorium plan).
4. Ceiling or overhead sound-reflecting surfaces should provide short-delayed sound reflections directly to the audience (i.e., path differences between direct and reflected sound should be less than 34 ft).
5. Seating should be sloped greater than 70 to provide good sight lines and re duce audience attenuation. (Without electronic speech reinforcement, 1000 seats is about the upper limit for drama using a proscenium stage; 700 seats using an open or thrust stage; and 400 seats using an arena stage.)
6. Background noise levels from the mechanical system should not exceed 34 dBA or noise criterion NC-25. Enclosing constructions should reduce intruding noise to below this preferred criterion to avoid interference with desired sounds and prevent distractions (see Section 4). Even lower limits should be considered where rooms are to be used by young children, older adults, or hearing-impaired persons.
7. When seating capacity exceeds about 500, provide a sound-reinforcing system to augment the natural sound from source to listener ( see Section 7). Smaller lecture rooms, courtrooms, conference rooms, and the like may also require a sound-reinforcing system to assist weak-voiced speakers and to project recorded material evenly. (Be careful because electronically reproduced sound may sound “harsh” and unnatural when played in rooms with extremely low reverberation times.)
REFLECTION, DIFFUSION, AND DIFFRACTION
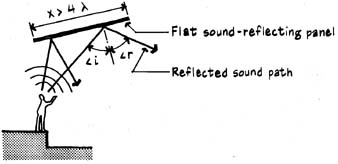
Reflection (x > 4 λ)
Reflect/on is the return of a sound wave from a surface. If the surface dimension x is larger than about 2 to 4 times the wavelength (λ) of the impinging sound wave, the angle of incidence angle i will equal the angle of reflection angle r. For example, 1000 Hz corresponds to a wavelength of 1.1 It; therefore, a surface dimension (length or width) of about 4 λ = 4 X 1.1= 4 1/2 ft will reflect sound energy wavelengths of 1000 Hz and above. When an array of suspended panels is used to direct reflected sound energy toward the audience, the individual panels should be of varying sizes to prevent creating a “rasping” sound.
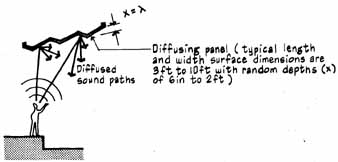
Diffusion (x = λ)
Diffusion is the scattering or random redistribution of a sound wave from a surface. It occurs when the surface depths of hard-surfaced materials are com parable to the wavelengths of the sound. Diffusion does not “break up” or absorb sound—sound is not fragile or brittle. However, the direction of the incident sound wave is changed as it strikes a sound-diffusing material. Diffusion is an extremely important characteristic of rooms used for musical performances. When satisfactory diffusion has been achieved, listeners will have the sensation of sound coming from all directions at equal levels.
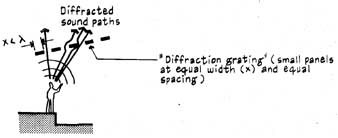
Diffraction (x < λ)
Diffraction is the bending or “flowing” of a sound wave around an object or through an opening. For example, a truck located behind a building can be heard because the sound waves bend around the corners. In auditoriums, be cause impinging sound waves will readily diffract around panels that are smaller than their wavelength, suspended panels must be carefully designed to be large enough (length and width) to effectively reflect the desired wavelengths of sound.
A single frequency can be emphasized (called diffraction grating effect) when an array of small overhead panels are of equal length and width or vertical projecting slats on walls are of equal depth and spacing. This phenomenon must be avoided because it can impart an odd tonal distortion to music due to cancellation effects.
Reference
A. W. Leonard, L. P. Delsasso, and V. 0. Knudsen, “Diffraction of Sound by an Array of Rectangular Reflective Panels,” Journal of the Acoustical Society of America, December 1964.
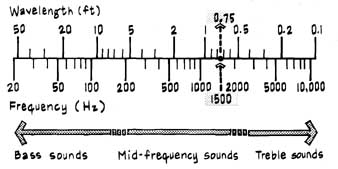
WAVELENGTH AND FREQUENCY FOR SOUND IN AIR
The scale below shows the relationship of wavelength and frequency for sound in air under normal conditions of temperature and atmospheric pressure. For example, below 1500 Hz many musical instruments are omnidirectional (i.e., they radiate sound energy in all directions). From the scale, at 1500 Hz the wavelength of sound is 0.75 ft, or 9 in, and 4 = 4 X 9 = 36 in. There fore, panel dimensions greater than 3 ft will be required to reflect sound energy at 1500 Hz (and higher).
Most musical instruments don't , however, radiate sound in all directions at the same sound level. The directional characteristics of example wind instrument (trombone) and string instrument (cello) are shown below. The shaded portion between sound rays on the illustrations indicate where the sound level is within 3 dB of its maximum level. Note that sound from a trombone is directed primarily toward the front at high frequencies and to the ceiling at low frequencies. For a comprehensive presentation of the complex directional characteristics of musical instruments, see J. Meyer, Acoustics and the Performance of Music, Verlag Das Musikinstrument, Frankfurt, F.R.G., 1978.
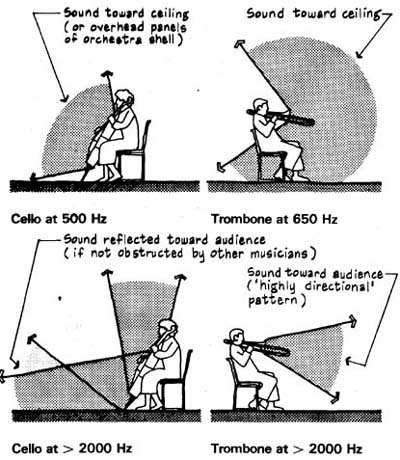
Cello at 500 Hz; Trombone at 650 Hz; Cello at> 2000 Hz;
Trombone at> 2000 Hz
PATTERN OF REFLECTED SOUND
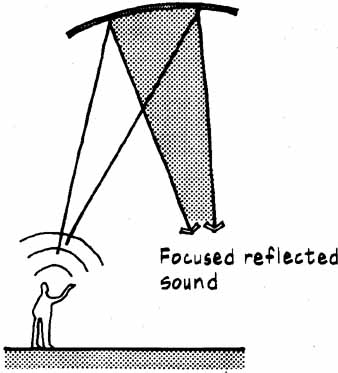
Shown below in order of increasing effectiveness for distributing sound are concave, flat, and convex sound-reflecting surfaces. The shading on the illustrations indicates the distribution pattern of reflected sound energy from equivalent lengths of reflector.
Concave Reflector
Concave sound-reflecting surfaces (such as barrel-vaulted ceilings in churches and curved rear walls in auditoriums) can focus sound, causing hot spots and echoes in the audience seating area. Because concave surfaces focus sound, they also are poor distributors of sound energy and therefore should be avoided where sound-reflecting surfaces are desired (e.g., near stage, lectern, or other source locations in rooms).
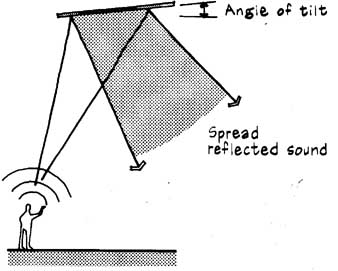
Flat Reflector
Flat, hard-surfaced building elements, if large enough and oriented properly, can effectively distribute reflected sound. The reflector shown below is tilted slightly to project sound energy toward the rear of an auditorium.
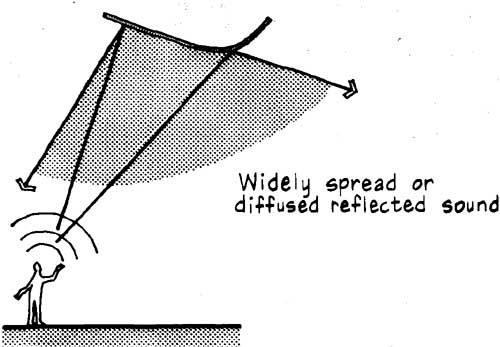
Convex Reflector
Convex, hard-surfaced building elements, if large enough, can be most effective as sound-distributing forms. The reflected sound energy from convex surfaces diverges, enhancing diffusion, which is highly desirable for music listening. In addition, reflected sound from convex surfaces is more evenly distributed across a wide range of frequencies.
RAY DIAGRAMS
Ray-diagram analyses can be used to study the effect of room shape on the distribution of sound and to identify surfaces which may produce echoes. A ray diagram is an acoustical analogy to the specular reflection of light where the angle of incidence angle i of an impinging sound wave equals the angle of reflection angle r, with angles measured from the perpendicular to the surface. That is, sound waves are reflected from surfaces in the same way a billiard ball, without spin, rebounds from a cushion. Because of this, small mirrors or silvered paper can be used with architectural drawings (or small-scale models) in a darkened room to reflect light from a point source. The patterns of reflected light demonstrate, during the design process, the effect of room shape on the distribution of sound.
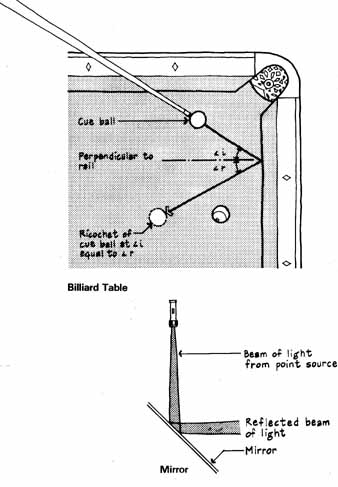
Billiard Table; Mirror
Some limitations of ray-diagram studies are as follows:
1. Sound reflects in the manner indicated by ray diagrams only when surface dimensions are large relative to the wavelength X of sound being evaluated (>4X).
2. Normally, the source of speech or music will not radiate from a fixed position. Optimum room shape therefore depends on a careful balance of the best sound distribution from several source positions to the listening area.
3. A detailed evaluation of diffusion of sound by room surfaces is not possible with ray diagrams. Therefore, scale models which allow frequency-scaled acoustical studies are often used in design, particularly in rooms where music perception is important (cf., V. 0. Knudsen, “Model Testing of Auditoriums,” Journal of the Acoustical Society of America, February 1970, pp. 401-407).
In spite of these limitations, ray diagrams can be an important design tool in establishing optimum room shape. The table below is a design guide that can be used with ray-diagram analyses to evaluate general listening conditions. The difference in length between the reflected sound path and the direct sound path at any listening position is directly related to the time difference which the ear detects, For example, if a reflected sound wave is heard 1 / 17 s or later after it was first heard as a direct sound, the reflected sound wave can be perceived as a discrete echo. A familiar example of this situation would be the echoes from cliffs in mountain regions, where reflected sounds are heard as distinct repetitions of the direct (or original) sound. The sound path difference in feet from a sound delayed by 1/17 s (about 0.06 s) can be found as follows:
Distance = velocity X time = 1130 X 0.06 = 68ft
Sound Path Difference (ft) |
Time Delay Gap (ms) |
Listening Conditions |
< 23 23 to 34 34 to 50 50 to 68 > 68 |
< 20 20 to 30 30 to 45 45 to 60 > 60 |
Excellent for speech and music Good for speech, fair for music Marginal (blurred) Unsatisfactory Poor (echo if strong enough) |
References
- L. L. Beranek and T. J. Schultz, “Some Recent Experiences in the Design and Testing of
- Concert Halls with Suspended Panel Arrays,” Acustica, vol. 15, 1965.
- V. O. Knudsen, “Architectural Acoustics,” Scientific American, November 1963,
- R. L. McKay, Notes on Architectural Acoustics, Stipes Publishing, Champaign, III., 1964.
Note: For an overview of acoustical modeling fundamentals, see R. G. Cann, “Principles of Acoustical Scale Modeling,” Sound and Video Contractor, July 1985, pp. 30-35. Small-scale models at 1:20 and 1:50 scale ratios are useful for the study of initial design alternates, while larger scale ratios of 1: 10 are best for detailed analyses of complex sound fields in concert halls.
RAY-DIAGRAM GRAPHICS
An inexpensive protractor to measure angles, a pencil, scale, and paper are all the equipment required for ray-diagram calculations. Shown below is an auditorium section with sound path differences calculated to front and middle- rear audience locations from a typical source location.
Path difference = reflected path - direct path
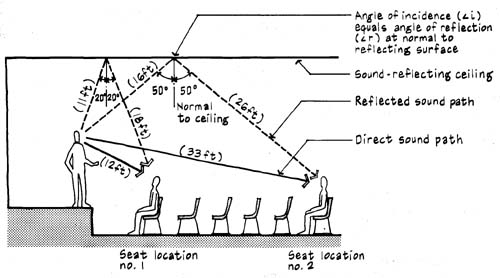
Example Ray-Diagram Measurements (Distances are shown in parentheses
on above drawing)
Front location no. 1:
Path difference = (11 + 18) - (12) = 17 ft
Excellent for speech and music because path difference is less than 23 ft. Middle location no. 2:
Path difference = (16 + 26) - (33) = 9 ft
Excellent for speech and music because path difference is less than 23 ft.
SOUND PATHS IN AUDITORIUMS
The initial-time-delay gap is the time interval between the arrival of the direct sound and the first reflected sound of sufficient loudness. It should be less than about 30 ms (path difference < 34 ft) for good listening conditions because sounds within this time interval can coalesce as one impression in a listener’s brain.
Early-arriving reflected sound energy is important for clarity and definition of music. “Early” sound is usually defined as the direct and reflected sound arriving within the first 80 ms. Clarity can be defined as the ratio of early sound energy to late or reverberant sound energy. Auditoriums with narrow shapes support direct and early-reflected sound because the initial-time-delay gaps will be short. In the design of auditoriums, ray diagrams can be used to determine initial-time-delay gaps. The initial-time-delay gap also strongly influences a listener’s perception of the size of an auditorium (called intimacy).
The listener in the auditorium shown below will hear the direct sound first and then, after the initial-time-delay gap, reflections from the walls (path 1 on the drawing), ceiling (path 2), stage enclosure (path 3), and so on. These arrival times and sound levels are indicated by the bars on the sound level vs. time graph shown below.
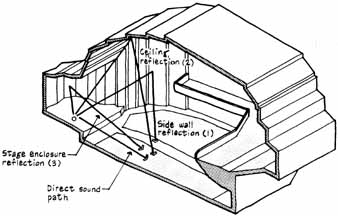
Sound Paths from Stage in Auditorium

Sound Level vs. Time Graph for Auditorium
References
- L. L. Beranek, Music, Acoustics and Architecture, Wiley, New York, 1962, p. 27. H. Kuttruff, Room Acoustics, 2d edition, Applied Science Publishers, Barking, England, 1979, pp. 180-192.
CEILINGS
The preferred ceiling shape and height depend on the intended use of the room. For example, ray-diagram analysis indicates that the hard, sound- reflecting flat ceiling shown below provides useful sound reflections which cover the entire seating area in a lecture room. Useful sound reflections for speech are those which come from the same direction as the source and are delayed by less than 30 ms. However, by carefully reorienting the ceiling, as shown by the lower illustration, the extent of useful ceiling reflections can be increased so that the middle-rear seats actually receive reflections from both ceiling planes.
The average ceiling height H in auditoriums with upholstered seats and absorptive rear walls is approximately related to the mid-frequency reverberation time T as follows:
H=20T
where H = ceiling height (ft)
T = mid-frequency reverberation time (s)
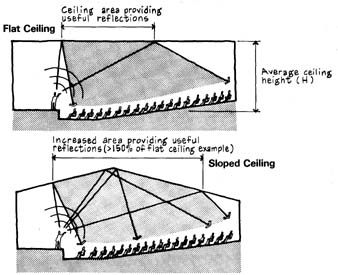
Flat and Sloped Ceiling
For concert halls, where long reverberation is a design goal, high ceilings are preferred and all walls should be sound-reflecting. In addition, ceilings that are diffusing can improve audibility of lateral sound by diminishing the strength of ceiling reflections [ A. H. Marshall, “Acoustical Determinants for the Architectural Design of Concert Halls, “ Architectural Science Review ( Australia), September 1968, p. 86].
ECHOES
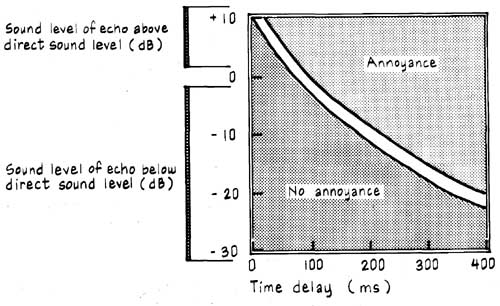
An echo is the distinct repetition of the original sound and is sufficiently loud to be clearly heard above the general reverberation and background noise in a space. To determine if echoes are present in completed spaces, sharply clap your hands or slap two books together. Listen for any strong repetition of the original clap. Note the direction and strength of any echoes and how long it takes any “fluttering” or “ringing” to drop off to inaudibility. For speech signals, echoes can be perceived when the time intervals between the direct and reflected sounds are greater than 60 ms (about 1/17s). In auditoriums, sound-reflecting flat or concave rear walls and high or vaulted ceilings are potential echo producers. The following pages show design techniques which can be used to prevent echoes. The graph below shows the amount in decibels an echo is above or below the direct speech for time delays (ms) in rooms with a reverberation time of about 1 s at mid-frequencies. An echo that falls in the shaded area on the upper right of the graph will be annoying to most listeners (> 50 percent disturbed).
References
- R. H. Bolt and P. E. Doak, “A Tentative Criterion for the Short-Term Transient Response of Auditoriums,” Journal of the Acoustical Society of America, April 1950.
- M. B. Gardner, “Historical Background of the Haas and /or Precedence Effect,” Journal of the Acoustical Society of America, June 1968.
- H. Haas, “The Influence of a Single Echo on the Audibility of Speech,” Journal of the Audio Engineering Society, March 1972 (English translation by K. P. R. Ehrenberg).
ECHO CONTROL PRINCIPLES
Potential echo-producing surfaces should be treated with efficient sound- absorbing materials ( see Section 2) or shaped as shown below. The front portion of the ceiling is lowered to reduce the delayed reflections from overhead and reoriented to provide useful reflections toward the rear of the auditorium.
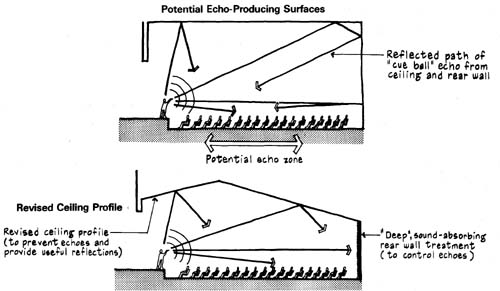
Potential Echo-Producing Surfaces; Revised Ceiling Profile
(To prevent echoes and distribute sound evenly)
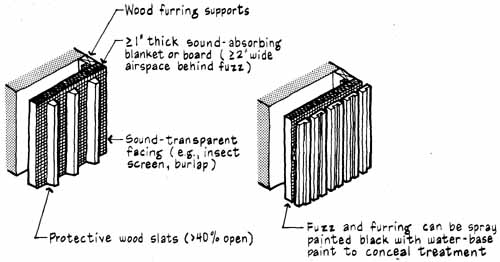
Sound-Absorbing Wall Treatments: “Deep” treatment can
be provided by either thick sound-absorbing materials or thin sound-absorbing
materials installed with an airspace behind as shown below.
REAR-WALL ECHO CONTROL TREATMENT
A flat, sound-reflecting rear wall can produce echoes or unwanted, long- delayed reflections in medium to large auditoriums. Three solutions to control “slap” echoes (i.e., sharp return of sound) from a rear wall are shown below.
Perforated facings, which are highly transparent to sound waves, can be used to conceal sound-absorbing treatment (e.g., dome at Rotunda, University of Virginia) or sound-diffusing treatment (e.g., curved surfaces over stage at Orpheum Theatre, Vancouver, B.C., Canada).
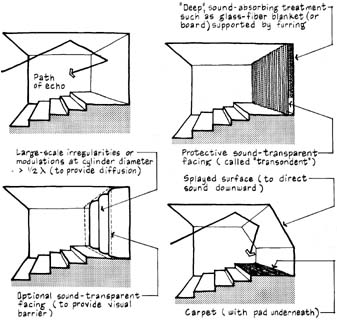
(clockwise, from top left) Echo-Producing Rear Wall (Echo at ceiling-wall
reentrant angle); Sound-Absorbing Treatment (Extend deep treatment from
seated head level); Surface Modulations or “Rumples” (Use cylinders with different
radii for optimum diffusion); Splayed Walt (To produce useful short-delayed
reflections)
Reference
- L. L. Doelle, Environmental Acoustics, McGraw-Hill, New York, 1972, pp. 58-6 1.
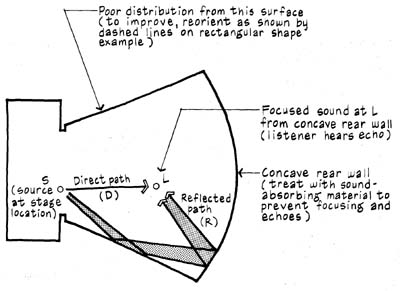
SIDE WALLS
Ray-diagram analyses are useful in the horizontal plane to study sound energy reflected from the side walls. These lateral reflections help create a favorable auditory spatial impression (or intimacy), which is essential for the satisfactory perception of music performances. Early sound reflections from side walls can add strength to the direct sound.
The initial-time-delay gap ITDG can be found by subtracting the direct sound path D from the reflected sound path R. Both paths are measured to a listener seated near the centerline of the hall, halfway between the conductor and the first balcony face (or rear wall). ITDG in milliseconds equals the path difference (R - D) in feet times 0.9. For concert halls, ITDG should be less than 20 ms.
Wide fan shapes and semicircular floor plans usually don't provide strong, early lateral reflections because the side walls will be located too far apart. Unless overhead sound reflectors can be used to help overcome the absence of lateral sound reflected from walls, music will sound distant and lack fullness of tone. The “reverse” fan shape (rooms with decreasing width to ward rear) can provide strongest lateral reflections and spatial impression for music.
Fan Shape (For lecture room)
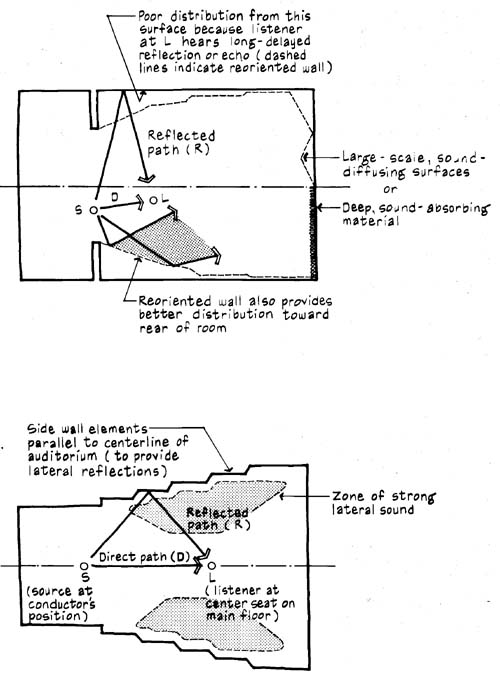
Rectangular Shape (Dashed lines indicate preferred orientations
for a lecture room); Stepped Shape (Alternate elements of side walls are
parallel to provide lateral reflections toward audience for music hall)
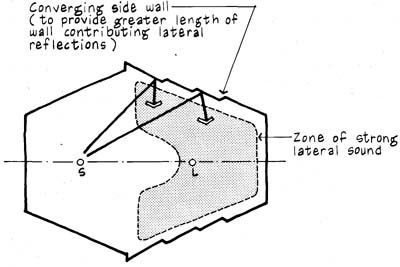
Reverse Fan Shape (Side walls at rear reflect sound toward audience
for definition of music)
References
- Y. Ando, Concert Hall Acoustics, Springer-Verlag, Berlin, 1985.
- L. Cremer and H. A. Muller, Principles and Applications of Room Acoustics, vol. 1, Applied Science Publishers, Barking, England, 1978, pp. 127-134 (English translation by T. J. Schultz).
- M. Forsyth, Auditor/a, Van Nostrand Reinhold, New York, 1987 (Contains over 40 case studies of modern concert halls and theaters).
- R. B. Newman, “Acoustics” in J. H. Callender (ed.), Time-Saver Standards for Architectural Design Data, McGraw-Hill, New York, 1974, p. 719.
PATTERNS OF REVERBERANT DECAY
Examples of sound decay in large and small rooms are shown below. A noise source (e.g., broadband noise from a loudspeaker, a bursting fully inflated balloon, or the “blast” of a blank fired from a starter’s revolver) can be used to determine the time it takes the sound to fall off, or decay, by 60 dB. The starter’s revolver has directional characteristics and a sound spectrum similar to speech.
Because the noise source is abruptly stopped or impulsive, its decay can be recorded and displayed on a graph of sound level vs. time. This graphical information can provide the designer with a greater understanding of the acoustical quality of rooms. For example, spikes on the decay curves shown below indicate echoes. Double-sloped decay curves could indicate room resonances or reverberance from coupled spaces such as large stage houses or transepts.
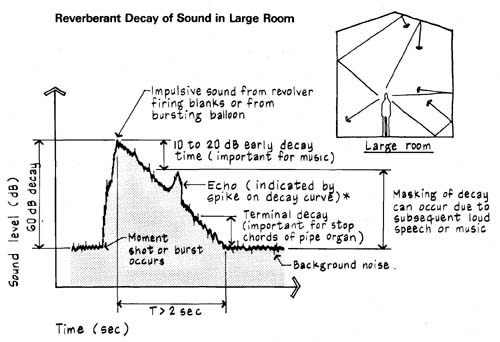
Reverberant Decay of Sound in Large Room; Echo may be due
to rear wall or other remote sound-reflecting surface.
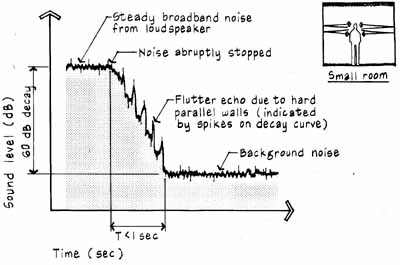
Reverberant Decay of Sound in Small Room
An articulation index Al, a measure of speech intelligibility, can be derived from laboratory analysis of electronically recorded reverberation (cf., J. P. A. Lochner and J. F. Burger, “The Influence of Reflections on Auditorium Acoustics,” Journal of Sound and Vibration, October 1964, pp. 426-454). The Al for symphonic music should be 0.4 to 0.5; for organ music, less than 0.2; and for drama, greater than 0.7 (i.e., very high intelligibility conditions).
References
- L. L. Beranek (ed.), Noise Reduction, McGraw-Hill, New York, 1960, pp. 155-159.
- H. Kuttruff, Room Acoustics, Applied Science Publishers, Barking, England, 1973, p. 191.
- M. J. R. Lamothe and J. S. Bradley, “Acoustical Characteristics of Guns as Impulse Sources,” Canadian Acoustics, April 1985, pp. 16-24.
ARTICULATION INDEX (AI)
The articulation index AI is a subjective measure of speech intelligibility. It can be calculated from the scores of a group of experienced listeners with normal hearing who write sentences, words, or syllables read to them from selected lists. The graph below relates AI to the percentage intelligibility of clearly spoken sentences or words that skilled listeners hear correctly. For example, if a speaker calls out 100 words and a listener correctly hears 90, the AI would be greater than 0.7, which indicates “very good” intelligibility conditions. Sample lists, which can be used to establish AI’s in a room, are presented in this section.
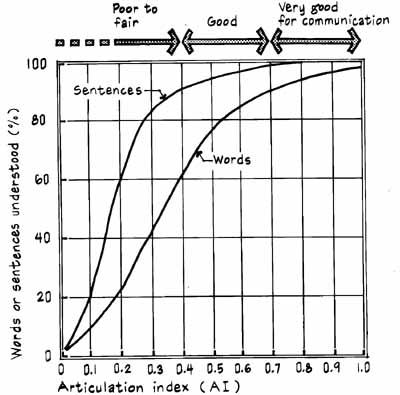
The plan view of the lecture room shown below has superimposed on it a plot of seat locations having equal AI’s in decimal percent (called AI contours). The contours shown indicate “very good” speech listening conditions (AI > 0.70) near the source located at the left end of the stage platform. Note also that the Al drops off with distance from the source. Reshaping of the ceiling and control of echoes off the rear wall could raise the Al at these remote locations.
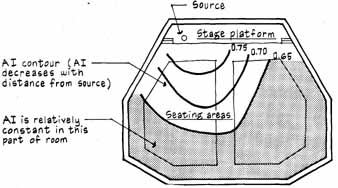
Equal AI Contours in Lecture Room
An objective evaluation test method, called the rapid speech transmission index (RASTI), has been developed to electronically measure speech intelligibility in rooms. The method uses a modulated test signal spectrum to simulate speech at 500 Hz and 2000 Hz. For details of the method, see T. Houtgast and H. J. M. Steeneken, “A Review of the MTF Concept in Room Acoustics and its Use for Estimating Speech Intelligibility in Auditoria,” Journal of the Acoustical Society of America, March 1985.
Note: For communication requirements (e.g., speech, drama, musical comedy) high AIs are essential for optimum listening conditions. Conversely, to achieve satisfactory speech privacy, a low Al is desired. An Al of 0.05 to 0.15, or 4 to 14 percent of the words heard correctly, usually indicates satisfactory speech privacy conditions (see Section 6).
Reference
- L. L. Beranek, Acoustic Measurements, Wiley, New York, 1949, pp. 625-632.
FLUTTER ECHO
Flutter echo is usually caused by the repetitive inter-reflection of sound energy between opposing parallel or concave sound-reflecting surfaces. Flutter is normally heard as a high-frequency ringing or buzzing. It can be prevented by reshaping to avoid parallel surfaces, providing deep sound-absorbing treatment, or breaking up smooth surfaces with splayed or ‘scalloped” elements. A 1:10 splay (or > 50 tilt) of one of the parallel walls will normally prevent flutter echo in small rooms.
Flutter Echoes
In small rooms flutter can be most noticeable at specific locations of noise source and listener.
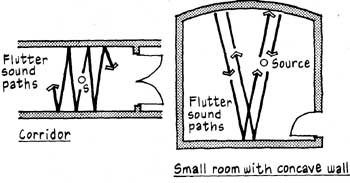
Corridor; Small room with concave wall
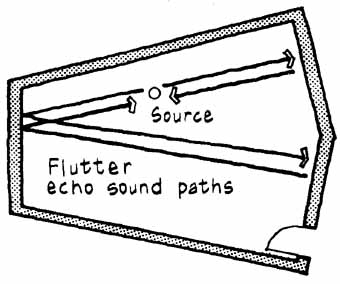
Pitched-Roof Flutter Echo
The echo phenomenon shown below (called pitched-roof flutter) can occur in rooms with nonparallel walls.
SMALL ROOMS
Audible resonance is the emphasis of sound energy at particular frequencies. It can occur in small rooms entirely finished with sound-reflecting materials when the dimensional ratios are whole numbers (e.g., cube). This phenomenon is sometimes referred to as the “bathroom tenor” effect. Consequently, preferred ratios of room dimensions may be recommended to prevent resonance (or “boominess’) by achieving even distribution of low- frequency sound energy (cf. M. Rettinger, Acoustic Design and Noise Control, Chemical Publishing, New York, 1973, pp. 376-379). However, because most rooms contain absorptive materials such as carpets, curtains, and furnishings, the provision of preferred dimensional ratios usually is unimportant.
Sound-Absorbing Surfaces Opposite Sound-Reflecting Surfaces
In the small music practice rooms shown in plan view below, the amount of sound which will reflect between hard, sound-reflecting surfaces will be minimized by installing sound-absorbing materials on adjacent walls or at two opposite corners. Effective treatment finishes can be provided by sound- absorbing panels furred out from the backup wall or heavy fabric curtains hung 100 percent full (i.e., 2 ft of curtain to 1 ft of surface width). To enhance low-frequency absorption, be sure there is a deep airspace between the sound- absorbing treatment and the backup surface.
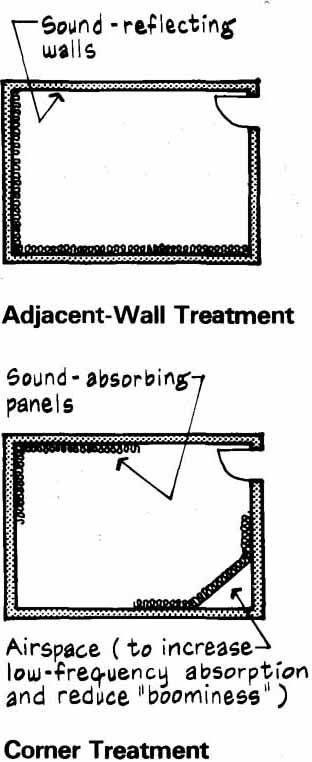
Adjacent-Wall Treatment; Corner Treatment
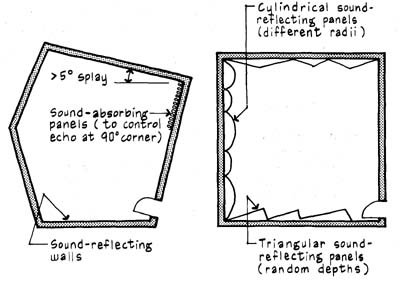
Nonparallel-Wall Surfaces (In the example below, sound-absorbing ceiling or fully carpeted floor normally will be required if walls are hard-surfaced)
|
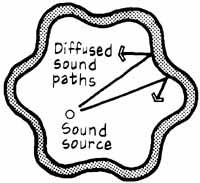
Sound-Diffusing Wall Modulations (Large-scale cylindrical, triangular, or other surface irregularities can be used to provide diffusion)
|
 |
|
References
- C. A. Andree, “The Effect of Position on the Absorption of Materials for the Case of a Cubical Room,” Journal of the Acoustical Society of America, April 1932.
- M. R. Schroeder, “Toward Better Acoustics for Concert Halls,” Physics Today, October 1980.
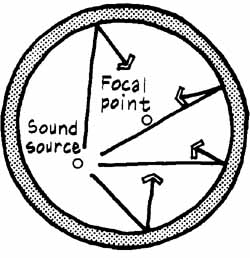
CONCAVE SURFACES
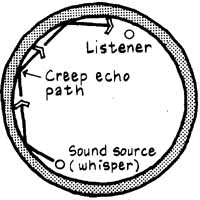
Concave wall and ceiling surfaces usually require treatment to prevent annoying sound reflections which reduce intelligibility of direct sound. Concave shapes (circle, ellipse, parabola) cause reflected sound to converge at a focal point. For example, sound energy may be concentrated in certain areas (called focusing) or reflected along smooth concave surfaces (called creep echo, or the “whispering gallery effect” because low voice levels can be heard at considerable distances away).
Shown below are problem situations and corresponding corrective measures. Note that focusing can be more noticeable for low-frequency sound energy because most finish materials are less absorptive at low frequencies.
Problem |
Solution |
Focused sound |
Surface undulations: Large-scale, random-sized surface undulations can provide diffusion to minimize focusing of reflected sound energy (e.g., convex brick surfaces at M.I.T. Chapel, Cambridge, Mass., Eero Saarinen, architect). |
 |
 |
Creep |
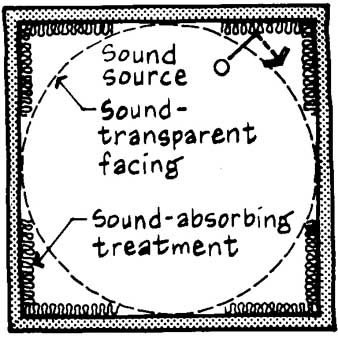
Sound-absorbing treatment Acoustically transparent material (e.g., spaced wood slats or open metal grille) conceals actual enclosure, which can be treated with deep sound-absorbing material to reduce reflected sound energy and creep echoes. |
 |
 |
An example of the whispering gallery effect occurs in the Union Terminal Building, Cincinnati, Ohio (see sketch below). Sound energy is reflected along the domed ceiling surface allowing persons at opposite ends of the rotunda (> 180 ft apart) to easily converse at whisper voice levels; however, persons only a few feet away from the speakers can't hear the conversation. Other examples where similar effects occur include the dome of St. Paul’s Cathedral, London, England, and the old Senate Chamber at the U.S. Capitol, Washington, D.C.
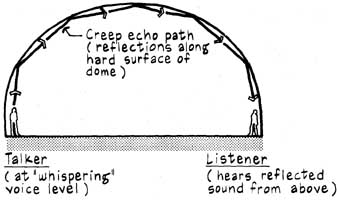
Creep Echo from Dome
Note: Domed planetariums can be designed to avoid focusing by using a sound- transparent liner on which the sky images are projected. The plenum above the perforated liner can be treated with either deep sound absorption or sound-diffusing elements.
Shown below are examples of poor distribution of sound in domed auditoriums. In the auditorium shown at the left, the extent of seating affected by focusing will be far greater than indicated because source locations on the stage will vary.
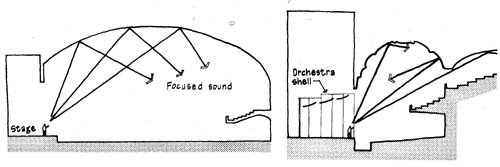
Auditorium (Focused reflections from concave-shaped ceiling);
Motion Picture Theater (Useless reflections from dome)
SOUND REFLECTORS
An effective sound reflector has a hard surface, such as thick plaster, double-layered gypsum board, sealed wood, or acrylic plastic, and is significantly larger than the wavelength of sound it's designed to reflect. For ex ample, at a frequency of 500 Hz, the wavelength of sound is about 2 ft. Consequently, an 8-ft-diameter panel (i.e., dimension about 4 times the wavelength) should be used to reflect sound energy greater than 500 Hz. However, sound energy less than 500 Hz can bend around the panel, enhancing reverberance at low frequencies.
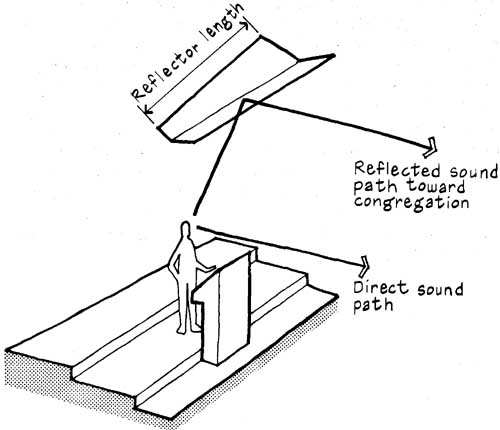
The sound-reflecting pulpit canopy shown below can provide useful reinforcement of the direct sound as well as prevent long-delayed reflections and potential echo conditions from the high ceiling. In the church example shown below, the organ and console are located within the sanctuary, not in a gallery or other deep recess. For guidelines on space requirements and preferred placement of pipe organs, see H. Klotz, The Organ Handbook, Concordia Publishing, St. Louis, Mo., 1969, pp. 102-116.
Section View of Church
Note: In churches, an interior of thin wood paneling applied to furring can be an unintended, effective vibrating panel sound absorber (see Section 2). The absorption by the panel action can reduce low-frequency reverberation considerably, giving an unpleasant “shrilly” characteristic to music. If wood is desired, vibrating-panel effects can be avoided by adhering the wood directly to a rigid backup wall or by using closely spaced furring supports (< 1 ft apart).
Pulpit Canopy Details
References
- W. J. Cavanaugh, “Acoustics in Church Design,” Liturgical Arts, May 1959.
- B. G. Watters et al., “Reflectivity of Panel Arrays in Concert Halls,” Sound, May-June 1963.
CHECKLIST FOR WORSHIP SPACES
In spaces for worship there is the need for acoustical properties to support both intelligible speech and sufficient reverberance for music. It may be possible to satisfy both needs by providing a long reverberation time for music (about 2 s at mid-frequencies) and an electronic, sound-reinforcing system for speech articulation. In some churches, the most important part of the service may be either speech or music, which will determine the optimum reverberance. For example, if organ music is the most important, a long reverberation time (>2 s) will be required for enhancement of tone and blending. (It should be noted, however, that many organ builders seem to emphasize reverberance to the exclusion of other equally important acoustical properties for music, such as even distribution of sound energy, sufficient lateral reflections, and tonal balance.) Reverberance can also help the congregation avoid the feeling of “singing alone” during hymns or sung responses or “speaking alone” during prayer or responsive readings. The volume, finishes, and shape of a worship space will affect the articulation of speech and quality of music.
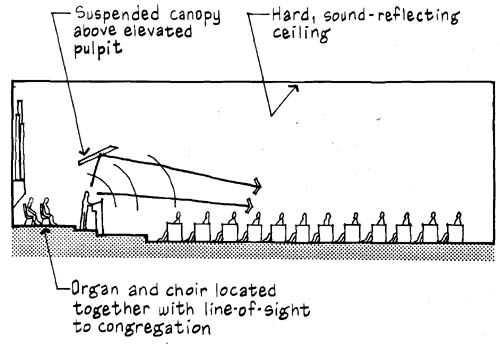
Flat Ceiling: Elevated pulpit, sloped soffit
Listed below are guidelines to help designers achieve conditions for good hearing in worship spaces.
1. Music is best supported in churches with relatively narrow plans (providing short initial-time-delay gaps) and high room volume. Wide plans, which wrap the congregational seating around the pulpit/choir area, don't provide sufficient lateral sound. Its absence contributes to an impression of distant sound, lacking fullness of tone. For planning purposes, volume per seat ratio should be 180 to 300 ft^3 per person for churches where speech is the most important part of the service; 200 to 400 ft^3 per person for churches where music is the most important part. Avoid deeply recessed seating areas which shield listeners from reverberant sound.
2. Pulpit or lectern should be elevated and located close to the walls. In spaces with especially high ceilings, use a pulpit canopy (with upward tilt) to enhance the direct sound and to prevent long-delayed reflections from the ceiling.
3. Avoid domes, barrel vaults, and other concave shapes which focus sound energy. To mitigate focusing effects, concave ceilings can be ‘flattened” in the center or treated with sound-diffusing elements such as unequal facets. If the focal point is far above the seating (> 1/2 floor-to-ceiling height), reflected sound will be weaker than it would be if the ceiling were flat.
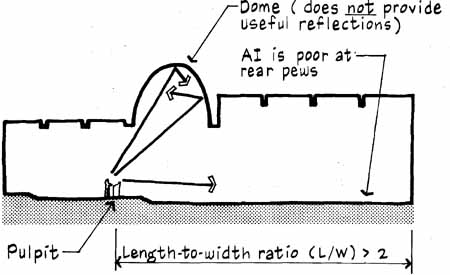
Domed Ceiling
4. Lay out seating to achieve good sight lines and minimum pew-to-pulpit distances to enhance speech perception. Pew cushions and carpeting used only in the seating areas can provide constant sound absorption, so reverberance does not vary greatly with the number of occupants present. Where carpet is used primarily to control footfall impact and shuffling noises, use carpet having low pile weight and low pile height, installed without a pad underneath. Loop pile will be more sound reflective than cut pile of the same weight. Do not use carpet in the chancel or choir areas, or in pew areas if active participation of congregation is desired.
5. Wall and ceiling surfaces generally should be sound-reflecting (concrete, thick plaster, or double layer of thick gypsum board or thick wood supported by closely spaced studs) with large-scale irregularities, splays, or bumps such as deep coffers to contribute to desired reverberance, diffusion, and lateral reflections (to surround listeners with sound). In general, avoid materials which selectively absorb sound energy at low frequencies (e.g., single layer of thin wood or gypsum board). For example, adding a second layer of 5/8-in-thick gypsum board to 5/8-in-thick gypsum board supported by 1 x 3 wood furring with fibrous insulation fill between furring can reduce absorption at 125 Hz by one-half (absorption coefficient reduced from 0.55 to 0.28).
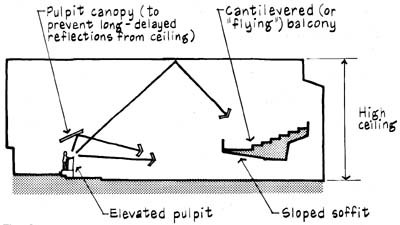
6. Under-balconies may need special treatment such as sloped soffits and depths restricted to less than the opening heights. Shape balcony faces and rear walls with large splays or convex elements to avoid long-delayed reflections and echoes (or carefully treat with limited amount of sound-absorbing finishes).
7. Locate choir, organ, and organ console close together (<40 ft apart) to achieve balance between organ tone and choral music. Surround both with sound-reflecting surfaces shaped to blend and project sound toward the congregation. Ceiling height above the choir should not be too low (< 20 ft). The choir must clearly hear the organ for proper support and rhythmic guidance. If the organist is also the choir director, orient the organ console so the choir can see the hands of the organist. Avoid using carpet and pew cushions in the choir areas because the absence of sound-absorbing materials at these critical locations have an overwhelming influence on loudness and pattern of early sound energy distribution. Choir areas should be somewhat elevated with direct line of sight to the congregation (not located in deep recesses).
8. Organ pipes should be located in the open where they will be acoustically connected or coupled to the sanctuary (not in deep recess or transept) with direct line of sight to the congregation. Provide space (> 1.5-ft clearance) at sides and rear of organ to allow servicing. Organs can have freestanding pipes or pipes in a wood panel casework (to blend sound and help develop harmonics). All ranks of the organ must be clearly heard. If the organ is to be visually hidden, place pipes in a shallow recess (> 125 ft for each stop or set of pipes) finished in hard, sound-reflecting materials. Use sound- transparent grille with framing members less than 2 in wide and deep, with spacing between to provide more than 75 percent unobstructed open area.
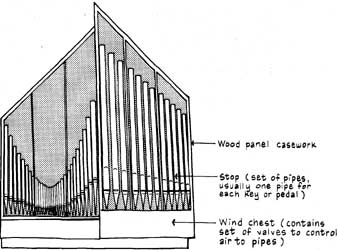
Chest of Organ Pipes
9. To prevent interference with meditation, prayer, and appreciation of worship services, background noise levels from the mechanical system should not exceed noise criterion NC-25 for large spaces, or NC-30 for smaller spaces. En closing constructions must reduce intruding noise to levels below these criteria (see Section 4). In small sanctuaries, be careful to control the noise produced by air outlets and return grilles because occupants will be seated closer to these terminal devices than they would be in large spaces. Isolate noise and vibrations of the organ blower (see Section 5).
10. To achieve intelligible speech in reverberant spaces, use the highly directional, central electronic sound-reinforcing system to concentrate amplified speech over the congregational seating area and allow the sound to come from the direction of the pulpit location. As an alternative to the preferred central system, use a distributed system such as a dense array of cone loudspeakers located overhead or a pew-back system with signal-delay features (see Section 7). In churches with flexible seating, overhead distributed systems can be designed to switch off loudspeakers located above the unoccupied areas (see illustration below).
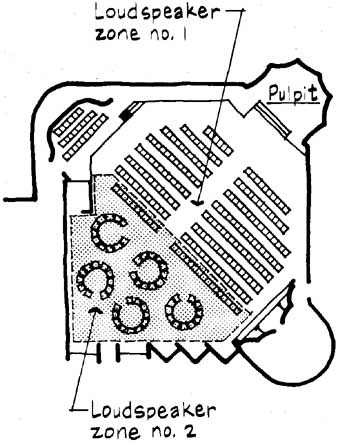
Zones for Overhead Distributed System
Note: To respond to the special needs of hearing-impaired persons, consider installing an assistive listening system (e.g., magnetic induction loop, FM radio, infrared) which allows the individual listener to control the sound level through a headset or connection to personal hearing aid. For a comprehensive review of these basic systems, along with a directory of manufacturers, see A. Brook, “Sound Systems for the Hearing Impaired,” Theatre Design and Technology, Summer 1983, pp. 22-25.
References
- D. Fitzroy, “The Sounds of St. Mary’s,” Journal of the Acoustical Society of America, August 1973.
- D. Ingram et al., “Acoustics in Worship Spaces,” American Guild of Organists (pamphlet available from AGO, 815 Second Ave., New York, NY 10017).
- B. Y. Kinzey and H. M. Sharp, Environmental Technologies in Architecture, Prentice-Hall, Englewood Cliffs, N.J., 1963, pp. 367-372.
- H. G. Klais, Reflections on the Organ Stoplist, Praestant Press, Delaware, Ohio, 1975, p. 124. (English translation by H. D. Blanchard. Contains formulas and tables which can be used as guide to allocate space for pipe organs.)
- D. L. Klepper, “Church Acoustics,” Sound and Video Contractor, January 1985.
- D. L. Klepper, “Sound Systems in Reverberant Rooms for Worship,” Journal of the Audio Engineering Society, August 1970.
- D. Lubman and E. A. Wetherill (eds.), Acoustics of Worship Spaces, Acoustical Society of America, New York, 1985. (Contains technical data for numerous case studies of chapels, churches, temples, and synagogues.)
- A. R. Rienstra, “Acoustical and Organ Design for Church Auditoriums,” Journal of the Acoustical Society of America, July 1957, p. 787.
Next: Room Acoustics (cont.)