AMAZON multi-meters discounts AMAZON oscilloscope discounts
1. INTRODUCTION
The Cathode Ray Oscilloscope (CRO) is a very useful and versatile laboratory instrument used for display, measurement and analysis of waveform and other phenomena in electrical and electronic circuits. CROs are, in fact, very fast X-Y plotters, displaying an input signal versus another signal or versus time. The 'stylus' of this 'plotter' is a luminous spot which moves over the display area in response to an input voltage. The luminous spot is produced by a beam of electrons striking a fluorescent screen. The extremely low inertia effects associated with a beam of electrons enables such a beam to be used following the changes in instantaneous values of rapidly varying voltages.
The normal form of a CRO uses a horizontal input voltage which is an internally generated ramp voltage called 'time base'. The horizontal voltage moves the luminous spot periodically in a horizontal direction from left to right over the display area or screen.
The vertical input to the CRO is the voltage under investigation. The vertical input voltage moves the luminous spot up and down in accordance with the instantaneous value of the voltage. The luminous spot thus traces the waveform of the input voltage with respect to time. When the input voltage repeats itself at a fast rate, the display on the screen appears stationary on the screen. The CRO thus provides a means of visualizing time-varying voltages. As such, the CRO has become a universal tool in all kinds of electrical and electronic investigation.
2. BLOCK DIAGRAM OF A CATHODE RAY TUBE (CRT)
The main part of the CRO is Cathode Ray Tube (CRT). It generates the electron beam, accelerates the beam to a high velocity, deflects the beam to create the image and contains a phosphor screen where the electron beam eventually becomes visible. The phosphor screen is coated with 'aquadag' to collect the secondary emitted electrons. For accomplishing these tasks, various electrical signals and voltages are required, which are provided by the power supply circuit of the oscilloscope. Low voltage supply is required for the heater of the electron gun for generation of electron beam and high voltage, of the order of few thousand volts, is required for cathode ray tube to accelerate the beam.
Normal voltage supply, say a few hundred volts, is required for other control circuits of the oscilloscope.
Horizontal and vertical deflecting plates are fitted between the electron gun and screen to deflect the beam according to the input signal. The electron beam strikes the screen and creates a visible spot. This spot is deflected on the screen in the horizontal direction (X- axis) with constant time dependent rate. This is accomplished by a time base circuit provided in the oscilloscope. The signal to be viewed is supplied to the vertical deflection plates through the vertical amplifier, which raises the potential of the input signal to a level that will provide usable deflection of the electron beam. Now electron beam deflects in two directions, horizontal on X-axis and vertical on Y-axis. A triggering circuit is provided for synchronizing two types of deflections so that horizontal deflection starts at the same point of the input vertical signal each time it sweeps. A basic block diagram of a general-purpose oscilloscope is shown in FIG. 1(a) and a schematic of internal parts of a CRT is shown in FIG. 1(b).
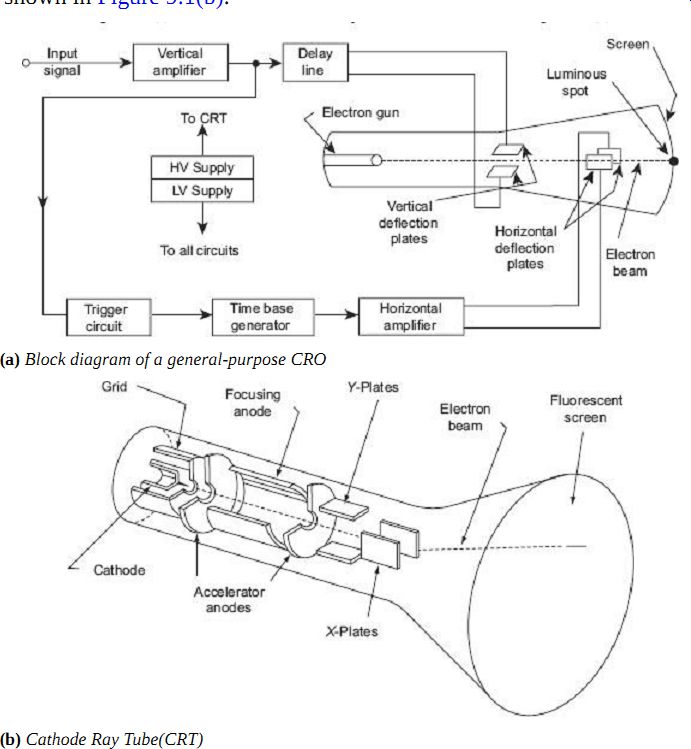
FIG. 1 (a) Block diagram of a general-purpose CRO FIG. 1 (b) Cathode
Ray Tube(CRT)
3. ELECTROSTATIC DEFLECTION
FIG. 2 shows a general arrangement for electrostatic deflection. There are two parallel plates with a potential applied between. These plates produce a uniform electrostatic filed in the Y direction. Thus any electron entering the field will experience a force in the Y direction and will be accelerate in that direction. There is no force either in X direction or Z direction and hence there will be no acceleration of electrons in these directions.
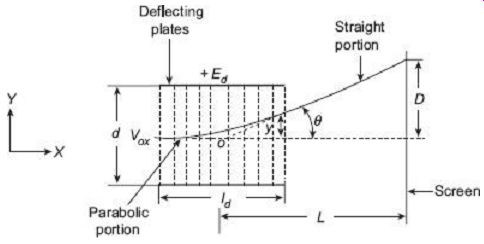
FIG. 2 Electrostatic deflection
Let, Ea = voltage of pre-accelerating anode; (volt) e = charge of an electron; (Coulomb) m = mass of electron; (kg) ? = deflection angle of the electron beam vox = velocity of electron when entering the field of deflecting plates; (m/s) Ed = potential difference between deflecting plates; (volt) d = distance between deflecting plates; (m) ld = length of deflecting plates; (m) L = distance between screen and the centre of the deflecting plates; (m) y = displacement of the electron beam from the horizontal axis at time t and D = deflection of the electron beam on the screen in Y direction; (m) The loss of potential energy (PE ) when the electron moves from cathode to accelerating anode;
The gain in kinetic energy (KE ) by an electron This is the velocity of the electron in the X direction when it enters the deflecting plates.
The velocity in the X direction remains same throughout the passage of electrons through the deflecting plates as there is no force acting in the direction.
Suppose ay is the acceleration of the electron in the Y direction, therefore,
As there is no initial velocity in the Y direction [Eq. (9.8)], the displacement y at any instant t in the Y direction is As the velocity in the X direction is constant, the displacement in X direction is given by Substituting the above value of t in Eq. (9.8), we have This is the equation of a parabola.
Putting x = ld in Eq. (9.12), we get the value of tan ?.
After leaving the deflection plates, the electrons travel in a straight line. The straight line of travel of electron is tangent to the parabola at x = ld and this tangent intersects the X axis at point O'. The location of this point is given by The apparent origin is thus the centre of the deflecting plates, the deflection D on the screen is given by From Eq. (9.16) we conclude the following:
For a given accelerating voltage Ea, and for particular dimensions of CRT, the deflection of the electron beam is directly proportional to the deflecting voltage. This means that the CRT may be used as a linear indicating device.
The discussions above assume that Ed is a fixed dc voltage. The deflection voltage is usually a time varying quantity and the image on the screen thus follows the variation of the deflections voltage in a linear manner.
The deflection is independent of the (e/m) ratio. In a cathode ray tube, in addition to the electrons many types of negative ions such as oxygen, carbon, chlorine etc are present.
With electrostatic deflection system, because deflection is independent of e/m, the ions travel with the electrons and are not concentrated at one point. Hence cathode ray tube with electrostatic deflection system does not produce an ion burn.
The deflection sensitivity of a CRT is defined as the deflection of the screen per unit deflection voltage.
The deflection factor of a CRT is defined as the reciprocal of sensitivity It is clear from Eq. (9.17), that the sensitivity can be increased by decreasing the value of accelerating voltage Ea. but this has a disadvantage as the luminosity of the spot is decreased with decrease in Ea. On the other hand a high value of Ea, produced a highly accelerated beam and thus produces a bright spot. However, a high accelerating voltage (Ea) requires a high deflection potential (Ed) for a given deflection. Also, highly accelerated beam is more difficult to deflect and is sometimes called hard beam.
4. TIME BASE GENERATOR
Generally, oscilloscopes are used to display a waveform that varies as a function of time. For the waveform to be accurately reproduced, the beam must have a constant horizontal velocity. Since the beam velocity is a function of the deflecting voltage, the deflecting voltage must increase linearly with time. A voltage with this characteristic is called a ramp voltage. If the voltage decreases rapidly to zero with the waveform repeatedly reproduced, as shown in FIG. 3, the pattern is generally called a sawtooth waveform.
During the sweep time, Ts, the beam moves from left to right across the CRT screen.
The beam is deflected to the right by the increasing amplitude of the ramp voltage and the fact that the positive voltage attracts the negative electrons. During the retrace time or flyback time, Tr, the beam returns quickly to the left side of the screen. This action would cause a retrace line to be printed on the CRT screen. To overcome this problem the control grid is generally 'gated off', which blanks out the beam during retrace time and prevents an undesirable retrace pattern from appearing on the screen.
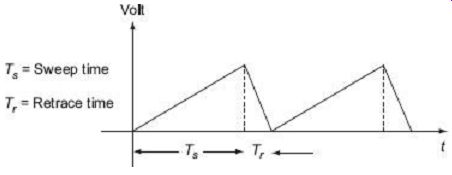
FIG. 3 Typical sawtooth waveform applied to the horizontal deflection
plates
In low-cost oscilloscopes the time base is said to be free running, although the time base oscillator may, in fact, be synchronized to the vertical amplifier signal. Unless the time base is so synchronous, the waveform marches across the screen and remains unstable.
Synchronization means that the time base signal sweeps across the screen in a time that is equal to an integer number of vertical waveform periods. The vertical waveform will then appear locked on the CRT screen.
The vertical sector consists of a wideband preamplifier and power amplifier combination that drivers the CRT vertical deflection plates. The vertical amplifier has a high gain, so large signals must be passed through an attenuator or, in low cost oscilloscopes, a vertical gain controller.
5. VERTICAL INPUT AND SWEEP GENERATOR SIGNAL SYNCHRONIZATION
Several waveforms that are needed to be observed with the help of CRO will be changing at a rate much faster than the human eye can sense, perhaps many million times per second. To observe such rapid changes, the beam must retrace the same pattern repeatedly.
If the pattern is retraced in such a manner that the pattern always occupies the same location on the screen, it will appear as stationary. The beam will retrace the same pattern at a rapid rate. If the vertical input signal and the sweep generator signal are synchronized, which means that the frequency of vertical input signal must be equal to or an exact multiple of the sweep generator signal frequency, as shown in FIG. 4. If the vertical input frequency is not exactly equal to or an exact multiple of the sawtooth frequency, the waveform will not be synchronized and the display moves across the screen. If the pattern moves towards the right, the frequency of the sawtooth waveform is too high. Movement of the pattern towards the left indicates that the frequency of the sawtooth is too low.
The vertical input signal and the sawtooth generator signal can be synchronized in two different ways:
1. Free running sweep
2. Triggered sweep
5.1 Free Running Sweep
In low-cost oscilloscopes, the time base is said to be free running. In these oscilloscopes, the sweep generator is continuously charging and discharging a capacitor. One ramp voltage is followed immediately by another; hence, the sawtooth pattern appears. A sweep generator working in this manner is said to be 'free running'. In order to present a stationary display on the CRT screen, the sweep generator signal must be forced to run in synchronization with the vertical input signal. In basic or low-cost oscilloscopes this is accomplished by carefully adjusting the sweep frequency to a value very close to the exact frequency of the vertical input signal or a sub-multiple of this frequency. When both signals are at same frequency, an internal synchronizing pulse will lock the sweep generator into the vertical input signal. This method of synchronization has some serious limitations when an attempt is made to observe low amplitude signals, because it is very difficult to observe that a very low amplitude signal is stationary or movable in the CRT screen. However, the most serious limitation is probably the inability of the instrument to maintain synchronization when the amplitude or frequency of the vertical signal is not constant, such as variable frequency audio signal or voice.
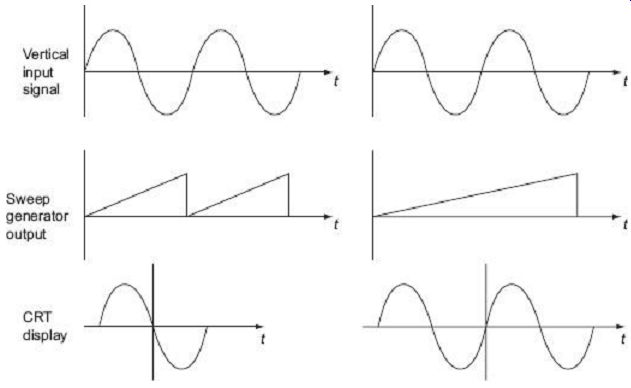
FIG. 4 Synchronized waveforms and CRT display
5.2 Triggered Sweep
In free running sweep oscillators, it is not possible to observe the signals of variable frequency. The limitation is overcome by incorporating a trigger circuit into the oscilloscope as shown in FIG. 5. The trigger circuit may receive an input from one of three sources depending on the setting of the trigger selecting switch. The input signal may come from an external source when the trigger selector switch is set to EXT, from a low amplitude ac voltage at line frequency when the switch is set to line, or from the vertical amplifier when the switch is set to INT. When set for Internal Triggering (INT), the trigger circuit receives its input from the vertical amplifier. When the vertical input signal that is being amplified by the vertical amplifier matches a certain level, the trigger circuit provides a pulse to the sweep generator, thereby ensuring that the sweep generator output is synchronized with the signal that triggers it.
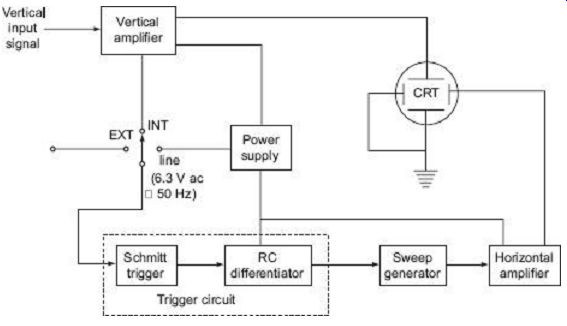
FIG. 5 Block diagram of an oscilloscope with triggered sweep.
Schmitt trigger or a voltage level detector circuit is frequently used in the 'trigger circuit' block of FIG. 5. Basically, the Schmitt trigger compares an input voltage, in this case from the vertical amplifier, with a pre-set voltage.
6. MEASUREMENT OF ELECTRICAL QUANTITIES WITH CRO
The CRO is a very versatile instrument in laboratory for measurement of voltage, current, frequency and phase angle of any electrical quantity. But before we go ahead with the discussion on measurement of electrical quantities with a CRO, we should understand some basic oscilloscope patterns.
Basic Oscilloscope Patterns
Assume that a sinusoidal voltage is applied to the horizontal deflecting plates without any voltage signal to the vertical deflecting plates, as shown in FIG. 6. One horizontal line will appear on the screen of the CRO. This line would be in the central position on the screen vertically.
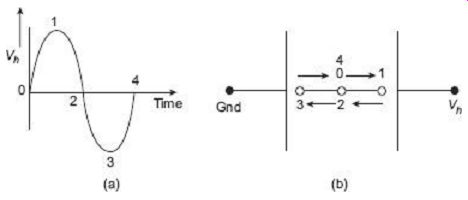
FIG. 6 Deflection for a sinusoidal voltage applied to the horizontal
deflection plates If a sinusoidal voltage signal is applied to the vertical
deflecting plates without applying any voltage signal to the horizontal deflecting
plates then we get a vertical line on the screen of CRO, as shown in FIG. 7. This line would be in the central position on the screen horizontally.
Now we would discuss what happens when both vertical and horizontal deflection plates are supplied with sinusoidal voltage signals simultaneously. Let us consider when two sinusoidal signals equal in magnitude and frequency and in phase with each other are applied to both of the horizontal and vertical deflection plates, as shown in FIG. 8.
Here we get a straight line inclined at 45° to the positive X-axis.
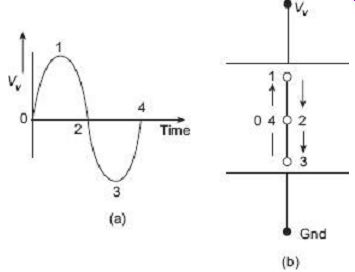
FIG. 7 Deflection for a sinusoidal voltage applied to the vertical deflecting
plates
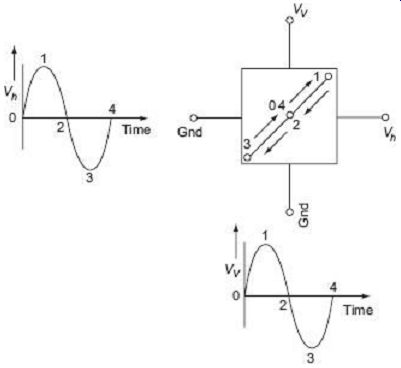
FIG. 8 Deflection for sinusoidal voltage signals in phase and equal
in magnitude and frequency, applied to horizontal and vertical deflection
plates Now let us consider a case when two sinusoidal voltage signals applied
to the horizontal and vertical deflection plates are of equal magnitude and
equal frequency but opposite in phase, as shown in FIG. 9. We get a straight
line inclined at 135° to the positive X axis.
In the last case, if the two sinusoidal voltage signals, 90° out of phase and of equal magnitude and equal frequency, are applied to the horizontal and vertical deflection plates, a circle would appear on the screen as shown in FIG. 10.
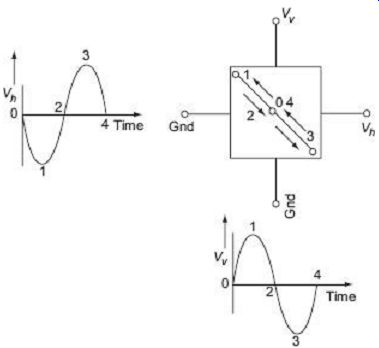
FIG. 9 Deflection for sinusoidal voltage signals equal in magnitude
and frequency but opposite in phase, applied to horizontal and vertical deflection
plates
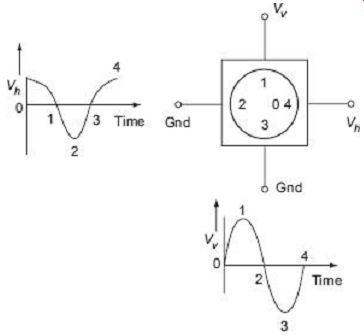
FIG. 10 Deflection for sinusoidal voltage signals equal in magnitude
and frequency but 90° out of phase, applied to horizontal and vertical deflection
plates
7. MEASUREMENT OF VOLTAGE AND CURRENT
The expression for electrostatic deflection is , where L = distance between screen and the centre of the deflecting plates Id = length of deflecting plates Ed = potential between deflecting plates d = distance between deflecting plates Ea = voltage of pre accelerating anode So deflection is proportional to the deflecting-plate voltage. Thus, the cathode ray tube will measure voltage. It is used to calibrate the tube under the given operating conditions by observing the deflection produced by a known voltage. Direct voltage may be obtained from the static deflection of the spot, alternating voltage from the length of the line produced when the voltage is applied to Y-plates while no voltage is applied to X-plates.
The length of the line corresponds to the peak to peak voltage. While dealing with sinusoidal voltages, the rms value is given by dividing the peak to peak voltage by For measurement of current, the current under measurement is passed through a known non inductive resistance and the voltage drop across it is measured by CRO, as mentioned above. The current can be determined simply by dividing the voltage drop measured by the value of non inductive resistance. When the current to be measured is of very small magnitude, the voltage drop across noninductive resistance (small value) is usually amplified by a calibrated amplifier.
8. MEASUREMENT OF FREQUENCY
It is interesting to consider the characteristics of patterns that appear on the screen of a CRO when sinusoidal voltages are simultaneously applied to the horizontal and vertical plates. These patterns are called Lissajous patterns.
Lissajous patterns may be used for accurate measurement of frequency. The signal, whose frequency is to be measured, is applied to the Y-plates. An accurately calibrated standard variable frequency source is used to supply voltage to the X-plates, with the internal sweep generator switched off. The standard frequency is adjusted until the pattern appears as a circle or an ellipse, indicating that both signals are of the same frequency.
Where it is not possible to adjust the standard signal frequency to the exact frequency of the unknown signal, the standard is adjusted to a multiple or sub-multiple of the frequency of the unknown source so that the pattern appears stationary.
Let us consider an example. Suppose sine waves are applied to X and Y plates as shown in FIG. 11. Let the frequency of wave applied to Y plates is twice that of the voltage applied to the X plates. This means that the CRT spot travels two complete cycles in the vertical direction against one of the horizontal direction.
The two waves start at the same instant. A Lissajous pattern may be constructed in the usual way and a 8 shaped pattern with two loops is obtained. If the two waves do not start at the same instant we get different pattern for the same frequency ratio. The Lissajous pattern for the other frequency ratios can be similarly drawn. Some of these patterns are shown in FIG. 12.
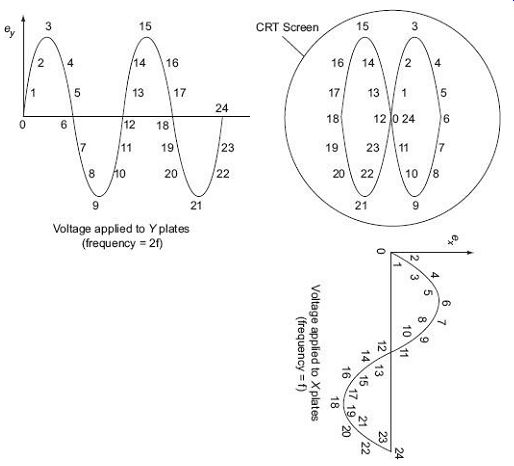
FIG. 11 Lissajous pattern with frequency ratio 2:1
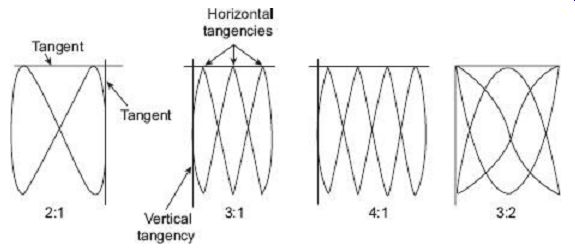
FIG. 12 Lissajous patterns with different frequency ratio
It can be shown that for all the above cases, the ratios of the two frequencies is where
fy = Frequency of signal applied to Y plates
fx = Frequency of signal applied to X plates
The above rule, however, does not hold for the Lissajous patterns with free ends as shown in FIG. 13. The simple rule mentioned above needs the following modifications:
Two lines are drawn, one horizontal and the other vertical so that they do not pass through any intersections of different parts of the Lissajous curve. The number of intersections of the horizontal and the vertical lines with the Lissajous curve are individually counted. The frequency ratio is given by
The applications of these rules to FIG. 13(a) gives a frequency ratio The modified rule is applicable in all cases whether the Lissajous pattern is open or closed.
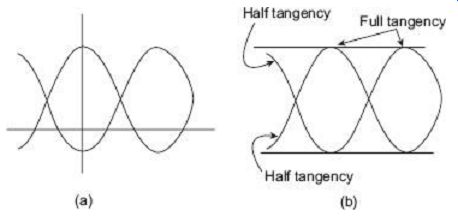
FIG. 13 Lissajous pattern with half tangencies The ratio of frequencies
when open ended Lissajous patterns are obtained can also be found by treating
the open ends as half tangencies as shown in FIG. 13(b).
There are some restrictions on the frequencies which can be applied to the deflection plates. One obviously, is that the CRO must have the bandwidth required for these frequencies. The other restriction is that the ratio of the two frequencies should not be such as to make the pattern too complicated otherwise determination of frequency would become difficult. As a rule, ratios as high as 10:1 and as low as 10:9 can be determined comfortably.
9. MEASUREMENT OF PHASE DIFFERENCE
When two sinusoidal voltages of equal frequency which are in phase with each other are applied to the horizontal and vertical deflecting plates, the pattern appearing on the screen is a straight line as is clear from FIG. 14.
Thus when two equal voltages of equal frequency but with 90° phase displacement are applied to a CRO, the trace on the screen is a circle. This is shown in FIG. 15.
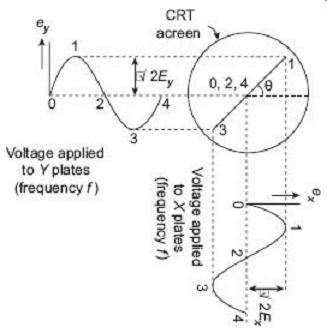
FIG. 14 Lissajous pattern with equal frequency voltages and zero phase
shift.
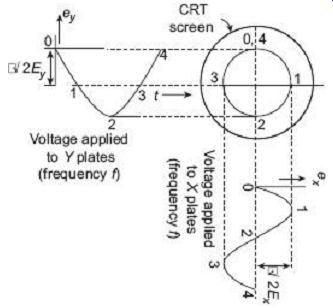
FIG. 15 Lissajous pattern with equal voltages and a phase shift
of 90° When two equal voltages of equal frequency but with a phase shift
? (not equal to 0 or 90°) are applied to a CRO, we obtain an ellipse
as shown in FIG. 16. An ellipse is also obtained when unequal voltages of
same frequency are applied to the CRO.
A number of conclusions can be drawn from the above discussions. When two sinusoidal voltages of same frequency are applied, a straight line results when the two voltages are equal and are either in phase with each other or 180° out of phase with each other. The angle formed with the horizontal is 45° when the magnitudes of voltages are equal. An increase in the vertical deflecting voltage causes the line to have an angle greater than 45° with the horizontal.
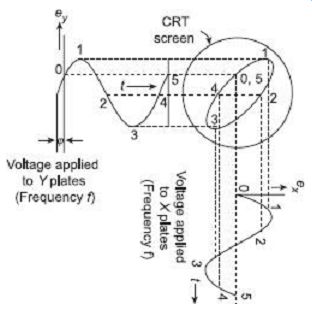
FIG. 16 Lissajous pattern with two equal voltages of same frequency
and phase shift of ? Two sinusoidal waveforms of the same frequency produce
a Lissajous pattern which may be a straight line, a circle or an ellipse
depending upon the phase and the magnitude of the voltages.
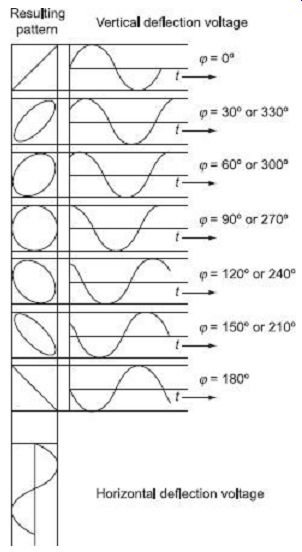
FIG. 17 Lissajous pattern with different phase shift A circle can be
formed only when the magnitude of the two signals are equal and the phase
difference between them is either 90° or 270°. However, if the two voltages
are out of phase an ellipse is formed.
It is clear from FIG. 17 that for equal voltages of same frequency, progressive variation of phase voltage causes the pattern to vary from a straight diagonal line to ellipse of different eccentricities and then to a circle, after that through another series of ellipses and finally a diagonal straight line again.
Regardless of the amplitudes of the applied voltages the ellipse provides a simple means of finding phase difference between two voltages. Referring to FIG. 18, the sine of the phase angle between the voltages is given by For convenience, the gains of the vertical and horizontal amplifiers are adjusted so the ellipse fits exactly into a square marked by the lines of the graticule.
If the major axis of the ellipse lies in the first and third quadrants (i.e., positive slope) as in FIG. 18 (a), the phase angle is either between 0° to 90° or between 270° to 360°.
When the major axis of ellipse lies in second and fourth quadrants, i.e., when its slope is negative as in FIG. 18 (b), the phase angle is either between 90° and 180° or between 180° and 270°.
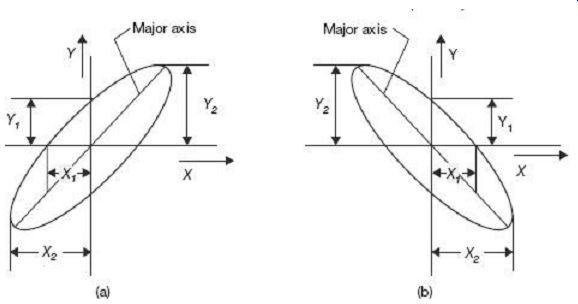
FIG. 18 Determination of angle of phase shift
10. SAMPLING OSCILLOSCOPE
This oscilloscope is specially used for observing very high repetitive electrical signals by sampling the input waveform and reconstructing its shape from the sample. Such high frequency signals cannot be viewed by a conventional oscilloscope because its frequency range is limited by the gain bandwidth product of its vertical amplifier. The sampling frequency may be as low as 1/100th of the input signal frequency, i.e., an ordinary oscilloscope having a bandwidth of 10 MHz can be used for observing input signal of frequency as high as 1000 MHz. As many as 1000 samples are used to reconstruct the original waveform.
A block diagram of a sampling oscilloscope is given in FIG. 19. The input waveform, which must be repetitive, as applied to the sampling gate. Sampling pulses momentarily bias the diodes of the balanced sampling gate in the forward direction, thereby briefly connecting the gate input capacitance to the test point. These capacitors are slightly charged toward the voltage level of the input circuit. The capacitor voltage is amplified by a vertical amplifier and applied to the vertical deflecting plates. The sampling must be synchronized with the input signal frequency. The signal is delayed in the vertical amplifier, allowing the horizontal sweep to be initiated by the input signal.
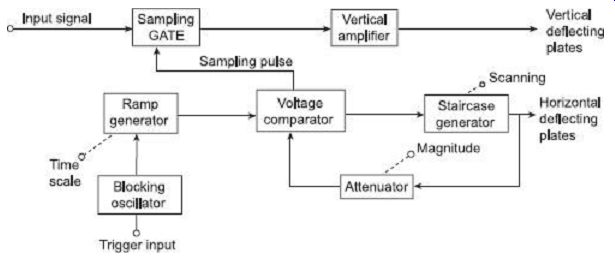
FIG. 19 Block diagram of sampling oscilloscope At the beginning of each
sampling cycle, the trigger pulse activates an oscillator and a linear ramp
voltage is generated. The ramp voltage is applied to a voltage comparator
which compares the ramp voltage to a staircase generator output voltage.
When the two voltages are equal in amplitude, the staircase generator is
allowed to advance one step and simultaneously a sampling pulse is applied
to the sampling gate. At this moment, a sample of the input voltage is taken,
amplified and applied to the vertical deflecting plates.
The resolution of the final image on the screen of the CRT is determined by the size of the steps of the staircase generator. The smaller the size of these steps, the larger the number of samples and the higher the resolution of the image.
The sampling oscilloscope can be employed beyond 50 MHz into the UHF range around 500 MHz and beyond up to 10 GHz. However, sampling techniques cannot be used for the display of transients waveforms as they are not repetitive signals.
11. STORAGE OSCILLOSCOPE
There are two types of storage oscilloscopes, namely, 1. Analog storage oscilloscope 2. Digital storage oscilloscope.
11.1 Analog Storage Oscilloscope
Storage targets can be distinguished from standard phosphor targets by their ability to retain a waveform pattern for a long time (10 to 15 hours after the pattern is produced on the screen). In a conventional CRT, the persistence of the phosphor varies from a few milliseconds to several seconds as a result of which, where persistence of the screen is smaller than the rate at which the signal sweeps across the screen, and the start of the display would fade before the end is written.
An analog storage oscilloscope uses the phenomenon of secondary electron emission to build up and store electrostatic charges on the surface of an insulated target. Such oscilloscopes are widely used (i) for real-time observation of events that occur only once, and (ii) for displaying the waveform of a very low frequency (VLF) signal.
The construction of a CRT using variable persistence storage technique, called the half tone or mesh storage CRT is shown in FIG. 20. With the variable persistence the slow swept trace can be stored on display continuously by adjusting the persistence of the CRT screen to match the sweep time.
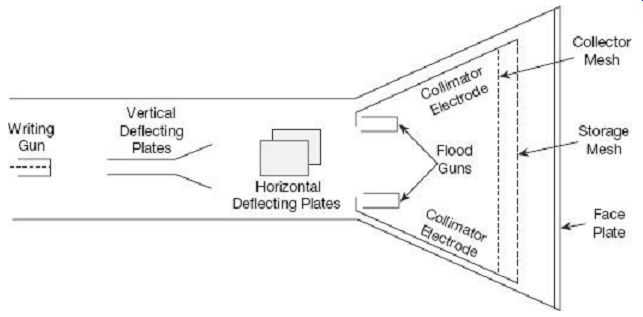
FIG. 20 Analog storage oscilloscope
A mesh storage CRT, illustrated in FIG. 20, contains a storage mesh, flood guns and a collimator, in addition to all the elements of a standard CRT. The storage mesh that is the storage target behind the phosphor screen is a conductive mesh covered with dielectric material consisting of a thin layer of material such as magnesium fluoride. The writing gun is a high-energy electron gun similar to the conventional gun, giving a narrow focused beam which can be deflected and used to write the information to be stored. The writing gun etches a positively charged pattern on the storage mesh or target by knocking off secondary emission electrons. This positively charged pattern remains exactly in the position on the storage target where it is deposited. This is due to the excellent insulating property of the magnesium fluoride coating on the storage target. The electron beam, which is deflected in the conventional manner, both in horizontal and vertical direction, traces out the wave pattern on the storage mesh. In order to make the pattern visible, even after several hours, special electron guns, known as the flood guns are switched on.
The flood guns are of simple construction and are placed inside the CRT in a position between the direction plates and the storage target and they emit low-velocity electrons covering a large area towards the screen. The electron paths are adjusted by the collimator electrodes consisting of a conductive coating on the inside surface of the CRT. The collimator electrodes are biased so as to distribute the flood gun electrons evenly over the target surface and causes the electrons to be perpendicular to the storage mesh. Most of the flood electrons are stopped and collected by the collector mesh and, therefore, never reach the phosphor screen. Only electrons near the stored positive charge are pulled to the storage target with sufficient force to hit the phosphor screen. The CRT display, therefore, will be an exact replica of the pattern which was initially stored on the target and the display will remain visible as long as the flood gun operates. For erasing of the pattern on the storage target, a negative charge is applied to neutralize the stored positive charge.
For achieving variable persistence, the erase voltage is applied in the form of pulses instead of a steady dc voltage; by varying the width of these pulses the rate of erase is controlled.
11.2 Digital Storage Oscilloscope
There are a number of distinct disadvantages of the analog storage oscilloscope. These disadvantages are listed below:
1. There is a finite amount of time that the storage tube can preserve a stored waveform. Eventually, the waveform will be lost. The power to the storage tube must be present as long as the image is to be stored.
2. The trace of a storage tube is, generally, not as fine as a normal cathode ray tube. Thus, the stored trace is not as crisp as a conventional oscilloscope trace.
3. The writing rate of the storage tube is less than a conventional cathode ray tube, which limits the speed of the storage oscilloscope.
4. The storage cathode ray tube is considerably more expensive than a conventional tube and requires additional power supplies.
5. Only one image can be stored. If two traces are to be compared, they must be superimposed on the same screen and displayed together.
A superior method if trace storage is the digital storage oscilloscope (DSO). In this technique, the waveform to be stored is digitized, stored in a digital memory and retrieved for display on the storage oscilloscope. The stored waveform is continually displayed by repeatedly scanning the stored waveform and, therefore, a conventional CRT can be employed for the display and thus some of the cost of the additional circuitry for digitizing and storing the input waveform is offset. The stored display can be displayed indefinitely as long as the power is applied to the memory, which can be supplied with a small battery.
The digitized waveform can be further analyzed by either the oscilloscope or by loading the content of the memory into a computer. Some of the digital storage oscilloscope use 12-bit converter, giving 0.025% resolution and 0.1% accuracy on voltage and time readings, which are better than the 2.5% of analog storage oscilloscopes. Split screen capabilities (simultaneously displaying live analog traces and replayed stored ones) enable easy comparison of the two signals. Pre-trigger capability is also an important advantage.
The display of stored data is possible in both amplitude versus time, and X-Y modes. In addition to the fast memory readout employed for CRT display, a slow readout is possible for developing hard copy with external plotters.
The only drawback of digital storage oscilloscopes is limited bandwidth by the speed of their analog-to-digital converters (ADCs). However, 20 MHz digitizing rates available on some oscilloscopes yield a bandwidth of 5 MHz, which is adequate for most of the applications.
FIG. 21 gives the block diagram of a digital storage oscilloscope (DSO). It uses both of digital-to-Analog and Analog-to-Digital (DACs and ADCs) for digitizing, storing and displaying analog waveforms. The overall operation is controlled and synchronized by the control circuits. Which usually have microprocessor executing a control program stored in Read-Only Memory (ROM). The data acquisition portion of the system contains a sample-and-hold (S/H) and a analog-to-digital converter that repetitively samples and digitized the input signal at a rate determined by the sample clock, and transmits the digitized data to memory for storage. The control circuit makes sure that successive data points are stored in successive memory locations by continually updating the memory's address counter.
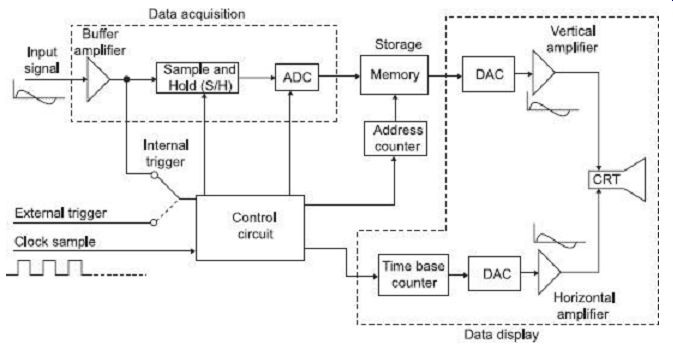
FIG. 21 Block diagram of Digital Storage Oscilloscope (DSO)
When memory is full, the next data point from the ADC is stored in the first memory location writing over the old data, and so on for successive data points. This data acquisition and the storage process continue until the control circuit receives a trigger signal from either the input waveform (internal trigger) or an external trigger source.
When the triggering occurs, the system stops acquiring data further and enters the display mode of operation, in which all or part of the memory data is repetitively displayed on the Cathode Ray Tube (CRT).
In display operation two DACs are employed for providing the vertical and horizontal deflecting voltages for the cathode ray tube. Data from memory produce the vertical deflection of the electron beam, while the time base counter provides the horizontal deflection in the form of a staircase sweep signal. The control circuits synchronize the display operation by incrementing the memory address counter and the time base counter at the same time so that each horizontal step of the electron beam is accompanied by a new data value from the memory to the vertical DAC. The counters are continuously recycled so that the stored data points are repetitively re-plotted on the screen of the CRT.
The screen display consists of discrete dots representing the various data points but the number of dots is usually so large (typically 1000 or more) that they tend to blend together and appear to be a continuous waveform.
The display operation is transmitted when the operator presses a front panel button that commends the digital storage oscilloscope to begin a new data acquisition cycle.
12. MULTI-INPUT OSCILLOSCOPES
Modem oscilloscopes have the multi-input facility. They display the multi input simultaneously. Two inputs is most generally used, although four and eight inputs are available for special applications. There are two primary types: single beam and dual beam. A single beam can be converted into several traces. A dual beam, on the other hand may also subsequently be converted into a further number of traces. Two input oscilloscopes are described in this section, although the principles are applicable to any number of inputs.
12.1 Dual Trace Oscilloscopes
The block diagram of a dual trace oscilloscope is shown in FIG. 22. There are two separate vertical input channels, A and B, and these use separate attenuator and preamplifier stages. Therefore the amplitude of each input, as viewed on the oscilloscope, can be individually controlled. After preamplification, the two channels meet at the electronic switch. This has the ability to pass one channel at a time into the vertical amplifier, via the delay line.
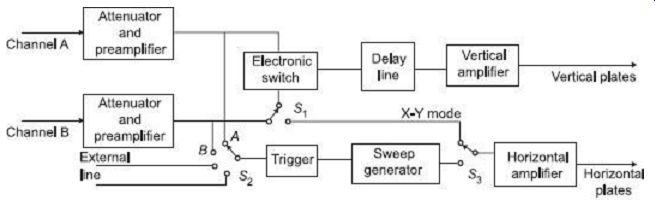
FIG. 22 Block diagram of a dual trace oscilloscope There are two common
operating modes for the electronic switch, called alternate and chop, and
these are selected from the instrument's front panel. The alternate mode
is illustrated in FIG. 23. In this figure, the electronic switch alternates
between channels A and B, letting each through for one cycle of the horizontal
sweep. The display is blanked during the flyback and hold-off periods, as
in the conventional oscilloscope. Provided the sweep speed is much greater
than the decay time of the CRT phosphor, the screen will show a stable of
both the waveform at channels A and B. The alternate mode cannot be used
for displaying very low-frequency signals.
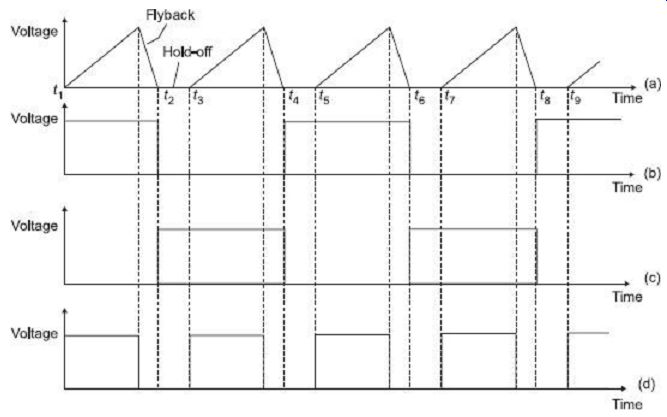
FIG. 23 Waveforms for a dual channel oscilloscope operating in alternating
mode: (a) Horizontal Sweep voltage (b) Voltage to channel A (c) Voltage to
channel B, (d) Grid control voltage
The chopped operating mode of the electronic switch is shown in FIG. 24. In this mode the electronics switch free runs at a high frequency of the order of 100 kHz to 500 kHz. The result is that small segments from channels A and B are connected alternately to the vertical amplifier, and displaying on the screen. Provided the chopping rate is much faster than the horizontal sweep rate, the display will show a continuous line for each channel. If the sweep rate approaches the chopping rate then the individual segments will be visible, and the alternate mode should now be used.
The time base circuit shown in FIG. 22 is similar to that of a single input oscilloscope. Switch S2 allow the circuit to be triggered on either the A or B channel waveforms, or on line frequency, or on an external signal. The horizontal amplifier can be fed from the sweep generator, or the B channel via switch S1. This is the X-Y mode and the oscilloscope operates from channel A as the vertical signal and channel B as the horizontal signal, giving very accurate X-Y measurements. Several operating modes can be selected from the front panel for display, such as channel A only, channel B only, channels A and B as two traces, and signals A + B, A - B, B - A or -(A + B) as a single trace.
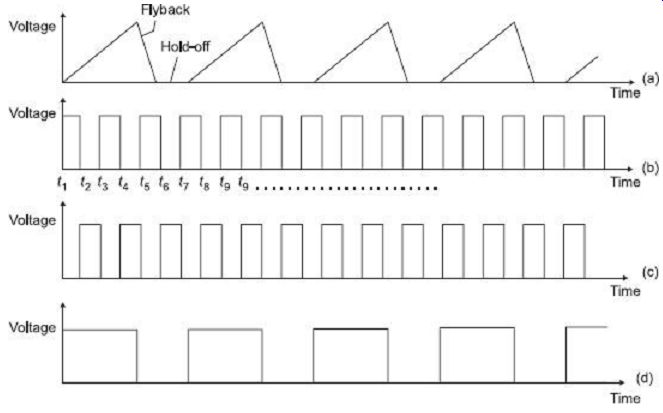
FIG. 24 Waveforms for a dual channel oscilloscope operating in chopped
mode: (a) Horizontal sweep voltage (b) Voltage to channel A (c) Voltage
to channel B, (d) Grid control voltage
12.2 Dual Beam Oscilloscopes
The dual trace oscilloscope cannot capture two fast transient events, as it cannot switch quickly enough between traces. The dual beam oscilloscope has two separate electron beams, and therefore two completely separate vertical channels, as in FIG. 23. The two channels may have a common time base system, as in FIG. 22, or they may have independent time base circuits, as in FIG. 25. An independent time base allows different sweeps rates for the two channels but increases the size and weight of the oscilloscope.
Two methods are used for generating the two electron beams within the CRT. The first method used a double gun tube. This allows the brightness and focus of each beam to be controlled separately but it is bulkier than a split beam tube.
In the second method, known as split beam, a single electron gun is used. A horizontal splitter plate is placed between the last anode and the Y deflection plates. This plate is held at the same potential as the anode, and it goes along the length of the tube, between the two vertical deflection plates. It therefore isolates the two channels. The split beam arrangement has half the brightness of a single beam, which has disadvantages at high frequency operation. An alternative method of splitting the beam, which improves its brightness, is to have two apertures in the last anode, instead of one, so that two beams emerge from it.
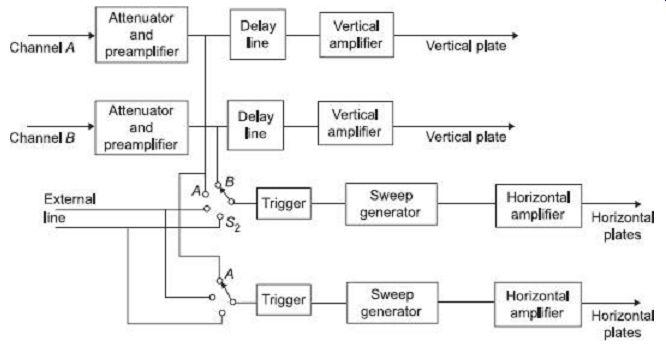
FIG. 25 Block diagram of a dual beam oscilloscope with independent time
base The disadvantage of the split beam construction is that the two displays
may have noticeably different brightness, if operated at widely spaced sweep
speeds. The brightness and focus controls also affect the two traces at the
same time.
13. FREQUENCY LIMITATION OF CRO
Deflection of electron beam on the screen in Y direction is given by , where Ed is the potential between deflecting plates. In this derivation, the plate voltage is assumed constant during the motion of the electrons through the deflecting field. If the voltage applied to the vertical deflecting plates change during the transit time of the electrons through the horizontal plates, the deflection sensitivity gets decreased.
Where:
l = length of deflecting plates
Vox = velocity of electron while entering the field of deflecting plates.
The transit time impose a limitation of the upper frequency limit. An upper frequency is defined as that frequency at which the transit time is equal to one quarter of the period of the voltage applied to vertical plates.
The frequency range of the oscilloscope can be increased by sub-dividing the deflecting plates in a number of sections in the path of electron beam. The voltage being measured is applied to the vertical plates through an iterative network, whose propagation time corresponds to the velocity of electron; thereby the voltage applied to the vertical plates is made to synchronies with the velocity of the beam. The use of this technique allows the CRO to be used up to frequencies of 500 MHz and above.
QUIZ
Objective Questions
1. The time base signal in a CRO is (a) a sinusoidal signal (b) a sawtooth signal (c) a square wave signal (d) a triangular wave signal
2. In CRT aquadag carries (a) secondary emission electrons (b) sweep voltage (c) aqueous solution of graphite (d) none of these
3. In a CRO, the sawtooth voltage is applied at the (a) cathode (b) accelerating anode (c) vertical deflecting plates (d) horizontal deflecting plates
4. The purpose of the synchronizing control in a CRO is to (a) adjust the amplitude of display (b) control the intensity of the spot (c) focus the spot on the screen (d) lock the display of signal
5. Retrace period for an ideal sawtooth waveform is (a) 0 second (b) equal to tracing period (c) infinite (d) none of these
6. In a CRT, the highest positive potential is given to (a) cathode (b) focusing electrodes (c) vertical deflecting plates (d) post-deflection acceleration anode
7. The X and Y inputs of a CRO are respectively V sin ?t and - V sin ?t.
The resulting Lissajous pattern will be (a) a straight line (b) a circle (c) the shape of 8 (d) an ellipse
8. The patterns used to measure phase and frequency with a cathode ray oscilloscope are called (a) Faraday's pattern (b) Ohm's patterns (c) Lissajous pattern (d) Phillips pattern
9. The voltage 10 cos ?t and V cos (?t + a) are applied to the X and Y plates of a CRO. The Lissajous figure observed on the screen is a straight line of 60° to the positive axis.
Then (a) V = 10, a = 60° (b) V = 10, a = 0° (c) V = 10 , a = 60° (d) V = 10 , a = 0°
10. Sampling oscilloscopes are specially designed to measure (a) very high frequency (b) very low frequency (c) microwave frequency (d) none of these
11. Which of the following statements is not correct for a storage-type oscilloscope?
(a) Secondary emission electrons etch a positively charged pattern.
(b) The flood guns used for display, emit high velocity electrons.
(c) The flood guns are placed between the deflection plates and storage target.
(d) The storage target is a conductive mesh covered with magnesium fluoride.
12. In a digital oscilloscope, the A/D converters are usually (a) ramp type (b) flash type (c) integrating type (d) successive approximate type
13. A double beam oscilloscope has (a) two screens (b) two electron guns (c) two different phosphor coatings (d) one waveform divided into two parts
14. Two equal voltages of same frequency applied to the X and Y plates of a CRO, produce a circle on the screen. The phase difference between the two voltages is (a) 150° (b) 90° (c) 60° (d) 30°
15. The Lissajous pattern on a CRO screen is shown in the given figure: The frequency ratio of the vertical signal to the horizontal one is (a) 3 : 2 (b) 2 : 3 (c) 5 : 1 (d) 1 : 5
Questions
1. What is meant by the deflection factor and deflection sensitivity of a CRO? What is aquadag?
2. Discuss the advantages and disadvantages of analog and digital type of oscilloscope.
3. Explain the functioning of the time base generator in a CRO with proper diagram.
4. Describe the phenomenon of synchronization of vertical input signal to its sweep generator.
5. Discuss the triggered sweep in a CRO.
6. Why is a CRO considered one of the most important tools in the field of modern electronics? What is the heart of a CRO?
7. How is the frequency of an ac signal measured with the help of CRO?
8. How is the phase difference between two signals measured with the help of the CRO?
9. "The focusing system of a CRO named as an electrostatic lens." Explain.
10. What are the differences between dual trace and dual beam oscilloscopes?
More Questions
1. (a) Draw the block diagram of a CRO and explain the different components.
(b) The deflection sensitivity of an oscilloscope is 35 V/cm. If the distance from the deflection plates to the CRT screen is 16 cm, the length of the deflection plates is 2.5 cm and the distance between the deflection plates is 1.2 cm, what is the acceleration anode voltage?
2. (a) Derive an expression for the vertical deflection on the screen of a cathode ray tube in terms of length of plates, separation distance, accelerating voltage and distance of screen from the origin.
(b) In a CRT, the distance between the deflecting plates is 1.0 cm, the length of the deflecting plates is 4.5 cm and the distance of the screen from the centre of the deflecting plates is 33 cm. If the accelerating voltage supply is 300 volt, calculate deflecting sensitivity of the tube.
3. What are Lissajous patterns? From the Lissajous patterns, how can the frequency and the phase difference be measured?
4. What are the advantages of dual trace over double beam for multitrace oscilloscopes? Explain the working of a dual trace CRO with the help of the proper block diagram.
5. Explain the working principle of a sampling oscilloscope with the help of proper block diagram. What precaution should be taken when using the sampling oscilloscope?
6. Draw the block diagram of a storage-type oscilloscope and explain the working of each block. How does the digital oscilloscope differ from the conventional analog storage oscilloscope?
7. Write short notes on the following.
(a) Vertical amplifier
(b) Electromagnetic focusing
(c) Delay line
(d) Frequency and phase measurement by CRO
(e) High frequency oscilloscope
(f) Free running sweep
(g) Oscilloscope limitations
Prev. | Next