AMAZON multi-meters discounts AMAZON oscilloscope discounts
I. Peripheral Pulse Measurement
EXPERIMENT
To prepare a transducer for pulse (arterial) measurement and
1. To record the pulse waveform
2. To determine the heart rate.
Additional experiments might involve the design of a suitable active 50 Hz active notch filter for the signal picked up from the photo detector.
LIST OF PARTS AND APPARATUS
1. LDR CdS 1cm dia with dark resistance of 100K ohms -1 or
2. Photo transistor IPL33 -1
3. Circuit components as per diagram given.
4. An electrical wiring PVC Conduit T of 1 inch dia.
5. A filament bulb of 3 V 45 mA as found in mini hand torches
6. A 5 V power supply, ripple free. (10 mV)
7. A long persistence oscilloscope 5mV sensitivity, 1 MHz bandwidth enough.
or a digital storage oscilloscope such as TDS2024 (Scientific).
PROCEDURE
The finger pulse pick up is one the simplest of pulse transducers to know the arterial blood flow and also to determine the heart rate. The same signal can also be used to determine the Diastolic pressure in the indirect blood pressure measurement (see Expt.2).
The T tube of PVC is ideal for inserting the thumb of the left finger into the vertical hole and then the two sides of the T are for housing the lamp on the one side and the photo detector circuit board on the other.
A circuit for the same using the LDR was given in the Section on Circulation measurements. It is given again here.
The circuit provides the output of 100-200mV at the collector of the transistor. This can be directly observed on a long persistence CRO or the Digital storage oscilloscope. The reason why general purpose oscilloscopes are not useful is that here, the time base is to be set as 2 seconds per sweep and the signal is coming so slowly that the trace fades away before permitting one to view the complete sphygmogram.
In a (orange phosphor) long persistence tube CRO, this is visible. In a Digital storage oscilloscope, since only the stored data is repeatedly presented, the trace is visible, even though the effective sweep is 2 second.
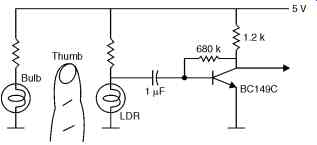
FIG. 1 Pulse pick up circuit.
In DSOs, there is provision to send the waveform data, after "freezing" it to a PC through the interface provided on the scope. Usually RS232 interface is simple, and the copy can be printed on the PC printer.
The data file is available for processing as well.
FIG. 2 below shows another circuit for the pick up.
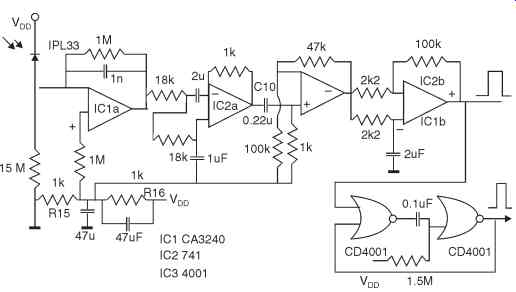
FIG. 2. Showing the circuit of the pick up amplifier and the pulse shaper.
The use of the photodiode can be similarly made as the LDR, but the current through the diode is operated at a much less value since the diode is actually worked in reverse mode. So, a high input operational amplifier is useful for picking up the signal. A dual IC OPAMP (CA3240) is chosen for the initial amplification because of its relatively low noise and high impedance FET input. The reverse leakage current as affected by the light passing through the finger pulp is amplified.
The second amplifier is connected as a second order low pass filter with a cut off frequency of 15 Hz.
The sphygmo signal is available at the capacitor C10. Further to this, two more stages of OPAMPs are shown. The IC4a is a 50 gain amplifier. The output from this is connected to IC1b, via resistors 2K each. This amplifier is connected with positive feedback by connecting 100 K between the amplifier output and its positive input. This feedback ensures that the amplifier output voltage switches almost between the supply rails VDD and zero volts. It is like a Schmitt trigger. To ensure that double switching due to dicrotic notch on the signal does not occur, the signal is passed through a 300 ms mono-stable using CD4001 in IC3 b and a. To get the center voltage from the single power supply, the resistors R15 , 16 are used, with decoupling by 47 microFarad capacitors.
The power supply for this circuit would be 9V from a regulated supply, using a 7809. The bulb is series connected with a current limiting resistor which absorbs the balance voltage. For e.g., if a 3.6 V bulb is used, then the 4.4 V divided by the current of 50 mA in the bulb will need a resistor of 91 ohms, 1/2 W.
EXPERIMENT
Record the waveform of the finger pulse for several subjects and compare between them through amplitude, Frequency and wave shape. ( FIG. 3)
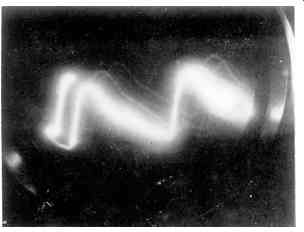
FIG. 3
USE OF NOTCH FILTER
The signal might be picking up 50 Hz hum due to improper filtering of the power supply to the bulb, causing the hum through the light source. For this purpose, a filter of high Q using active op-amp can be used.
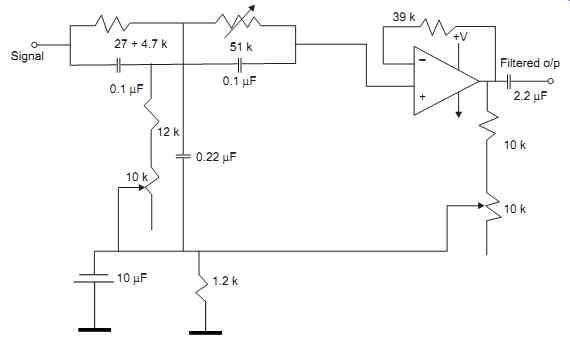
FIG. 4. Active Notch Filter Circuit.
By adjusting the 51K and the 10K resistor at the left, the frequency is tuned to 50 Hz for rejection, using an audio frequency generator. Then, the Q of the filter is adjusted by the right 10 K resistor for best notch effect as observed on the signal of interest, the sphygmo signal.
II. Blood Pressure Measurement with Sphygmomanometer
EXPERIMENT
To learn to measure the Blood pressure of a subject properly, using the Riva-Rocci method.
Also, to investigate the alternatives in measuring the diastolic pressure.
APPARATUS
1. The mercury well sphygmomanometer with inflating cuff and a stethoscope.
2. Alternatively the CH-403C Citizen make B.P. automatic measurement apparatus. (avail able here)
3. A glass T tube of size to fit on the rubber tubing used in the above units.
4. The finger pulse pick up with a storage oscilloscope for viewing the signal, or else a long persistence amber screen scope.
PROCEDURE
The cloth lined rubber cuff is tied on the left hand of the subject above the elbow. There should be an initial tightness on the binding, otherwise too much air bulb pressing would be required. Keep the manometer opened out and erect. The T tube (3) is not be used now, but in a subsequent experiment.
Inflate the cuff by the air bulb observing the rise of mercury in the manometer. Simultaneously, feel the pulse of the subject stopping as the pressure goes above a value, say 150 mm of mercury. That is, the inflation is to be done till the pulse stops in the radial artery, as observed on the wrist. Then, using the release valve on the air bulb, slowly release the air so that the mercury drops little by little in steps of 5 mm preferably.
Then, observe the sound of the occluded artery by placing the stethoscope on the elbow above the artery, that is, just below the cuff on the hand . Try practicing to listen to the sounds that start as the pressure is released slowly. Tick, Tick sounds are heard with increasing loudness which finally fades. Note the pressure on the manometer just when the first sound is heard, indicating the systolic pressure. Then, when the sound fades, just note the pressure, which is called the diastolic pressure.
Repeat the experiment and note the sounds clearly and correctly assess the diastolic pressure.
Using the finger pulse pick up for assessing the diastolic pressure
If the finger pulse pick up is also used with the subject, then it is possible to measure the diastolic pressure by noting when the signal increases and reaches a maximum and falls. The signal will rise as the cuff pressure is released below systolic pressure. Then, when it reaches the lower diastolic pressure value, the artery fully admits blood flow and hence the signal increases.
This signal increase can be observed on the scope, by using a slow time base as in FIG. 3. Then, when the rise is maximum and then it falls, note the pressure, which is the diastolic pressure.
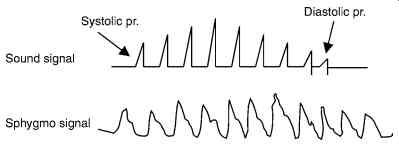
FIG. 4
After reaching maximum value, the pulse signal remains constant as it should be, whereas the sound signal is absent after diastolic pressure.
If a suitable meter is provided on the output of the finger pulse signal, using a 500 uA mini meter (such as the one available as VU-meter for audio parts shops for Rs. 30/-), then the observation of the peak of the signal would be easier.
A good electronics enthusiast could relate this maximum rise point to switch on to the pressure channel to show the diastolic pressure accordingly on a display.
Use of Sensym Pressure Sensor
Instead of measuring the pressure by a manometer, as the unit CH403 (Citizen make) does, one can use a pressure transducer for measuring the pressure and use the signal output from it for a digital read out.
APPARATUS
1. Sensym pressure transducer 0 to 30 psia (SX30AN)
2. Circuit for getting the analog value of the pressure from the sensor
The Sensym products are of USA origin but they are available locally. The pressure transducer is small size unit like a matchbox and has a tube connection for connecting to the pressure line. That is why, the T tube is used to connect the pressure tube to this inlet in addition.
The Sensym pressure transducer is a bridge of semiconductor strain gauge mounted on the flexing diaphragm under pressure applied. The signal is generated by passing a constant current to the Wheatstone bridge like configuration inside the unit. The output signal is to be amplified by an OPAMP.
There are four pins on the small unit for connecting to the internal bridge.
The transducer is sensitive, fast in response and fairly accurate, after calibration of the signal.
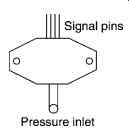
Sensym sensor.
Schematic of the pressure transducer
The circuit is shown below in FIG. 5. A 5 V stabilized source feeds the sensor bridge. The Diodes D1-D4 are for temperature compensation of the bridge. Three sections of LM324 OPAMP are used to amplify the milli-volt output of the bridge to a level for A/D conversion.
When there is no pressure applied to the sensor the voltage between pins 2,4 is zero.
However, there may be a small voltage, called zero offset. To compensate that , pot R16 allows a small DC volts to be fed to the amplifier that would negate the offset voltage.
When the sensor is exposed to 30 psi, corresponding to about 760 mm of mercury on a manometer, the bridge will generate about 35 mV. This is only a rough figure, that might vary from one sensor to another. R6 adjusts amplifier gain.
The ICL 7106 is an A/D converter together with the LCD display. The voltage between pins 7 and 8 is the output which is fed to the IC. The reference voltage is between pins 35 and 36. This is set by R2-R4 to be 240 mV.

FIG. 5. Circuit of Sensym Sensor based Blood Pressure Meter.
If this circuit board is made and kept ready, then the experiment can be performed easily.
A microcontroller based circuit board can also made to order and the output from the bridge can be analog digital converted and used by the microcontroller to display the value. Also, the sound signal as picked from a mike under the cuff can be read by the microcontroller. The logic can be programmed to display the systolic and diastolic pressure from the sound signal sensing through a software on the unit.
A typical microcontroller board with LCD alphanumeric display is ideal.
FIG. 5 showing the circuit of Sensym pressure transducer and LCD display 7106.
III. Study and Measurements on the Commercial ECG Recorder
EXPERIMENT
To study the use of the ECG recorder on a subject and get the waveforms of the ECG correctly without any artifacts.
APPARATUS
1. A hot stylus recorder based portable ECG machine with lead selector switch, patient cable
2. Chart paper, jelly tube, electrode clips for limbs and suction cup electrodes for chest.
3. Signal output to CRO PROCEDURE
Note the markings of the color on the leads and connect the patient cable to the subject in lying position, with chest open.
The colors of the leads I to III are used to connect the patient electrodes to the hands, feet.
The chest lead is either taken one by one, or in some machines, they keep all cups for the V leads at the same time. This solves the problem of smearing of jelly on the chest causing signal interaction among the V leads.
The subject must be lying on a wooden table. There may not be any jewels or ornaments of metal on the person.
Jelly is applied in small dots at the places of contact on the limbs and chest positions V1 to V6, as shown in the Section on ECG.
1. First the Machine is switched on. Then, the calibrate button is pressed, so that the chart paper moves and shows the 1 mV pulse standard. Note that is consistently the same amplitude.
2. Then take the lead selector switch to Lead I position and the ECG should be moving on the paper.
3. Take two or three waves and switch to lead II and likewise to lead III.
4. Then switch to the recording of the auxiliary leads aVR, aVL, aVF.
5. Then connect to the V leads and obtain the six records.
6. Finally, for Lead II, take a Ecg after asking the subject to take and hold a deep breath for ½ min and record 3 cycles of ECG.
Do not waste chart paper unnecessarily.
Now, switch off the machine, clean the subject free of jelly and then look at the records.
Technical aspects
1. Is the record in all cases free from base line shift?
2. Is the record showing 50 Hz hum in any one or more leads?
3. Is the record showing adequate amplitude as a normal subject ? Medical aspects
4. Draw the cardiac vector on the Einthoven triangle and measure the angle. Is there any deviation from normal?
5. Observe all V leads and find their uniform change from V1 to V6. The T waves must all be upright.
6. Observe the ST segment and note that it is iso-electric.
7. Observe the QRS complex at each of the 12 leads and see if there is a proper QRS with no broadening or Q-wave indication or notched QRS.
8. Since the subject you will be using is not likely to have any abnormalities, the waveforms should be showing normal ECG only.
9. In order to observe and study pathological conditions, it would be necessary to take to a hospital.
EXPERIMENT
To study the frequency response and transient response of the ECG recorder.
APPARATUS
Same as per the above experiment, but no need for jelly or patient electrode clips. An audio oscillator with calibrated output (or with meter)
PROCEDURE
1. Frequency Response
This is to be determined for the ECG machine from externally applied signals from a variable frequency oscillator. We are going to use only up to 150 Hz.
How to connect the oscillator output to the ECG machine? Since the signal from an audio oscillator is likely to be in the Volts range and since we have to feed only millivolts to the machine, the signal output from the oscillator is to be attenuated by resistor divider.
Further, the signal has to be applied in differential mode, i.e., between any two leads with earth lead being the ground of the oscillator.
One way to give this is shown in figure below.
Measure the voltage as above to be 1 mV on a digital 4.5 digit LCD meter on the AC scale.
Then connect the lead wires to this resistor network as shown and switch to LEAD 1 position.
Then, apply the signal from oscillator little by little varying the frequency and noting the record response.
The chart paper should not be wasted and just enough movement for each spot frequency is to be taken.
Tabulate the results indicating amplitude and frequency.
Plot the response on a graph paper.
One can use computer software for drawing the graph using a graph program such as EXCEL.
Precaution is that it is necessary to maintain the voltage at 1mV in all frequencies.
The response curve should match the standard given by AHA.
Observations
1. Is there is any notch or peak in the frequency region at any frequency?
2. Did you find there is a dip at 50 Hz? If so, the filter select must be deselected.
3. Is there any response above 100 Hz?
4. What will be the shape of the normal ECG if the instrument's response was peaking at 2 Hz.
For example? How will it affect the QRS and T waves? Transient response In order to record the transient response, it is necessary to apply a step input of 1 mV. For this, a DC voltage of 1 V is applied to the network. But the recorder is kept on before switching the DC voltage on.
The response curve should indicate the fast rise over a division of one or 2mm and there may be a slight overshoot.
The response of course includes the amplifier part and the recorder part put together.
IV. Biological Amplifier in the EEG Signal Recording
EXPERIMENT
To use the Biological amplifier in the EEG-mode and record scalp EEG signals.
A strip chart recorder for fast recording. Dedicated hot stylus or pen motor type recorders are not available. This can be a PC based recording on printer if the signal is coupled through a serial port to the computer and a software on the same outputs the record to the printer (dot matrix) with continuous feed paper.
Or Use a multi-channel EEG machine to record EEG signals.
PRINCIPLE
The use of biological amplifier in the most sensitive EEG mode is made use of in order to record EEG signals. However, with this, only a sample EEG signal can be noted. This is not meant for studies relating to signals from the brain, since that would need a large number of signals from several sets of electrodes.
Just recording a single signal from any one set of electrodes on the brain is only for the purpose of detecting brain activity such as during the progress of anesthesia administration. It is also useful for simple evoked potential experiments from flash light signals by signal processing.
However, for a full EEG signal recording, the use of an EEG machine is necessary, but since the same is expensive, a biological amplifier which has got provision for ECG, EEG or filtered signal outputs is sufficient.
A description of the Devices Inc., make Biological amplifier is given at the end of this experiment.
Accessories
Electrode for scalp-1 pair
Head belt with holes for fixing the electrode
Indifferent electrode-1 no.
Flashing source of light with a pulse output at the moment of the flash. Argon flash bulb based units are available.
PROCEDURE
1. The use of a shielded cage for the subject is essential for this experiment. The table or bench on which the subject lies is enclosed with a cage of copper or brass wire mesh and the shielded cable from the electrodes reach the amplifier which is outside the cage. The cage can be a size of 1.5 m × 2.5 m × 2 m, in l × b × w dimensions. The mesh must be connected to ground connection of the power outlet or to separate ground pipe laid for the laboratory.
2. The amplifier can be either battery operated with built in storage battery as it is now-a days available. In that case, the hum pick up will be minimal.
3. After fixing two electrodes on the occipital lobe position O1 and O2, and the common ground electrode somewhere outside the head, near the ear or chin, the subject is asked to lie down and react to the signals applied to him through light flash.
4. The amplifier output is recorded on a strip chart recorder. The record can take quite a bit of time, even up to 30 minutes.
5. During the record, the flash light is made to blink which the subject watches for a minute. The record is taken note on the paper when the flash appears. The blink rate can be 1 or 2 seconds.
6. It is dangerous to apply these flash light signals to persons who are sensitive and prone to epileptic attack.
After completing the records, the waveform is looked up and analyzed. If the data is fed to the computer, the analysis can be done through ensemble averaging by separating the records to several groups of 1 minute duration each and then averaging the signals. Each such group should begin with the instant of the flash correctly, which can be also fed to the computer through a signal available from the flashing light.
The records show the evoked response of the photic stimulation. This should be within limits on the records.
If the EEG machine itself is used, the same is provided with the flash source and the records can be observed on the length of chart paper. Even here, the signal averaging requires communication of the signal to a computer and then average processing is done there.
RESULTS
The results of the EEG recording would be the observation of the standard alpha to theta rhythm of the brain which, when there is evoked response, does not show easily on the record, but only with extensive recording and averaging the signal samples.
V. Biathermy Machine for Surgery
EXPERIMENT
To study the details of the surgical diathermy apparatus and to use it for mock cutting and examine the safety aspects of using the instrument. Observation of variations in waveform for cutting and coagulating modes.
Apparatus
Surgical:
Diathermy apparatus 500 W or 1 KW S.W. (Short wave) Electrodes for cutting and coagulating.
The back plate for patient.
Wire wound resistors of value 1 K, 10 ohms, 200 ohms at 10 W and 200 ohms 22 W.
Any 10MHz bandwidth C.R.O., with shielded probe. (10:1 probe)
PRINCIPLE
The Short wave diathermy apparatus is of two types - either the spark gap discharge based or generator based. The latter is predominantly in use today.
The short wave power is delivered at a level which can be adjusted.
The cutting action uses a burst of the R.F. power while for coagulating, it modulates the waveform with a lower frequency.
The use of the apparatus is by means of a foot switch for controlling the on and off by the surgeon.
The indifferent electrode is a large stainless steel plate which is kept under the back of the patient undergoing surgery. This must make the best contact with his body. If there is a small contact resistance there, then the current, being large, when passing through that resistance, will heat the skin sufficiently high and cause burns on the back.
This is one of the problems in using this apparatus.
Further, there are problems of burns happening at other points of the body also, where too, a contact with the earthed bed might be there.
EXPERIMENTS
1. Waveform observation. Switch the instrument on and wait for a time of 1 minute.
Then apply the patient switch after setting the control to cutting/coagulating. Connect a 1K / 10W resistor to the electrode in series with a 10-ohm 10 W. Then take wires from the 10 ohm resistor and connect to the CRO shielded cable. Thus, only 1/100 the of the output voltage is taken to the CRO. This is when a 10:1 probe is not available for the C.R.O. If 10:1 probe is available, then the 10 ohm can be increased to 100 ohms. In each case, observe the waveform of the output through a shielded CRO probe, setting the time base for a sweep of 100 microseconds. This will show the RF wave of 2.5 MHz from the instrument in the two cases clearly, with and without a modulating component. Try measuring the modulation frequency. If there be other switch settings, try and note the differences in the modulation.
2. Connect a high wattage 200 ohm 22 W resistor to the output and then switch on. Now observe the effect of applying the power. There will be instant heating up of the resistor and it may be burnt off. This shows that adequate power output is available.
3. Use the electrodes for seeing the effect. But this is very dangerous without using a hand glove of rubber. Use some heavy vegetable item such as a melon and keeping it on the back plate, try using the cutting electrode with lowest power output. As the electrode is just brought near, a spark will occur and then by dragging the electrode, the matter is cut. The voltage is high enough to start an arc at the cutting point. When trying in the coagulate switch position, the power level is less and the effect will be noted to be different.
In actual surgery, coagulation seals up the blood vessels and prevents excessive bleeding after a cut has been made.
4. The safety aspect at the indifferent electrode: Some units try to measure the contact resistance of the back plate. If there is provision for it, then there will be an additional resistance measuring electrode on the patient's skin fixed near to the plate location. For the experiment, then, that plate will have to be brought into contact with the big plate for the unit to work. Try connecting a resistance of wire wound 10 ohms between the small sensing electrode plate and the main plate. See if the unit works or gives a warning light. Because even a small resistance of contact can cause undue heating of the skin, the unit needs to monitor the same.
For units not having this feature, the user must take the adequate precautions to see that the contact resistance is minimal and by keeping the patient well in contact with the plate. (He will any way be under anesthesia).
VI. E.M.G Apparatus Experiments
EXPERIMENTS
To understand the principles of Electro-myographic measurements with simple equipment and understand the problems of accurate recording of muscle potentials and diagnosing muscular problems and related nerve conduction problems.
Apparatus
1. A C.R.O. preferably of long persistence or else a Digital storage type with high sensitivity of at least 2 mV/cm.
2. An EMG differential amplifier
3. Electrodes of several types for observation only. Needle, concentric needle, small plate and circular metal (chlorided silver) types.
4. External stimulator for stimulus based experiments.
PRINCIPLES
The possibilities of conducting EMG experiments have already been outlined fully in the section on EMG.
Here, the simple and basic experiment on voluntary muscle contraction and associated action potential complex can be measured. The conduction velocity of nerve can be an additional experiment.
PROCEDURE
Two surface pick up electrodes are fixed to the thumb at the extremities and the ground plate is held tied to the wrist. The ground electrode is a conducting strip and is often a saline soaked strap wrapped around the patient's limb, i.e., above the wrist.
The differential amplifier output is connected to the CRO.
The differential amplifier is set for a gain of 1000 fixed. It must be having a CMRR of over 10,000.
The subject then makes contractions of his hand muscle and the observations are noted on the CRO at a gain setting of 2 mV per cm. The time base will be 100 or 200 ms sweep.
The potential waveforms are of the order of a few milliseconds and the amplitude will be within 5 mV. Thus only weak signals can be noted with the set up.
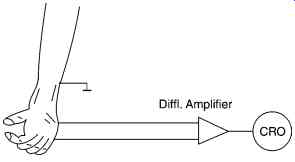
FIG. 6. Showing the set up for the voluntary muscle action potential measurement.
Propagation velocity of nerve impulse on a motor nerve
The details of the above were given in the Section on EMG.
The stimulus is to be applied to the stimulus electrodes and the signal applied is a 30-40 V pulse stimulus, single pulse, biphasic. A stimulator set up for this purpose must be first tested for its function and the level of voltage must be kept adjusted properly before the same is applied to the leg. If a stimulator is not available, a capacitor of 100 microfarad 63 V is kept charged to 50 V from a DC supply and then discharges through a switch into a small 50 mA 220 V/6 V mains transformer through the secondary. Then the primary winding is connected in series with a 2K resistor to the stimulus point for stimulation.
From the measurements made of the delay obtained from the trigger point and the peak of the action signal, the velocity of the nerve conduction can be estimated.
VII. Study of Pacemakers and Defibrillator
EXPERIMENT
To study the external demand pacemaker unit and to examine its functions
To study the defibrillator unit and learn to maintain it.
Apparatus
Pacemaker unit - external use model.
D.C. defibrillator unit with external pad electrodes.
PRINCIPLE
The pacemaker is an adjunct to an intensive care bed for cardiac patients. The catheter based pacing is meant for external pacing.
The Demand pacemaker uses the QRS complex to time the pulse only after the vulnerable period.
The unit has to be studied side by side with its circuit diagram, opening out the parts for visibility.
A typical unit may comprise of three sub systems.
1. Timing functions along with the rate indicating meter, the pulse output circuit
2. This senses the input ECG signal, if one is applied. This identifies the QRS complex if present and inhibits system 1 for a duration determined by the rate chosen.
3. This part is the power supply, the circuit including the microcontroller that operates the several sections.
The section 2 is the most important part of the unit. The ECG strip signal from the patient is processed by amplification and filtering. Then, a programmed refractory period is waited for, and signals arriving outside this period reset the timing control circuit. A hysteresis period is also programmable in some units.
The purpose of hysteresis is to stop the output from the pulse generator if the heart produces ECG even at a rate slightly below the programmed pacing rate. Hysteresis timings can be from 0, 100, 200 to 375 ms.
PROCEDURE
1. Set up for a rate of 72 beats per minute on the pacemaker front control.
2. Observe the nature of the waveform at the output pins. The pulse need not be a pure rectangle. Observe the leading and trailing edge values.
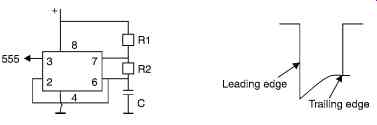
FIG. 7. Test circuit for testing demand pacing.
Measure the width of the pulse
3. Vary the rate to 120 and observe the same, noting if the width decreases. It must not.
4. In order to generate and ECG and examine demand pacing action, set up a short pulse generator using a 555 timer, which times at a rate of 0.8 second per pulse and make the pulse width very narrow, about 50 ms. Try R1 = 100K + 470 K variable, R2 = 10 K and C = 4.7 uF.
5. Apply this pulse to the ECG input socket of the pacemaker at a low amplitude, about 0.1 V through a potentiometer.
6. Observe if inhibition takes place at the output when the rate is set at 72.
7. Vary the rate and observe the inhibitive effect.
8. Measure the output voltage for various loading resistors, from 50 to 500 ohm.
Keep the output level setting at a fixed point.
Other features
There are pacemakers which are programmable by external programming feature.
The same may be a magnetic card or any other type. The programming information can be fed in the command code to tell the rate, width, amplitude and mode of operation.
VIII.D.C. Defibrillator
Study the portable defibrillator unit
1. Is it provided with the ECG monitor?
2. Is it a synchronized type? In the synchronized type, the application of the shock pulse of defibrillation is avoided for 25-30 ms after the R wave, if exists.
3. Note if there is an energy level indicator for the charged capacitor.
4. Is the unit mains powered or only uses it for charging its internal batteries?
5. When the Defib button is pressed, note what relay inside operates. Is it a glass vacuum relay?
6. Examine the output sockets how high level of insulation is provided for the contacts and also the patient cable.
7. Is there a push switch on the paddles?
8. Now, charge the unit and press the electrodes on conducting foam pad kept on a metal plate over an insulating table top. Observe the discharge sound.
9. Note how long it takes for the charge to build up again for applying a second shock, if need be.
10. If the unit is battery operated, remove the mains connection and use it from the battery power alone. Observe how much the battery voltage drops after each shock delivered by testing as in 8.
11. Note how long it takes for the battery to get its full charge with mains input given. This figure might increase with age of the battery and hence a record of this will indicate the condition of the batteries.
IX. Micro Shock Demonstration Experiments
EXPERIMENT
To demonstrate on a phantom how microshock currents flow through a patient in an I.C.U. or surgery unit.
APPARATUS
A mock ECG recording with display unit A mock Defibrillator A mock pressure transducer for arterial puncture catheter based measurement A mock patient motorized bed A toy patient positioned on the bed.
PRINCIPLES
It is commonly learnt that possibilities of small currents of a.c. supply of the order of 500 µA and above pass through the heart itself, which will instantly set the heart into a fibrillating state.
These small currents through the heart of a patient are produced unknowingly through fault or leakage currents diverted through the catheter and electrodes inserted into the body of the patient during surgical or intensive care operations.
Therefore, the equipment connected to a patient through internal or even well contacted surface electrodes must be free from faults and all conditions that might lead to such a current flow through the heart should be not only well known to everyone and be averted.
Since it is not possible to actually see such a condition in any I.C.U., in order to understand how and why such a microshock could happen totally in an unexpected manner, this experimental schedule is built using mock components and is meant to demonstrate the same under several possible conditions.
All apparatus applied to a patient must have earthed power supply with the metal case well earthed. Then, when two equipment are employed with a patient, one of which takes a lead into the patient through a catheter, such as for arterial pressure measurement, then, any differential voltage that can exist between the two equipment earths will send a current through the patient's internal organs, almost through his heart.
Suppose there is a 2V differential voltage between such earth electrodes, which can occur possibly due a leak in one of the circuitry of the units, then the current that might flow in the patient would be limited only by the contact resistance which may be 1000 ohms or less. This will send 2mA current, which is dangerous.
Procedure
The mock ECG unit is just built using a simple microcontroller to generate pulses like the heart rate at about 80 per minute, which will cause a display on its LCD to show a mock ECG.
The other unit is a mock pressure transducer which shows the pulse on the LCD in a mock way, having just a lead connected into the catheter transducer attached through the toy patient kept on the mock bed.
The earth of the second unit can be made to have a potential difference with respect to the first (ECG) mock unit, by a resistor connected from the internal power supply to the case and leaving the earth connection open for it, as a means of showing a fault.
A resistor fault is introduced in the second unit by connecting a resistor between the hot lead and the earth, raising the earth potential of the unit by a certain 2-5 V. Then, a current will flow through the patient, which can be metered.
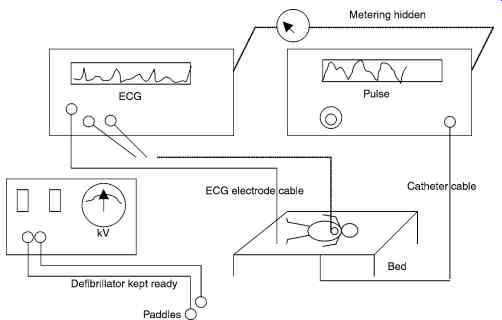
FIG. 8. Mock Microshock Demo experiment.

FIG. 9. Shows meter for earth difference current measurement and use of
read relay.
This current will be made to flow when the fault is introduced at the unit 2 by connecting the resistor as already described. Then, this current flowing through the earth leads will cause a reed relay to close. These meter and relay are kept only for the view of the experiment.
This is sensed by the unit on Unit 1 through a connection hidden within the ECG lead cable itself and makes the microcontroller to sense the same and change the ECG pattern on the LCD screen to a mock fibrillating waveform.
An alarm also sounds with a blinking light on the unit 1.
Then, the hospital assistant rushes and places the paddle defibrillator electrodes on the chest of the patient (mock).
This action of pressing the button on the paddle is also sensed by unit 1 microcontroller through another port bit. This then reverts the display back to ECG normal and the alarm ends.
Then unit 2 is suddenly removed from mains and the catheter also removed from patient to prevent a repeating of the fault.
This session is totally arranged for a mock demonstration of how a microshock can ensue and how it is averted by timely action.
Appendix
A circuit for mock ECG and pulse display with microshock alarm.
The circuit is programmed to show the mock ECG or pulse waveform in the units 1 and 2 and this is possible by using the CG RAM feature of the LCD module. The ECG and pulse are split into three patterns which, together, show the ECG and pulse. These three characters are output one by one in the LCD with shift mode, so that a continuous display is visible. Then, the reed switch closes when a current of more than the micro-shock limit flows through the mock patient.
Then, the same is sensed and the waveform changes to a random fibrillating signal on the LCD, simultaneously eliciting the sound from buzzer.
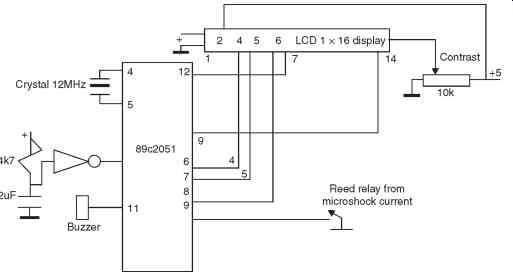
FIG. 10. Microcontroller with LCD Display Unit for 8.
Then, when the paddle switch of the defibrillator is pressed, that causes the reed relay to open and then the alarm stops, the wave reverts back to ECG from fibrillation.
Thus, an otherwise difficult event to demonstrate is made possible for mock demonstration with this microcontroller unit and LCD display, (two of which are needed) which act like mock ECG and Pulse transducer units.
Next