AMAZON multi-meters discounts AMAZON oscilloscope discounts
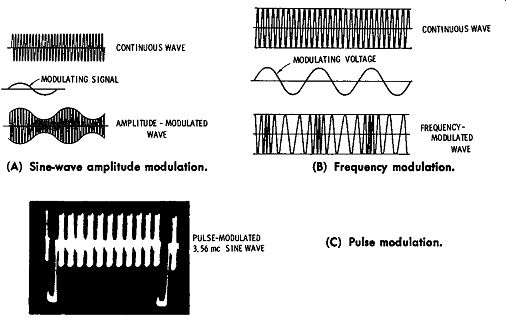
Fig. 1. Basic examples of generator signal modulation. (A) Sine-wave amplitude
modulation. (B) Frequency modulation. (C) Pulse modulation.
The most common types of generator signal modulation are sine-wave amplitude modulation and sine-wave frequency modulation. Pulse modulation is utilized in most color signal generators. An example of sine-wave amplitude modulation is depicted in Fig. 1A. The most common modulating frequency is 400 cycles; however, some generators utilize a 1-kc modulating frequency. An example of frequency modulation is seen in Fig. 1B. Most generators employ a 60-cycle sine wave modulating signal for frequency modulation. Occasion ally, a sawtooth waveform is used instead of a sine wave for frequency modulation. It has been noted that a few generators provide a choice of frequency modulation or amplitude modulation. An example of pulse modulation is shown in Fig. 1C. A color signal generator may have a single out- put waveform. On the other hand, it may provide a choice of several pulse-modulated outputs, plus a 3.58 -mHz c-w output.
SINE-WAVE AMPLITUDE MODULATION
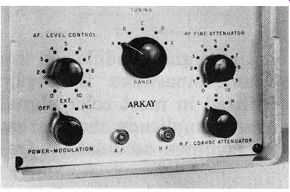
Fig. 2. The modulating signal is usually externally available.
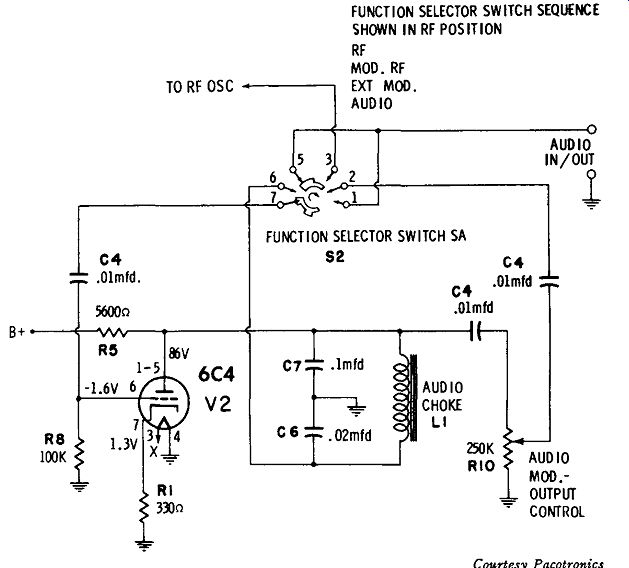
Fig. 3. Colpitts audio-oscillator circuit.
You will recall that the percentage of modulation is fixed in some generators but is adjustable in others. When the modulation percentage is adjustable, a front-panel control is pro vided, as seen in Fig. 2. Nearly all AM generators have the modulating signal accessible externally for use in audio-frequency tests. Note the AF connector in Fig. 2. The signal amplitude at this connector is adjustable by means of the AF Level Control. In other words, the level control is used to vary both the percentage of modulation, and the amplitude of the audio-frequency output signal.
The modulating signal is obtained from an audio oscillator.
A basic requirement is the generation of a good sine wave.
In the past, tickler-feedback audio oscillators were used extensively. The oscillator transformer carried grid, plate, and output windings. It is comparatively difficult to design this type of oscillator for a good sine-wave output. Hence, the present-day trend is to other oscillator configurations, such as the Colpitts circuit. A typical arrangement is shown in Fig. 3. The oscillating frequency is determined by the inductance of L1 and the capacitance values of C6 and C7. These values are chosen for a nominal resonant frequency of 400 cycles.
The percentage of modulation or the amplitude of audio output voltage is varied by R10. The output from the oscillator is coupled to the r-f oscillator ( or to the audio-output connector) by C4. If the oscillator is lightly loaded, adjustment of R10 does not change the oscillator frequency appreciably. Even under heavy-load applications, a small change in oscillator frequency can usually be disregarded. Note that iron core inductors operate as nonlinear components unless the magnetic flux variation is kept well below the saturation region (Fig. 4). The Colpitts circuit is advantageous in this regard, because the DC plate current does not flow through the coil. Furthermore, by operating the oscillator at a comparatively low power level, the AC current flow through the coil is kept well below the core-saturation region. In turn, a good sine wave is generated.
The amount of feedback voltage (and hence the oscillator power level) is determined by the capacitance ratio of C6 and C7. In other words, the two capacitors form an AC voltage divider. Thus, the AC voltage drop across C6 is applied to the grid of V2. Since L1 is not a pure inductance but also has resistance, the ratio of C6 to C7 also affects the phase of the AC voltage fed to the grid. Oscillation cannot occur unless there is sufficient in-phase voltage fed back to cancel out the losses in the circuit. Hence, the oscillation level depends on both the amplitude of the feed-back voltage and also on its phase.
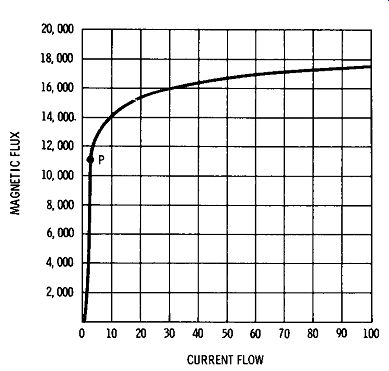
Fig. 4. Good sine-wave output requires that the operating range not extend
past P on the Iron-core curve.
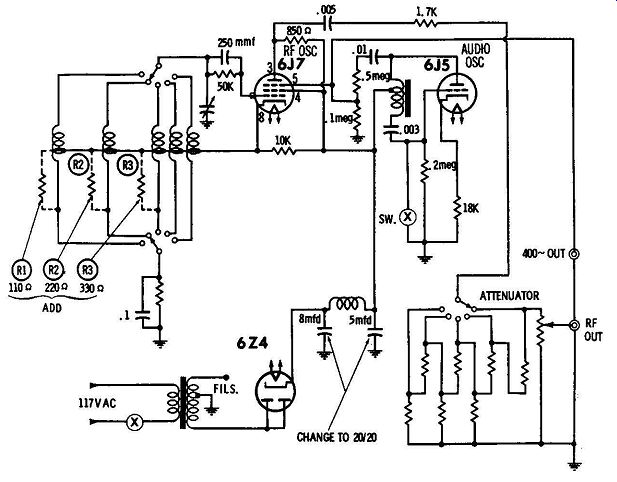
Fig. 5. Signal generator using basic Hartley oscillator circuits. (A) Circuit
diagram. (8) R-f waveform. (C) Modulated r-f waveform.
A good amplitude-modulated waveform (Fig. 1A) requires not only that the audio oscillator produce good sine waves, but also that the r-f oscillator produce good sine waves.
In other words, if the r-f oscillator generates a highly distorted waveform, it is impossible to symmetrically modulate the distorted waveform with a sine-wave signal. This principle is often confusing to the beginner-he finds it difficult to understand why the modulated r-f output might have a poor waveform although the modulating voltage has a good sine wave. It is easy to check both the r-f waveform and the a-f waveform with a wide-band scope. However, it is not al ways easy to pinpoint the circuit defect which is causing distortion.
For example, consider the circuit shown in Fig. 5. This is an older type of signal generator, which utilizes basic Hartley oscillator circuits. In this case, the audio oscillator produced an acceptable sine-wave output. On the other hand, the r-f waveform was highly distorted on the lower frequency bands-from 100 kHz to 3 mHz. Instead of displaying a sinusoidal r-f waveform, the r-f oscillator produced a clipped positive half-cycle and a highly peaked negative half-cycle. The electron-coupled output circuit responds to the plate-current flow in the oscillator tube, not to the voltage waveform across the tank circuit. Excessive feedback causes the tube to cut off over part of the cycle, thus clipping the output waveform.
There are two methods of reducing feedback and avoiding grid overdrive. First, the tap point on the tank coil can be placed nearer ground. If a progressive-wound coil is present, a change in the tap point can impose a mechanical problem.
Hence, the second method of feedback reduction may be more practical. If a resistor is shunted across the feedback coil (R1, R2, R3 in Fig. 5A), a portion of the feedback energy is dissipated as PR loss in the resistance. In turn, the grid drive is reduced, the plate current is no longer cut off, and an acceptable sine wave results, as seen in Fig. 6A. When modulation is applied (Fig. 6B), the modulated r-f waveform displays considerably better symmetry.
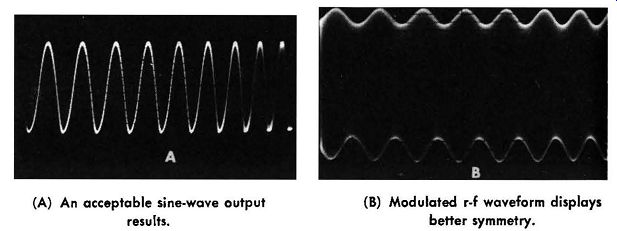
Fig. 6. Effects of feedback reduction. (A) An acceptable sine-wave output
results. (B) Modulated r-f waveform displays better symmetry.
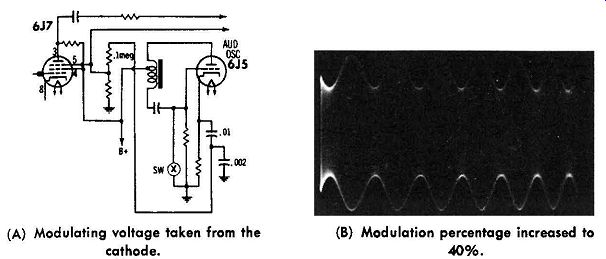
Fig. 7. Increasing the percentage of modulation. (A) Modulating voltage
taken from the cathode. (B) Modulation percentage increased to 40%.
This improved waveform is more desirable for almost any practical application. Elimination of excessive harmonic out put also eliminates spurious responses from a receiver under test. Why do strong harmonics produce spurious responses? It is because the oscillator in a receiver has harmonics. When a generator harmonic beats against a receiver-oscillator harmonic, and the beat frequency happens to fall in the i-f band of the receiver, it appears as a spurious response, or "birdie." It may also be asked why symmetrical modulation is desirable.
If the modulation envelope is highly unsymmetrical, as in Fig. 5C, one receiver can seem to be much more sensitive than another. If the receiver happens to detect along the top of the modulated waveform in Fig. 5C, the output will be comparatively weak. On the other hand, if a receiver happens to detect along the bottom of the modulated waveform, the output will be comparatively strong.
Although the modulation envelope in Fig. 6B has an acceptable shape, the percentage modulation is less than standard. Specifications for receiver testing usually call for 30% modulation. However, the waveform illustrated in Fig. 6B has approximately 20% modulation. It is necessary to apply increased modulating voltage to the r-f oscillator to increase the percentage of modulation. In this case, an easy method consisted of taking the modulating voltage from the cathode of the audio oscillator instead of the plate. The circuit modification is shown in Fig. 7. This change resulted in 40% modulation, using a 0.01-mfd and 0.002-mfd capacitor in a voltage divider arrangement.
In some cases the modulation envelope may be distorted by hum voltage. Assuming that the tubes do not have heater-cathode leakage, this symptom points to excessive B+ ripple voltage. In this generator, the ripple was reduced to a negligible value by increasing the filter capacitance, as indicated in Fig. 5. Thus, if you know your signal generator, it is possible to analyze a distorted output and pinpoint the circuit defects.
MAXIMUM RF OUTPUT
Technicians sometimes ask how the maximum output from a signal generator can be increased. One method is to increase the plate and screen voltages at the r-f oscillator. For ex ample, a typical generator utilizes a 6AU6 tube with 100 volts at the plate and 105 volts at the screen. The half-wave power supply in the generator provides 110 volts. If an additional rectifier and filter capacitor are used to form a voltage-doubler power supply, the output voltage is approximately doubled. Moreover, if a filter choke is used instead of a resistor, the output voltage is more than doubled. Since a 6AU6 is rated for operation up to 330 volts at plate and screen, the tube is still well within its maximum power dissipation. The maximum r-f output, in turn, is approximately doubled.
As would be anticipated, the audio-modulating voltage must also be increased to maintain the original percentage of modulation. This is no problem if the percentage modulation is adjustable, as in Fig. 3; the control is merely advanced as required. On the other hand, if the generator has a fixed percentage of modulation, as in Fig. 5, the coupling circuit between the audio oscillator and r-f oscillator must be changed to apply more signal voltage to the suppressor grid. For example, the 0.002-mfd capacitor can be reduced in value, or the 0.1-megohm resistor can be reduced in value.
There are two "side effects" to be considered when the signal output level is increased. First, the r-f oscillator tube runs hotter, and frequency drift may increase. A longer warm-up period is likely to be required before the generator stabilizes.
There is also the problem of minimum output level attainable.
Simple generator arrangements, such as shown in Fig. 5, have appreciable r-f leakage. If you double the maximum avail able output voltage, the minimum output level will also be approximately doubled. Hence, you must weigh the "side effects" against the desirability of increased output.
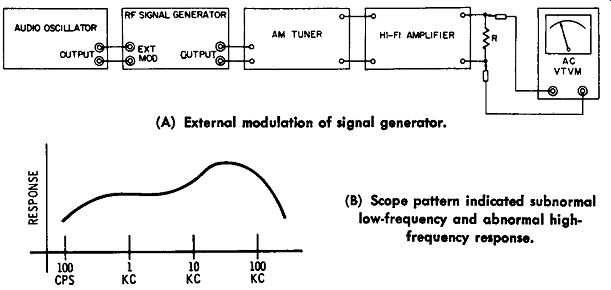
Fig. 8. Audio oscillator used for external modulation. (A) External modulation
of signal generator. (B) Scope pattern indicated subnormal low-frequency
and abnormal high frequency response.
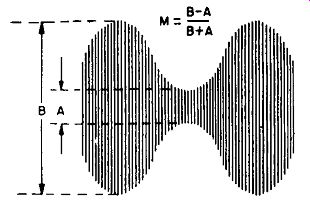
Fig. 9. Percent of modulation.
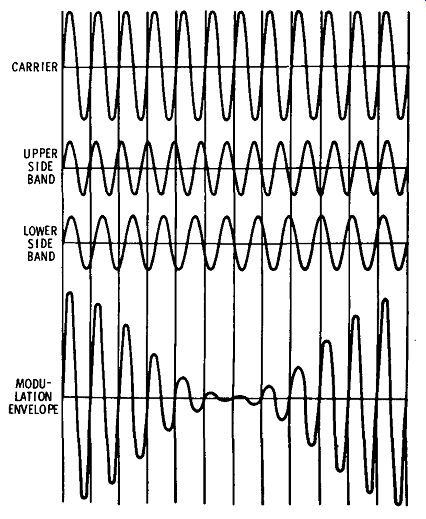
Fig. 10. Modulation of signal-generator carrier produces sidebands.
VARIABLE MODULATING FREQUENCY
Technicians who work with hi-fi systems need to check frequency response over the entire audio-frequency range. Hence, an audio oscillator is used for external modulation of the signal generator, as shown in Fig. 8. When external modulation is used, the signal generator is switched to "Ext. Mod." (see Fig. 3). In turn, fixed-frequency oscillator V2 is disabled; the audio-oscillator signal is fed to the r-f oscillator for modulation of the carrier. You must adjust the output level of the audio oscillator to provide 30% modulation, in accordance with receiver test standards. This is done by connecting a wide-band scope at the output of the r-f signal generator depicted in Fig. 8. The pattern on the scope screen appears as seen in Fig. 9, and the percentage of modulation is calculated as noted in the diagram.
The frequency response of the system (Fig. 8) is then plotted over the entire audio-frequency range. If the frequency response is not flat, as exemplified in Fig. 8B, the trouble may be localized to the AM tuner, to the hi-fi amplifier, or possibly to both. Note load resistor R in Fig. 8A; unless the hi-fi amplifier is normally loaded, its frequency response will be impaired. Remember that the frequency response might be different at 550 khz, 1 mHz, and 1.5 mHz on the AM tuner dial. Hence, check the response at these three carrier frequencies.
If hi-fi (flat) response is not obtained at all three carrier frequencies, the alignment of the AM tuner must be investigated.
External modulation, as depicted in Fig. 8, requires uniform (flat) output from the audio oscillator over the entire audio-frequency range. Only high-quality audio oscillators pro vide a satisfactorily flat output. However, you can use an ordinary audio oscillator if you monitor the output and adjust the level control when you change frequency. Simply connect a scope across the audio-oscillator output terminals in Fig. 8. Choose a convenient reference level and then maintain this value of vertical deflection at each audio-frequency set ting in the test procedure.
Why does the alignment of the AM tuner in Fig. 8 affect the audio-frequency response of the system? It is because modulation of the carrier in the signal generator produces sidebands, as shown in Fig. 10. The upper sideband has a higher frequency than the carrier, and the lower sideband has a lower frequency than the carrier. If the AM tuner is mis aligned, the sideband signals are distorted with respect to the carrier. In turn, the test waveform at the second detector in the AM tuner is also distorted. Subnormal sideband response causes poor high-frequency response. On the other hand, abnormal sideband response (excessive double-humped curve) causes poor low-frequency response. These relations are shown in Fig. 11.
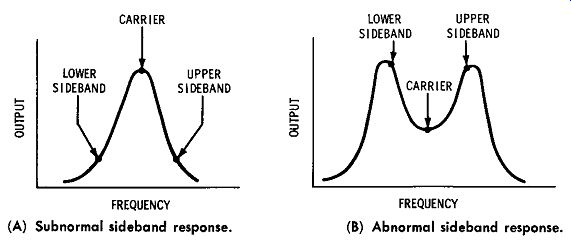
Fig. 11. Effects of sideband response on a response curve. (A) Subnormal
sideband response. (B) Abnormal sideband response.
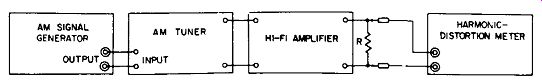
Fig. 12. Signal generator provides a check of harmonic distortion.
HARMONIC DISTORTION
Technicians who work with hi-fi systems are also concerned with harmonic distortion. A basic test setup is shown in Fig. 12. The total percentage of harmonic distortion is read on the harmonic-distortion meter. This test requires that the signal generator provide a good modulated waveshape. Other wise, a deficiency in the signal generator would be falsely charged to the AM tuner or to the hi-fi amplifier. A rough test of the generator waveform can be made by applying the 400-cycle output from the signal generator directly to the harmonic-distortion meter. If a low reading is obtained, you know that the modulating waveform of the signal generator is satisfactory. A wide-band scope can be used next to check the modulated r-f waveform (Fig. 7B). If visible distortion does not appear in the scope pattern, the signal generator can be used with reasonable confidence in harmonic-distortion tests.
Since most signal generators provide only a 400-cycle modulating frequency, external modulation must often be utilized to check harmonic distortion over the entire audio-frequency range. The test setup is shown in Fig. 13. A meaningful test requires that the audio oscillator have a good sine-wave out put, and that the signal generator is modulated without substantial distortion. You can check the audio oscillator by applying its output directly to the harmonic-distortion meter.
If the meter reading is low, the audio oscillator will be satisfactory. Next, connect the audio oscillator to the external modulation terminals of the signal generator. Check the modulated r-f output from the signal generator with a wide-band scope. As before, if visible distortion does not appear in the scope pattern, the signal generator can be used with reason able confidence.
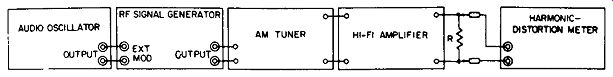
Fig. 13. Signal generator externally modulated by an audio oscillator.
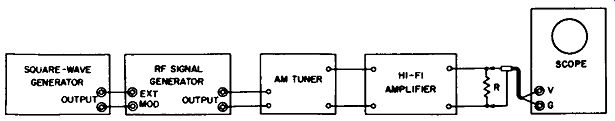
Fig. 14. Square-wave modulation of the signal generator.
SQUARE-WAVE MODULATION OF SIGNAL GENERATOR
Square-wave tests of hi-fi systems have become increasingly popular. A square-wave test will disclose transient distortion, which is missed in sine-wave tests. A suitable test setup is depicted in Fig. 14. Note that square-wave modulation of a signal generator is comparatively free from difficulties. The reason for this is that the modulation is simply an off-on sequence. However, there are certain practical points to consider:
1. The square-wave generator must have good waveform, and a sufficiently fast rise time.
2. The oscilloscope used as an indicator must have good square-wave response.
3. Neither the AM tuner nor the hi-fi amplifier should be overloaded.
You can connect the output from the square-wave generator directly to the scope to determine whether the generator and the scope have satisfactory characteristics. Next, connect the output from the square-wave generator to the external-modulation terminals of the signal generator, and check the modulated r-f waveform with the scope. Advance the level of the square-wave signal for 100% modulation of the carrier. You are now prepared to make a test of transient response with the signal generator, as shown in Fig. 14. Typical square-wave distortions are illustrated in Fig. 15. Some photos of serious system distortion are seen in Fig. 16.
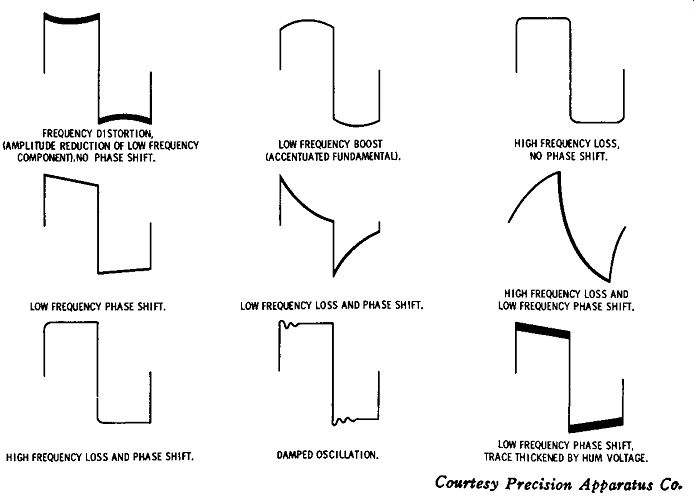
Fig. 15. Typical square-wave distortions.
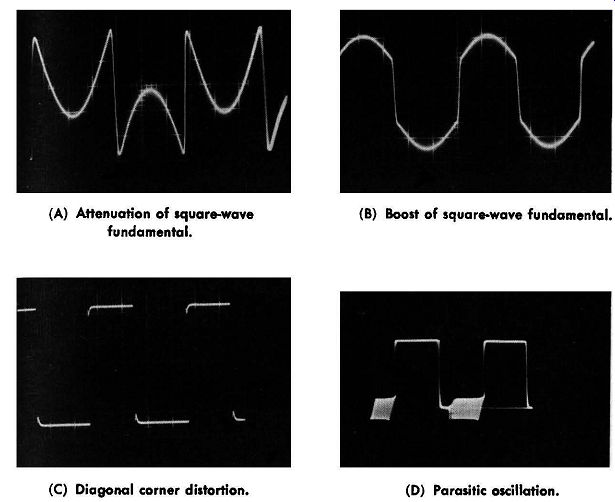
Fig. 16. Examples of serious system distortion. (A) Attenuation of square-wave
fundamental. (C) Diagonal corner distortion. (B) Boost of square-wave fundamental.
(D) Parasitic oscillation.
Evidently, square-wave modulation is a special case of pulse modulation in which the "off" time is equal to the "on" time.
If you use a pulse generator for external modulation of the signal generator, essentially the same test information is obtained. The only difference is that a pulse has stronger harmonics than a square wave. In turn, a pulse test at a low repetition rate is equivalent to a square-wave test at a low repetition rate plus another square-wave test at a high repetition rate.
Color signal generators have built-in pulse-modulation facilities and supply an output waveform such as illustrated in Fig. 1C. Since this type of signal is used only to check the performance of color-TV receivers, a detailed explanation of color signal generators is not included in this guide. Interested readers may refer to texts such as Know Your Color-TV Test Equipment, published by Howard W. Sams & Co., Inc.
FREQUENCY MODULATION OF SIGNAL GENERATORS
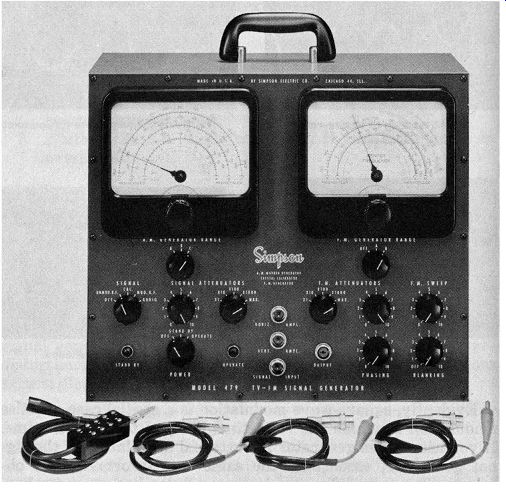
Fig. 17. Typical fm/ am generator.
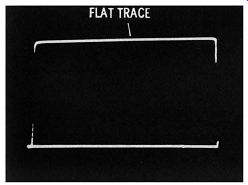
Fig. 18. A good output waveform from an FM generator.
Frequency-modulated generators (commonly called sweep generators) are in wide use. Many FM generators are combined with AM generators, as illustrated in Fig. 17. A crystal oscillator is usually provided for calibration of the AM generator. When designed for TV application, such combination generators provide frequency coverage only from 4 mHz to 250 mHz in most cases. Hence, you cannot use the AM generator to test AM broadcast receivers. However, many of these combination generators can be used to test FM broad cast receivers.
The chief requirement for an FM generator is that it provide a uniform output over the swept band. You can easily check this characteristic by feeding the output from the FM generator to a scope via an ordinary demodulator probe. If the generator has a flat output, the waveform shown in Fig. 18 will be displayed on the scope screen. Why is a flat out put important? If the generator has "hills" and "valleys" in its frequency output, generator deficiencies will be falsely charged to the receiver under test. The most common causes of nonuniform output are defective tubes or faulty capacitors in the generator. Filter capacitors are prime suspects, because power-supply ripple can modulate the FM oscillator.
Fig. 19 shows the circuit configuration for a typical FM generator. The tank circuit of the FM oscillator contains coils with ferrous cores. (Refer to Fig. 4.) The curve for the core characteristic shows that the magnetic flux is nonlinear with respect to substantial current flow. This is just another way of saying that the inductance of the coil becomes less when current flow is heavy. Or, the resonant frequency of the FM oscillator in Fig. 19 can be varied by changing the total current flow. This change occurs at a 60-cycle rate, and the amount of frequency swing (deviation) is determined by the setting of R3, which is called the sweep-width control.
Note that the swept trace appears above a baseline in Fig. 18.
The base line represents zero signal output from the FM generator. In other words, the FM oscillator is "on" for 1/120 second, and is "off" during the next 1/120 second. This keying of the oscillator is accomplished by means of a 60-cycle square wave. A clipper tube (V3) is used to change the 60 cycle supply voltage into a 60-cycle square wave. This square wave voltage is applied as grid bias to the FM oscillator tube (V1). In turn, the tube is keyed off and on at 1/120-cycle intervals.
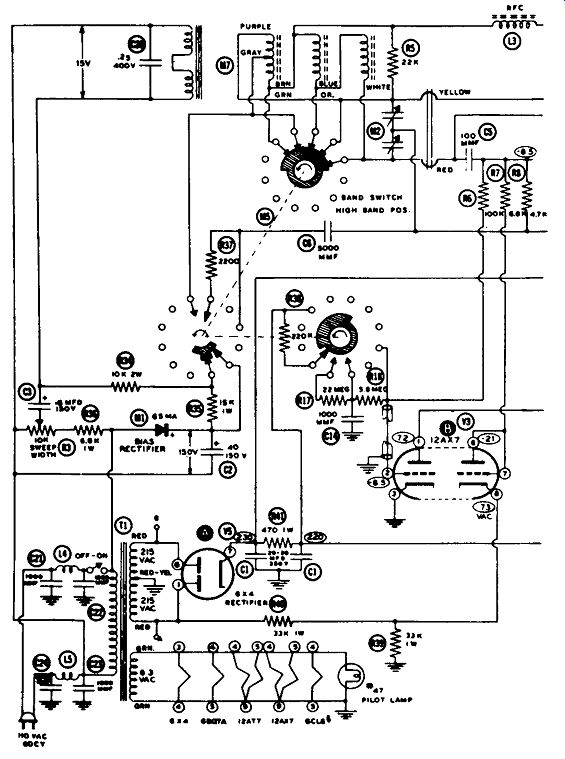
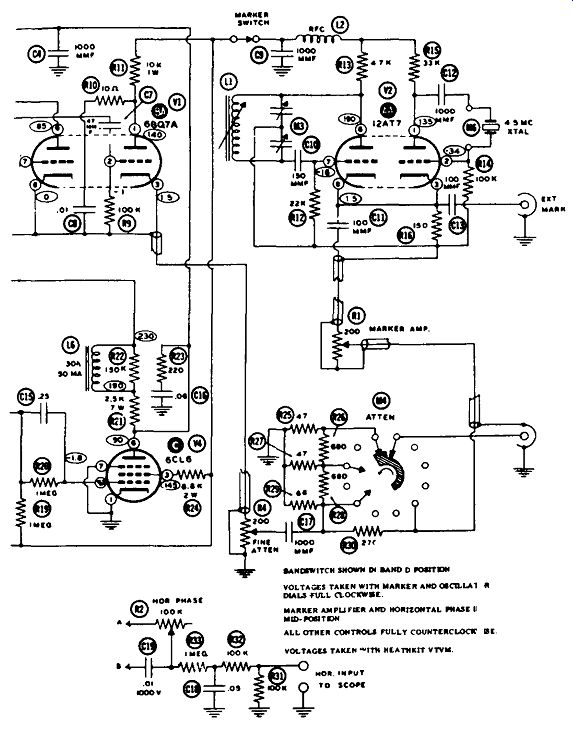
Fig. 19. Typical FM generator with built-In marker generator and crystal
oscillator.
As in an AM generator, several oscillator coils are used in an FM generator to cover the total frequency range (3.6 to 220 mHz ) in several bands. Thus, the permeability-swept unit, M7 in Fig. 19, comprises three oscillator coils. On the other hand, marker generator V2 has only one oscillator coil. Tuning capacitor M3 provides a fundamental marker range from 19 to 60 mHz. Second and third harmonics are used to mark frequencies from 60 to 180 mHz. The 4.5-mHz crystal oscillator serves to calibrate the marker generator; its output can also be used to mark intercarrier sound curves.
There are other methods in addition to permeability tuning in common use to frequency-modulate the output from a generator. For example, the oscillator coil may be shunted by a vibrating capacitor. One plate of the capacitor moves back and forth at a 60-cycle rate. In turn, the oscillator output is frequency-modulated in the same manner as previously described. Standard signal generators that provide a choice of AM output or narrow-band FM output often use a reactance tube to frequency-modulate the oscillator tube. Like permeability-sweep arrangements, reactance-tube sweep circuits are preferred to vibrating-capacitor systems because of their immunity to mechanical failure.
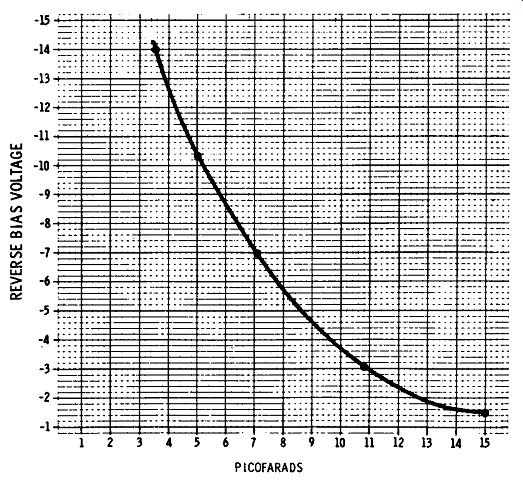
Fig. 20. Junction capacitance of a semiconductor diode vs. bias voltage.
The newest type of frequency modulator consists of a semi conductor diode unit which operates as an electronic capacitor.
When a junction diode is reverse-biased, it has a terminal capacitance that varies in value with the applied voltage. Fig. 20 shows the capacitance characteristic for a typical diode.
Its capacitance changes from .15 pf to 3.5 pf when the reverse bias varies over a range of 13 volts. Hence, the diode may be used to tune an oscillator coil. If a 60-cycle bias voltage is applied to the diode, the oscillator becomes frequency-modulated. Thus, a semiconductor diode is the solid-state equivalent of a reactance tube.
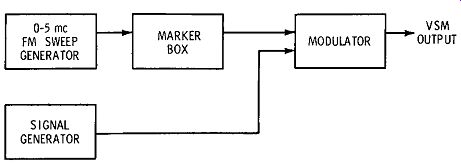
Fig. 21. Generation of a VSM signal.
VIDEO SWEEP MODULATION
Video sweep modulation refers to the modulation of a video frequency sweep signal on an r-f carrier. In other words, an FM signal is amplitude-modulated on an r-f carrier. A semiconductor-diode modulator is used, with a test setup such as depicted in Fig. 21. This type of signal is used chiefly to check the overall frequency response of color-TV receivers, although it can also be used to check the overall response of black and white receivers. Note that the r-f output signal (VSM output) in Fig. 21 includes the picture carrier and two sidebands. The sideband frequencies vary in accordance with the sweep signal from the FM generator. This VSM out put signal is fed to the antenna terminals of the TV receiver under test. In the case of a color receiver, the frequency response of the r-f tuner, i-f amplifier, video amplifier, chroma bandpass amplifier, and chroma demodulators may be checked on a scope screen.
The VSM method of checking alignment is necessary to accurately determine the overall frequency response from the receiver's antenna terminals to the picture tube. In step-by step alignment procedure, this cannot be done with any degree of accuracy because estimation is involved. Thus, in ordinary procedure, an r-f sweep generator is used to check the frequency response of r-f and i-f amplifiers, and a video-frequency sweep generator is used to check the response of the video amplifier and the chroma bandpass amplifier. Thus, in conventional alignment procedure the operator can only estimate the overall response. Furthermore, the effect of the picture-detector circuit, which changes the overall response more or less, cannot be observed on either the i-f or video-amplifier response curves.
On the other hand, when a VSM signal is applied to the receiver, a scope connected at the picture tube displays the actual and complete overall frequency-response curve including the effect of the picture detector. This method is particularly important in the alignment of color-TV receivers in which the i-f and video-frequency sections individually do not have a flat response over their passband. In other words, in many modern color receivers, the response of the i-f and video frequency sections are complementary. Thus, the first video amplifier stage might have a rising frequency response which compensates for the falling frequency response of the i-f amplifier. In these receivers, the color subcarrier is normally placed at the 50% response point on the i-f curve. However, a correctly adjusted video amplifier or bandpass amplifier complements this i-f response and gives a flat overall i-f video curve.
Note in Fig. 21 that the output from the marker box is applied to the modulator. These are absorption markers. Hence, the output from the modulator consists of both the FM signal and "dip" markers modulated on the r-f carrier.
In turn, the if-video curve displayed on a scope screen has absorption markers, as illustrated in Fig. 22A. How are absorption markers generated?
This is accomplished by shunting series traps across the circuit, as seen in Fig. 22B. The number of traps utilized depends on how many marker frequencies are to be displayed. The value of the series capacitor (1.5 to 15 pf) not only tunes the trap coil to the desired marker frequency, but it also determines the depth of the "dip." Hence, we set the capacitor to obtain the desired depth of the absorption marker, and then tune the trap to the correct frequency by means of the slug adjustment. An individual absorption marker is identified in the scope pattern by touching one of the test terminals, such as T1, T2, or T3. Hand capacitance makes the absorption marker shift on the pattern, and also reduces its depth. Therefore, it is easy to identify a chosen absorption-marker frequency in the pattern.
Fig. 23 is a photo of a bandpass-amplifier response curve with absorption markers. Each "dip" represents a certain reference frequency. The operator touches one of the test terminals on the marker box. In turn, the corresponding "dip" shifts on the curve. However, the other "dips" remain fixed in position. Accordingly, the reference frequency is identified. Absorption markers are most useful on the top of a curve. It is difficult to see an absorption marker near the base line. An absorption marker disappears completely in a trap.
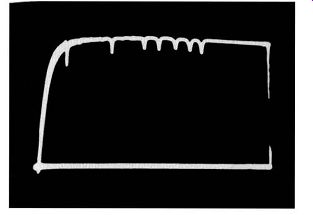
Fig. 22. Output of marker box is applied to the modulator. (A) Resulting
pattern as seen on a scope. (B) Series traps generate the absorption markers.
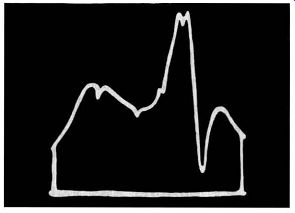
Fig 23. Bandpass-amplifier response curve with absorption markers.
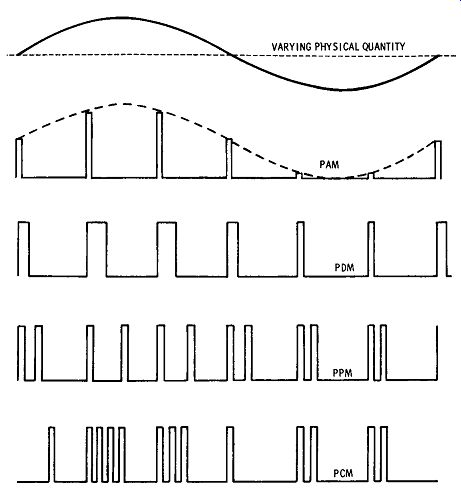
Fig. 24. Specialized types of pulse modulation.
SPECIALIZED TYPES OF PULSE MODULATION
Signal generators designed for testing telemetry receivers employ specialized types of pulse modulation, as noted previously. Some of the basic modulation waveforms are depicted in Fig. 24. In pulse-amplitude modulation (PAM) the height of the modulating pulses is varied. Again, in pulse duration modulation (PDM), the height of the modulating pulses is constant, but the pulse width varies. Another type of pulse modulation is called pulse-position modulation (PPM), in which the pulses occur at varying times. Still another type of pulse modulation, called pulse-code modulation (PCM), is based on a code for each element of information, comprising pulses and spaces.
When pulse amplitude-modulated r-f signals are fed into an integrating circuit, the output reproduces the original waveform-this is a sine wave in Fig. 24. To decode PDM, PPM, or PCM generator signals, comparatively complex circuitry is required. Examples of receiver circuitry are explained in specialized tests, such as Pulse Circuit Technology, published by Howard W. Sams & Co., Inc. Why are these special types of modulation used in telemetry systems? It is because more efficient use can be made of the communications channel. Moreover, a pulse-code modulated signal can be fed directly into an electronic computer for automatic processing.
Also see: