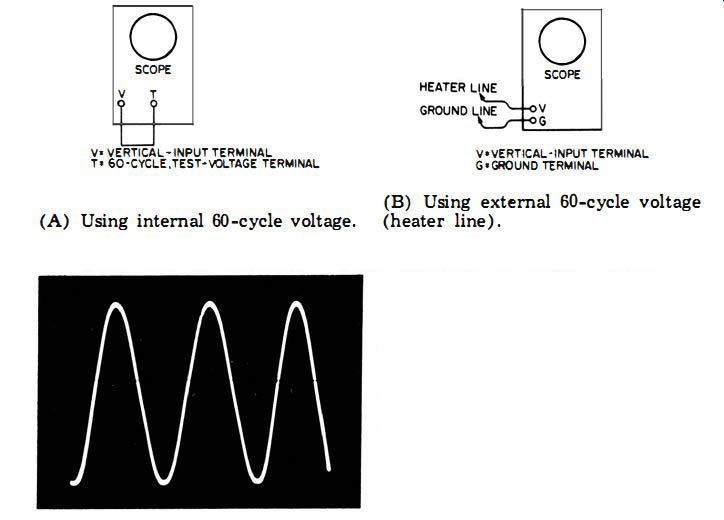
To Display a 60-Cycle Sine Wave on the Scope Screen
Equipment: None, if scope has a 60-cycle, test-voltage terminal on the front panel. If not, use a convenient voltage source, such as a heater line from a TV chassis.
Connections: Run a test lead from the 60-cycle, test-voltage terminal on the scope panel to the vertical-input terminal of the scope. (If external 60-cycle source is used, connect a test lead from the source to the vertical-input terminal of the scope. Also, connect a test lead from the ground point of the source to the ground terminal of the scope.)
Procedure: Set the scope controls for sawtooth horizontal sweep at a rate from 15 to 60 cycles. Set intensity and focus controls for moderate brightness and good focus. Set vertical gain controls for approximately 1/2 or 1/3 full-screen deflection.
Adjust horizontal-gain control for about 1/2 to 1/3 full-screen deflection. Adjust synchronizing controls to lock pattern on screen. (Effect of control settings is illustrated on following pages. )
Evaluation of Results: The pattern should be linear (undistorted) , both vertically and horizontally.
----------
--------
(B) Using external 60-cycle voltage (A) Using internal 60-cycle voltage. (heater line) . Connections for viewing a 60-cycle waveform on a scope screen.
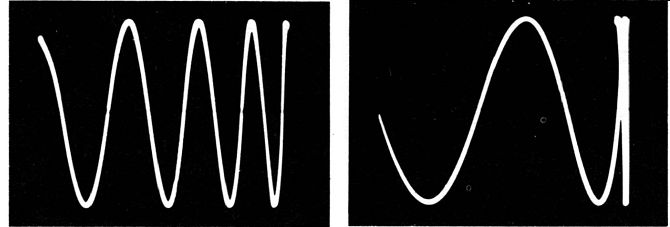
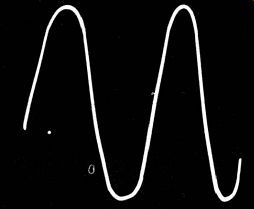
Waveform when a 60-cycle sine wave is viewed at a horizontal sweep rate of 20 -hz. Three cycles are displayed.
NOTE : A portion of one cycle is lost on retrace.
NOTE 1
Zero Settings of Scope Gain Controls
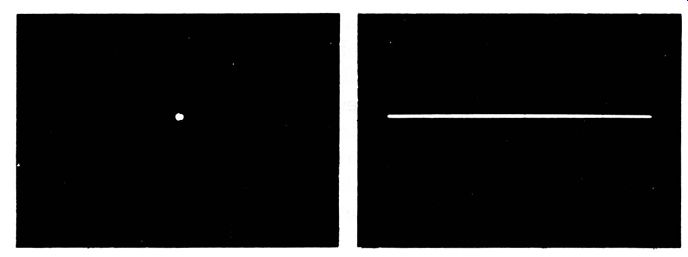
------- Both horizontal and vertical gain controls set to zero.
Horizontal gain advanced; vertical gain zero.
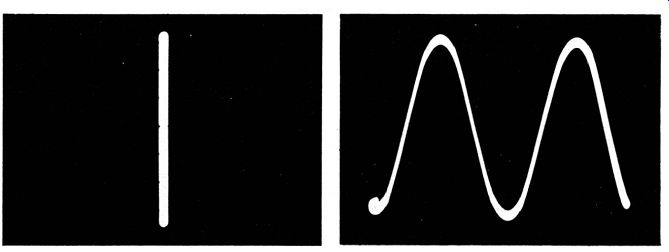
--------- Vertical gain advanced; horizontal gain zero.
Both vertical and horizontal gain controls advanced.
NOTE 2
Checking the Operation of the Vertical Gain Controls
-------- Vertical gain control set too low. Vertical gain control set
too high.
Vertical step attenuator set too high; vernier vertical gain control set too low. Vertical-input stage is overloaded and sine wave is clipped.
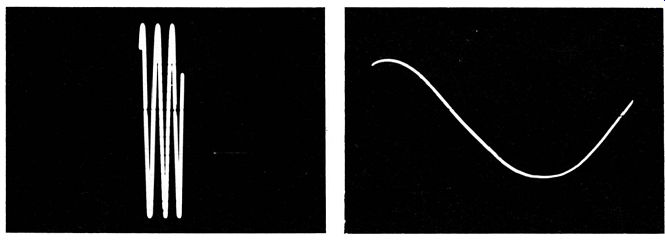
NOTE 3 Checking the Operation of the Centering Controls
------ Vertical centering control set too low. Vertical centering control set too high.
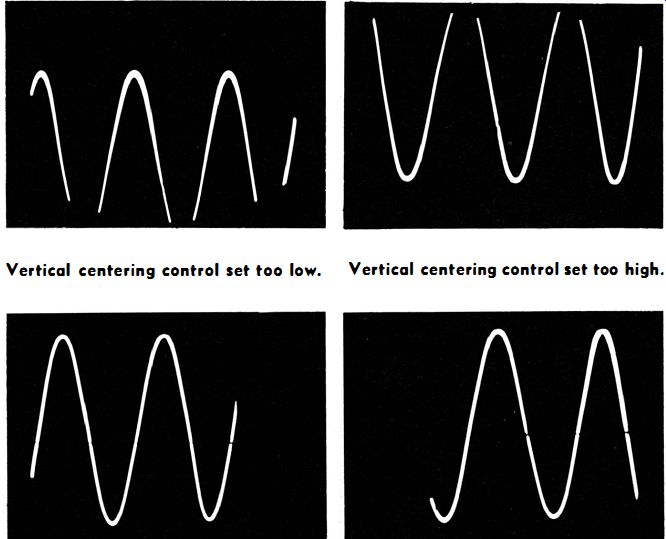
------ Horizontal centering control set too far left. Horizontal centering
control set too far right.
NOTE 4 Checking the Operation of the Horizontal Gain Control
----- Horizontal gain control set too low. Horizontal gain control
set too high.
NOTE 5
Checking the Operation of the Horizontal Sweep-Rate Control
---- Horizontal sweep rate slightly high. Less than one cycle displayed.
--- Horizontal sweep rate set much too high.
NOTE 6
Checking the Operation of the Sync Amplitude Control
------ Sync amplitude control set too high. Multiple triggering of the
sweep oscillator occurs. ---- Sync amplitude control set too low. Pattern
runs rapidly on screen and does not lock.
NOTE 7
Stray Field Pickup
A sine-wave pattern can al so be displayed by leaving the vertical input leads of the scope lying open on the bench. A dist or ted sine wave appears on the scope screen. This is a display of the stray 60-cycle fie ld. Because the vertical-input circuit of the scope has a very high impedance, fie ld. A stray field is a high-impedance voltage source. The sine-wave pattern is distorted because the open test leads are co up led via a very small stray capacitance to the power wiring of the bench. A capacitance has lower impedance at higher frequencies . Hence, the wave for m are exaggerated. These harmonics show up as kinks in the waveform. If the vertical-input leads of the scope are connected across a 100K- resistor, stray field pattern disappears, cause the input impedance of the scope is then lowered to 100, ohms.
low to couple effectively in to the high-impedance,
----------- Stray-field pattern obtained with test leads lying open on
bench.
NOTE 8
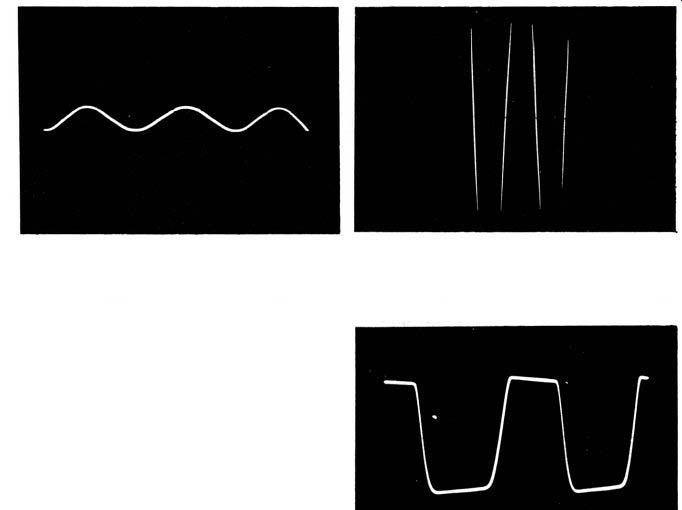
Recognition of Horizontal Nonlinearity
------- Sine wave cramped at right. Sine wave folded over at right.
NOTE 9
Recognition of Vertical Nonlinearity
-------- Sine wave compressed at top and bottom.
NOTE 10 Recognition of Vertical and Horizontal Nonlinearity
------ Sine wave compressed at top and bottom, and at right side.
NOTE 11
Recognition of Hum Modulation on Scope Trace
----- Hum modulation of beam at normal brightness setting.
------ Hum modulation of beam at high brightness setting.
------ 60-cycle hum modulation seen in display of 60-cycle sine wave.
60-cycle hum modulation seen in an overloaded 60-cycle, sine-wave display. (Overloading due to setting step vertical-gain control too high and continuous vertical-gain control too low.)
NOTE 12
Recognition of Faulty Retrace Blanking
---- Retrace blanking ineffective; retrace plainly visible.
Retrace blanking pulse distorted, causing bright spot at end of pattern.
---- Retrace blanking pulse distorted; appearance of fault
without sine-wave pattern (base line only).
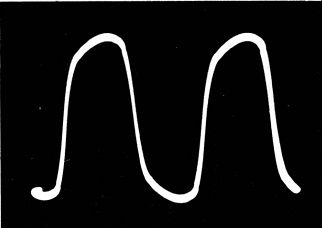
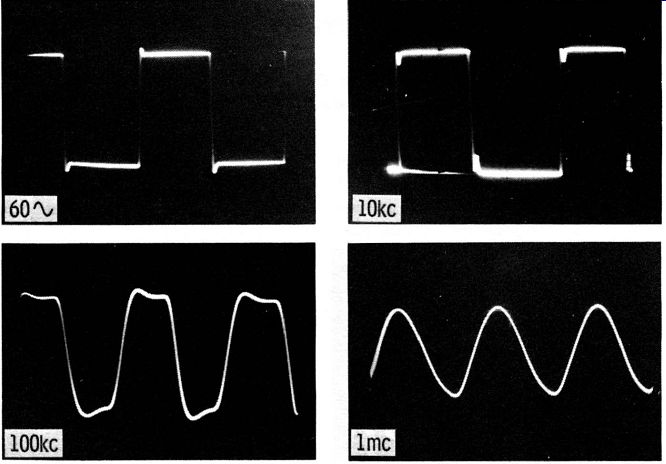
To Display a Square-Wave Pattern on the Scope Screen
Equipment: Square-wave generator.
Connections Required: Connect the output cable from the square-wave generator to the vertical-input terminals of the scope.
Procedure: Adjust instrument controls for a suitable square wave pattern.
Evaluation of Results: Within a certain range of square-wave frequencies (using a good generator) , the scope should reproduce a good square waveform. At very low and very high square-wave frequencies, the vertical amplifier will reproduce a distorted square wave.
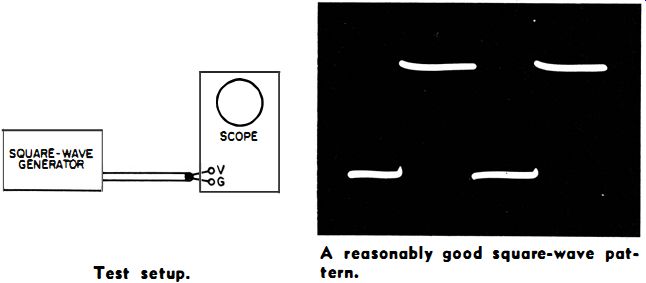
------ Test setup. ----- A reasonably good square-wave pattern.
NOTE 13
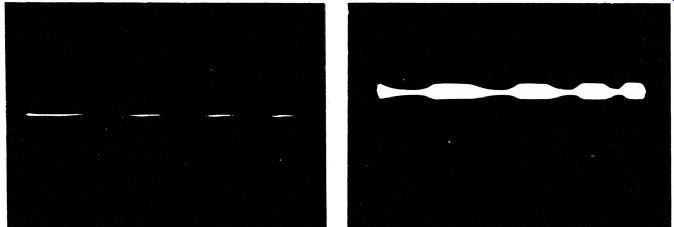
Typical Square-Wave Distortions Produced by Inadequate Vertical Amplifier of Service Scope
The following photos show typical distortions in reproductions of square-wave frequencies from 50 -hz to 100 -khz, caused by an inadequately compensated vertical amplifier. Although these scope distortions can be taken into account when making equipment checks, such procedure is somewhat difficult and not generally recommended.
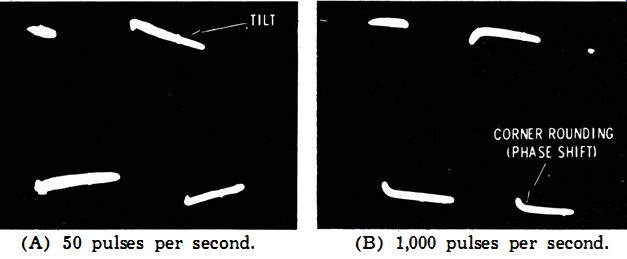
------ (A) 50 pulses per second. (B) 1,000 pulses per second.
-------- (C) 10000 pulses per second. (D) 100,00 pulses per second.
Typical square-wave distortions.
NOTE 14
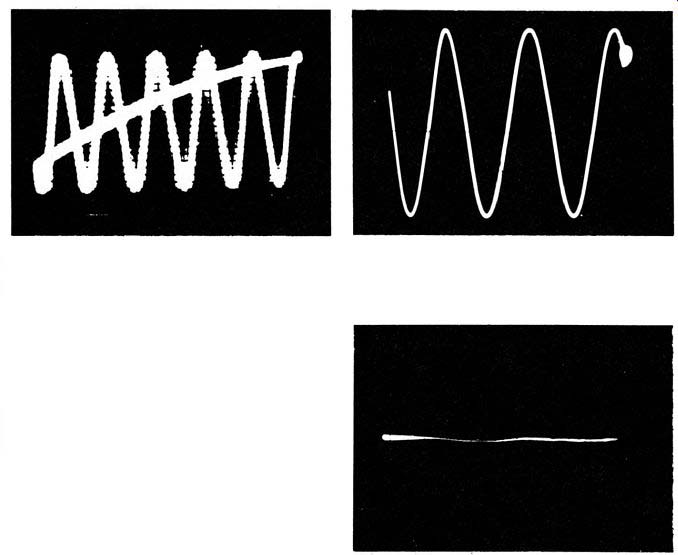
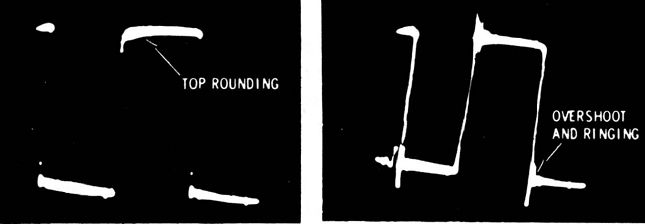
Typical Square-Wave Patterns Produced by Scopes
The following photos show typical reproductions of square waves from scopes of varying capabilities-a 100 -khz (narrow band) , a 4-mhz (wide band) , and a 15-mhz (laboratory) instrument. Waveforms at four different frequencies are shown. There is some tilt at low frequencies and noticeable ringing at high frequencies in the 4-mhz scope response. Note that scopes which are quite free from square-wave distortion are relatively high priced.
------ (A) Response of a service-type 100-khz scope.
------ (B) Response of a service- type 4-mhz scope .
----- (C) Response of a lab-type 15-mhz scope.
Square-wave response of three different oscilloscopes.
NOTE
Effect on Shape of Square Waveform When Sweep Rate of Scope Is Varied
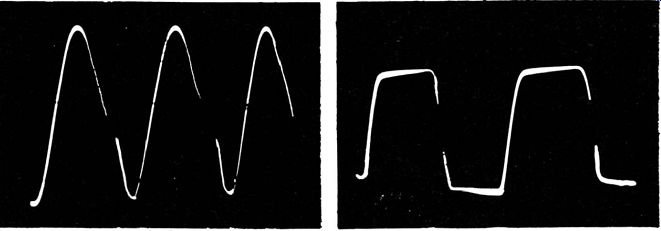
Beginners sometimes suppose that a square-wave generator can be used as a pulse generator by adjusting the scope controls to display a number of square-wave cycles. Of course, this is not so. The square-wave voltage remains the same in shape, regardless of its aspect on the scope screen. The following photos show how the superficial appearance of a square-wave voltage changes as the horizontal sweep rate of the scope is varied.
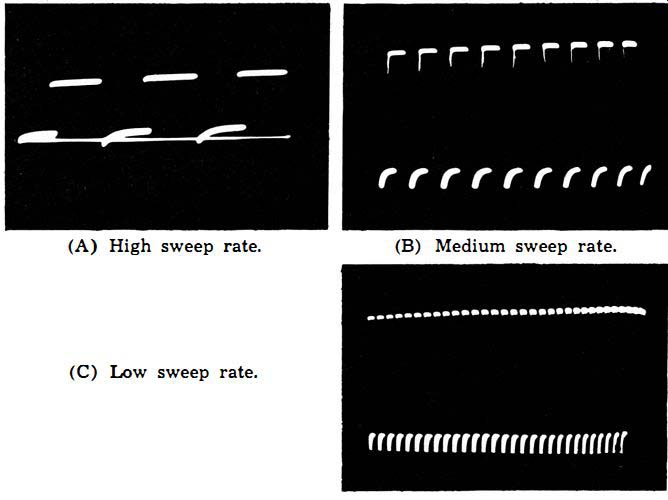
------- Effect of sweep rate on square wave. (A) High sweep rate. (C) Low
sweep rate. (B) Medium sweep rate.
NOTE 16
Effect of Nonlinearity in Vertical Amplifier on Square Waveform
You will notice when making square-wave tests of scope response that the top and bottom of the reproduced square wave are sometimes unsymmetrical. When a vertical amplifier causes tilt in the square waveform, this tilt will be the same along the top and bottom of the wave if the amplifier is linear.
This tilt is caused by low-frequency attenuation and phase shift. On the other hand, when tilt is unsymmetrical, as shown in the second photo, this tilt is caused by amplitude distortion (nonlinearity) in the vertical amplifier.
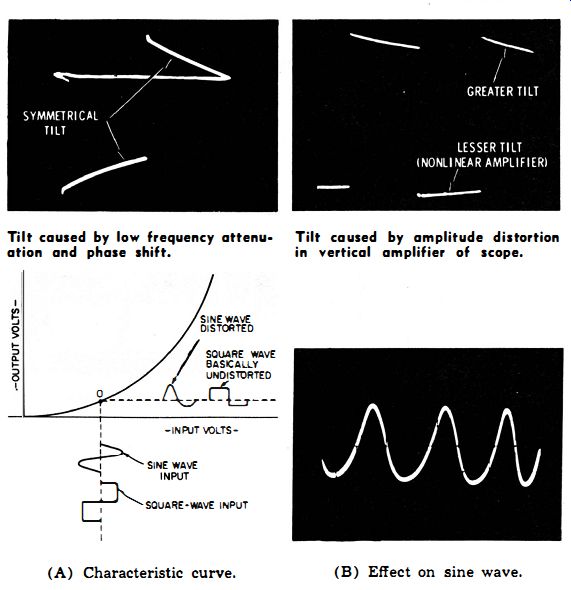
--- Tilt caused by low frequency attenuation and phase shift. Tilt
caused by amplitude distortion in vertical amplifier of scope. -----
(A) Characteristic curve. (B) Effect on sine wave.
Nonlinear vertical amplifier.
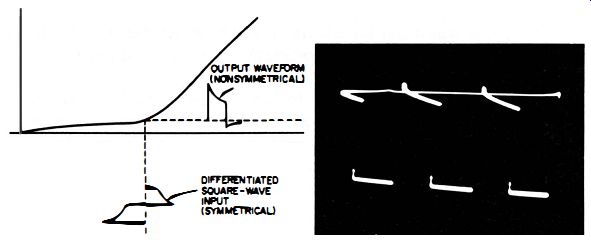
------ (A) Characteristic curve. (B) Effect on differentiated square
wave.
Nonlinear vertical amplifier.
NOTE 17
Effect of 60-Cycle Hum Voltage on Square-Wave Pattern
The following photo shows the appearance of 50-cycle hum voltage in a reproduced square-wave pattern. This hum voltage is encountered, for example, when the "hot" output terminal from the squarewave generator is connected to the vertical:-input terminals of the scope and the ground lead between the instruments is omitted.
----
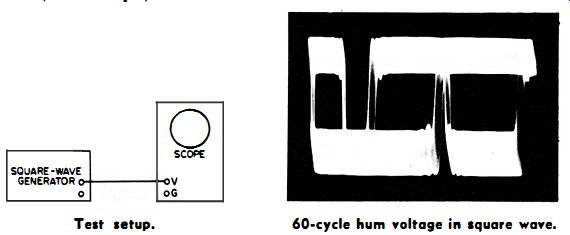
Test setup. 60-cycle hum voltage in Square wave.
+++++++++
U3
To Check a Scope for Cross Talk Between the Vertical and Horizontal Amplifiers
Equipment: Square-wave generator.
Connections Required: Apply output from square-wave generator to vertical-input terminals of scope. In second test, apply output from square-wave generator to horizontal-input terminals of scope.
Procedure: With drive applied to the vertical-input terminals, advance the vertical gain and reduce the horizontal gain to zero. In the second test, with drive applied to the horizontal-input terminals, advance the horizontal gain and reduce the vertical gain to zero.
Evaluation of Results: The first test should display a single vertical line. Two vertical lines show the occurrence of cross talk. In the second test, a single horizontal line should be displayed. Two horizontal lines show the presence of cross talk.
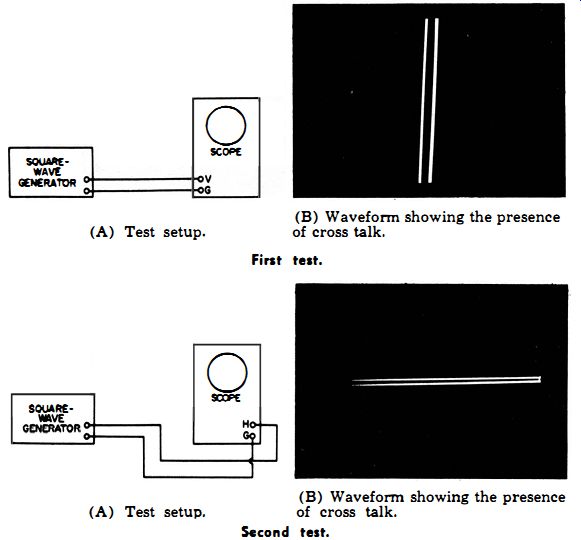
------- First test: (A) Test setup. (B) Waveform showing the presence of cross
talk.
Second test. (A) Test setup. (B) Waveform showing the presence of cross talk.
++++++
U4
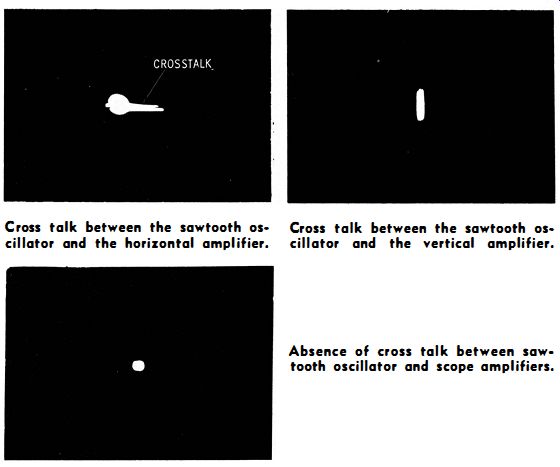
To Check a Scope for Cross Talk Between the Sawtooth Oscillator and the Amplifiers
Equipment: None.
Connections Required: None.
Procedure: Switch horizontal-range switch (or horizontal-amplifier switch) to Off position. (Or, set horizontal-amplifier switch to Horizontal Input position.) Set vertical gain to zero.
Evaluation of Results: A sharply focused round spot should appear at the center of the scope screen. Tailing or smearing of the spot indicates cross talk between the sawtooth oscillator and one or both amplifiers of the scope.
----
Cross talk between the sawtooth oscillator and the horizontal amplifier.
Cross talk between the sawtooth oscillator and the vertical amplifier.
Absence of cross talk between sawtooth oscillator and scope amplifiers.
++++++
U5
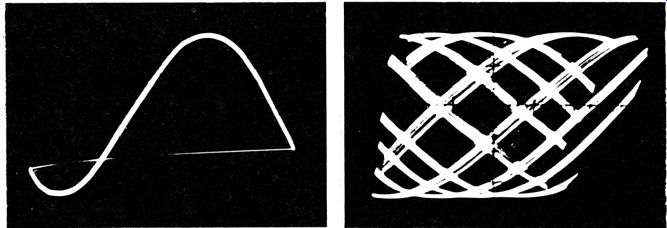
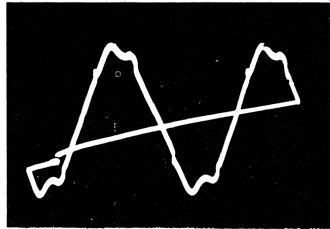
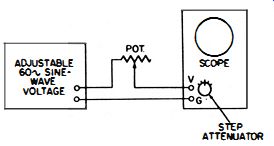
To Check a Scope for Astigmatism
Equipment : Trimmer capacitor and 60-cycle, sine-wave source.
Connections Required: Apply the 60-cycle, sine-wave voltage directly to the vertical-input terminals of the scope. Apply the same voltage through a trimmer capacitor to the horizontal-input terminals of the scope.
Procedure: Adjust trimmer capacitor and scope gain controls for a circular pattern.
Evaluation of Results: Astigmatism causes poor focus at top and bottom, or at left and right, of circle.
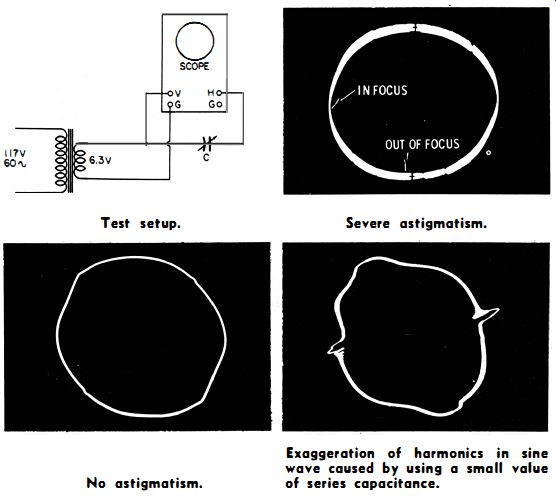
---- Test setup. Severe astigmatism. ----- No astigmatism.
Exaggeration of harmonics in sine wave caused by using a small value of series capacitance.
NOTE 18
Addition of Resistor When Circular Pattern Cannot Be Obtained
With some scopes, a resistor (potentiometer) is needed in addition to the trimmer capacitor to obtain a circular pattern. There must be a 90 ° phase difference between the vertical- and horizontal-input voltages to display a circle. Use a 1-meg pot and a 3-3 0 mmf trimmer, as shown in the following illustration.
--------- Test setup.
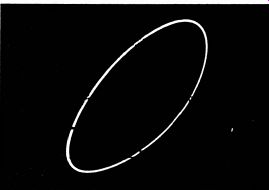
------ - An ellipse, as shown above, is displayed unless R and
C have suitable values. A circle is obtained only when R and C are of suitable
values and the scope gain controls are suit ably adjusted.
NOTE 19
Effect When There Is Cross Talk Between Sawtooth Oscillator and Horizontal Amplifier
When there is cross talk between the sawtooth oscillator and the horizontal amplifier, a pip appears on the circular pattern, as shown in the following illustrations.
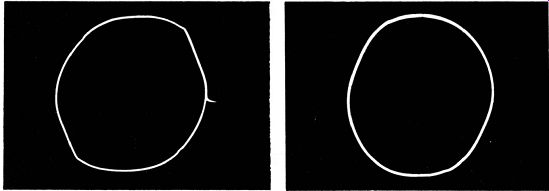
---- Cross talk present. Pattern free of cross talk.
NOTE 20
Effect of Harmonics on Circular Pattern
When a small trimmer capacitor is used in a phase-shifting network, any harmonics in the source voltage are accentuated. This accentuation causes the pattern to display flat nesses or kinks, instead of appearing as a perfect circle or perfect ellipse.
Typical examples are shown in the following illustrations.
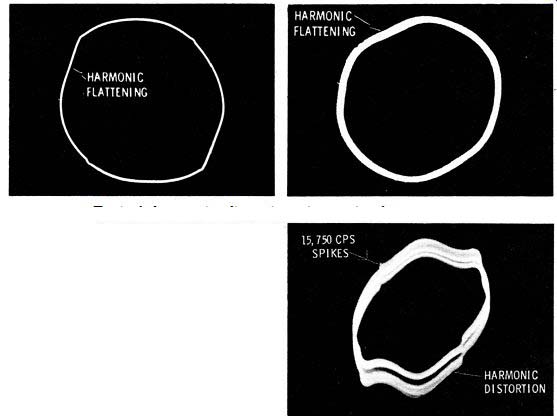
-------- Typical harmonic distortions in a circular pattern.
Stray field pickup from a sweep system of a TV receiver operating near the scope.
++++++++
U6
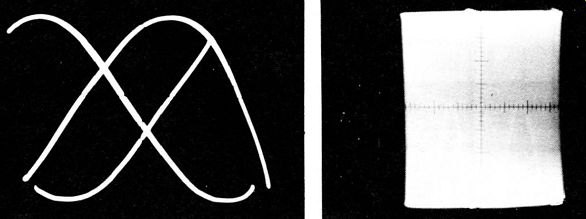
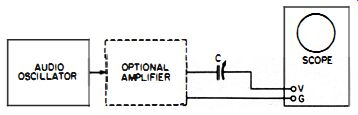
-- To Determine the Frequency Range Over Which a Scope Is Free from Phase Shift Between the Vertical and Horizontal Amplifiers
Equipment: Audio oscillator.
Connections Required: Apply output from audio oscillator to vertical- and horizontal-input terminals of scope, as shown in the following drawing.
Procedure: Adjust scope controls for diagonal line on screen.
Evaluation of Results: Vary output frequency from audio oscillator while watching scope pattern. Limit of freedom from phase shift is reached when the diagonal line opens out into an ellipse.
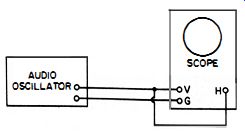
----- Test setup.
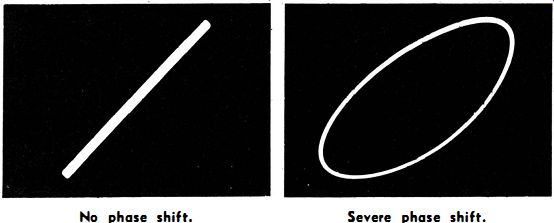
-------- No phase shift. Severe phase shift.
++++++++++
U7
To Determine Whether the Scope Amplifiers Are Free from Amplitude Distortion Over Their Useful Frequency Range Equipment: Audio oscillator.
Connections Required: Apply output from audio oscillator to vertical- and horizontal-input terminals of the scope.
Procedure: Adjust scope controls for diagonal line on screen.
Advance scope gain controls for full-screen deflection.
Evaluation of Results: Vary the audio oscillator frequency through the range over which the diagonal line does not open into an ellipse. Watch the line for departures from straightness. Curvature or kinks in the line show that amplitude distortion is occurring in one or both amplifiers.
A scope can have a different amount of amplitude distortion at low frequencies than at high frequencies.
--- Noticeable amplitude distortion. Severe amplitude distortion.
++++++
U8
To Measure the Input Resistance of a Scope
Equipment : Potentiometer with several megohms maximum resistance.
Connections Required: Connect a potentiometer in series between the vertical-input terminal of the scope and a 60 cycle, sine-wave voltage source.
Procedure: Note the amount of vertical deflection of the sinewave pattern with the potentiometer set for zero resistance. Then adjust the potentiometer for exactly one-half this deflection.
Evaluation of Results: Disconnect potentiometer and measure its resistance with an ohmmeter. This is the value of the input resistance of the scope.
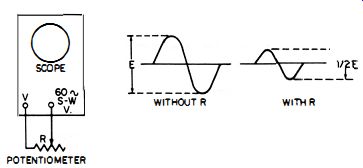
------- Test setup.
++++++++
U9
To Determine Whether a Scope Has a Constant Value of Input Resistance on Each Step of the Coarse Attenuator
Equipment: Potentiometer with several megohms maximum resistance.
Connections Required: Connect the potentiometer in series between the vertical-input terminals of the scope and an adjustable source of 60-cycle, sine-wave voltage. Sufficient voltage must be available to obtain adequate vertical deflection on the least sensitive step of the attenuator.
Procedure: Note the amount of vertical deflection of the sinewave pattern with the potentiometer set for zero resistance. Then adjust the potentiometer for exactly one-half this deflection and measure the resistance with an ohm-meter. Repeat on each step of the coarse attenuator. Use sufficient output voltage from the 60-cycle source in each step to obtain convenient vertical deflection.
Evaluation of Results; The same amount of series resistance should reduce the vertical deflection to one-half on each step of the coarse attenuator.
--------- Test setup.
++++++++
U10
To Measure the Input Capacitance of a Scope
Equipment: Trimmer capacitor and audio oscillator.
Connections Required: Connect the trimmer capacitor in series between the vertical-input terminals of the scope and the audio oscillator.
Procedure: Set the audio oscillator to a relatively high-frequency output, such as 100-khz. Short-circuit the trimmer capacitor and note the vertical deflection obtained. Then remove the short and adjust trimmer for one-half the original deflection.
Evaluation of Results: Remove trimmer and measure its capacitance with a capacitance bridge or capacitance meter. This capacitance value is equal to the input capacitance of the scope.
-------- Test setup.
++++++++++
U11
To Determine Whether a Scope Has a Constant Value of Input Capacitance on Each Step of the Coarse Attenuator
Equipment: Trimmer capacitor and audio oscillator.
Connections Required: Connect the trimmer capacitor in series between the vertical-input terminals of the scope and an audio amplifier.
Procedure: Set the audio oscillator to a relatively high frequency output, such as 100-khz. Short-circuit the trimmer capacitor. Note the vertical deflection obtained. Then remove the short, adjust the trimmer for one-half the original deflection, and measure the value of the trimmer capacitor. Repeat on each step of the coarse attenuator. (Use an audio amplifier, as shown in the illustration, if needed, to obtain adequate deflection on the least sensitive step of the coarse attenuator.) Adjust input voltage to vertical amplifier on each step, as required.
Evaluation of Results: The same value of series capacitance should reduce the vertical deflection to one-half on each step of the coarse attenuator.
Unless a scope has a constant value of input resistance and a constant value of input capacitance on each step of the coarse attenuator, a low-capacitance probe or capacitance-divider probe cannot be used satisfactorily.
---- Test setup.
+++++++++
U12
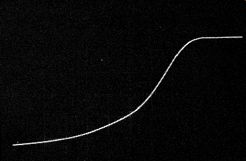
To Measure the Rise Time of a Square Wave
Equipment: Square-wave generator and triggered-sweep scope.
Connections Required: Terminate the output cable from the square-wave generator correctly (see instruction manual) , and feed the square-wave signal directly into the vertical input terminals of the scope.
Procedure: Adjust the scope controls to expand the leading edge as required for easy measurement of rise time. The accompanying photo shows how the leading edge can be expanded.
Evaluation of Results: Rise time is measured from the 10% point to the 90% point on the leading edge of the reproduced square wave. The elapsed time is determined from the setting of the horizontal-sweep controls on the triggered-sweep scope and the width of the display on the screen. If the scope has a fast rise time and the square-wave generator has a slow rise time, you are essentially measuring the rise time of the square-wave generator. On the other hand, if the scope has a slow rise time, and the square-wave generator has a fast rise time, you are essentially measuring the rise time of the scope. In any case, the rise time displayed on the scope screen is equal to:
T_D =__/ TG^2 + Ts^2
… where,
T_D is the rise time displayed on the scope screen, T_G is the rise time of the square-wave generator, T_s is the rise time of the scope.
------- Expanded rise of a square wave.
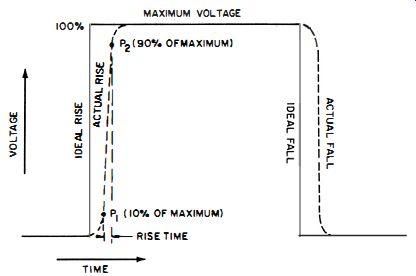
--------- Rise time is measured from the 10% to the 90% point.
NOTE 21
Reading Elapsed Time on a Triggered-Sweep Scope
Triggered-sweep controls are calibrated to read milliseconds or micro-seconds percentimeter, as depicted in the diagram which follows. Each division on the graticule of a triggered-sweep scope is an interval of 1 centimeter. By noting the number of centimeters occupied by the waveform and the setting of the scope it is easy to calculate the elapsed time from one point to another on a waveform. Although the top sweep speed indicated in the diagram is 1 microsecond percentimeter, other triggered-sweep scopes have a much faster upper limit (0.04 microsecond percentimeter).
----Typical sweep-speed control on triggered-sweep scope.
Triggered-sweep scope has its graticule stepped off in centimeter intervals.
+++