by Ralph West [Technical Advisor, Hi-Fi News & Record Review, London, England. ]
IT HAS OFTEN been said that loud speaker response curves can be very misleading. For those who press for further explanation, one may say that even the closest examination of the curve tells very little about what the loudspeaker actually sounds like.
Every manufacturer knows this only too well; he may well have learned to his cost, in the past, that it does not do to rely overly much on curves in deciding when to freeze the design and start production. A relatively flat curve, obtained after much sweat and tears, may turn out to be a shocking noise. Again, two very similar irregular curves (they usually are!) may produce entirely different sounds in practice, so much so that one may suspect the accuracy of the measurements.
Now, the frequency response of an amplifier, a recording system or a microphone, does give meaningful information as a rule, sometimes all that is needed. Add to that distortion and signal handling capacity, and assume reasonable noise and transient behavior, and one has a pretty good picture of its sound.
But these are relatively simple devices in that the signal has generally traversed the device, from input to output, in a few microseconds, at most, a tiny fraction of one cycle of the highest audio frequency. As long as a device treats all frequencies alike, and amplifiers, etc. usually do, within a few percent, we are happy.
Now a loudspeaker is far more complicated. It may take several milliseconds for the signal to reach all parts of its active area. Not only are these different parts very likely to vibrate independently, but they are all at different distances from our ears and from all the reflecting surfaces that surround them in normal use. The resulting sound then depends on just how these many independent parcels of sound add together or subtract. This varies with every change of frequency and with change of listening position, i.e. it is hopelessly complicated.
On the score of transients, the starting and stopping of signals, everything except the speaker is reasonably trouble-free. A good modern amplifier can start and stop in a microsecond or so, and a microphone in a few microseconds as its moving parts are small, light and easily damped. A loudspeaker, on the other hand, as it has to be so much larger and heavier--and stronger--to produce enough noise, has to be given so much energy to start it moving that there is a lot of stored energy to dissipate when the electrical input signal stops. Various patches of the cone are likely to go on wobbling long after the input has ceased. Moreover, none of this bad behavior may show on the frequency response curve, which is a steady-state measurement.
The steady-state measurement is relatively easy to make and consequently is often performed, but transient behavior is very difficult to measure-requiring a long-winded and tedious series of tests that could take days. The ear just listens and decides in seconds! As engineers, we mistrust subjective assessments as they are liable to prejudice, peculiar likes and dislikes, and to variations from day to day. Objective measurements are far more reliable and repeatable, but still no use if they fail to give useful answers. In defense of the subjective assessment, one must realize that it involves also the services of an extremely complex computer, the brain, that can not only "measure" dozens of independent variables simultaneously, but also has a memory store several orders of magnitude larger than any man-made computer. It is therefore quite a formidable measuring tool.
A further look into some of the reasons why a response curve tells so little might be illustrated by the following. Place half a dozen people in a good row of seats in one of our large cathedrals to enjoy an organ recital and they would probably all agree that the sound was good, without adverse criticism. Now give them sound-level meters and graph paper, and get the organist to play slowly up the scale. The resulting graphs would be like cross-sections of the Rocky Mountains, and all different!
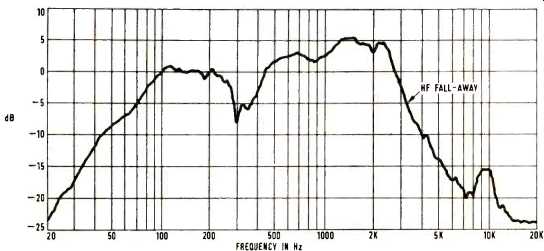
Fig. 1--Small sealed-box system with tweeter disconnected.
Of course the frequency response curve does show up some things we can hear. If the general level over large parts of the curve varies considerably--for instance, the average level for frequencies above 1 kHz is several decibels lower than that below 1 kHz-the sound will be dull and distant. If the level falls away steadily above 2 kHz (Fig. 1) it will sound muffled, whereas falling away below 1 kHz it will sound thin and shrill, crying out for considerable bass boost. These are matters of balance and they show up reasonably clearly.
Excessively high output over a narrow range of frequencies will also always produce an audible effect, possible because output is higher in this region, but more likely because there is also a resonance or series of resonances close together. A resonance means a slow build-up of artificially exaggerated sound (not too serious) and a slow decay (very serious and one of the main dislikes of our ears, unless it is wideband natural decay like dying reverberation). A large dip in a response curve is not quite so serious, as one cannot hear what is not there; but something will be heard, often a "hollowness," depending where it lies in the spectrum.
A large dip in the curve at the crossover frequency (Fig. 2) usually denotes a reversed phase between woofer and tweeter. On mono it may sound OK, but in stereo it often produces the most odd effects. Some instruments appear to pop over to the other side of the stage to play some notes, or an instrument may keep on altering its apparent width. Any sudden change in level on the curve is viewed with suspicion and often indicates something wrong that may produce an audible manifestation.
Any two-unit system can produce a whole series of different curves, depending on the exact position of the measuring microphone. Suppose the microphone is on the tweeter axis, it is then a little farther away from the woofer, and sound from the latter arrives a little later. If it is half a cycle later, it will subtract and the curve shows a dip. If perchance the two sounds are of equal intensity, and they should be at the crossover frequency, they will cancel, leaving nothing. Move the microphone slightly and this huge dip will disappear (Fig. 3).
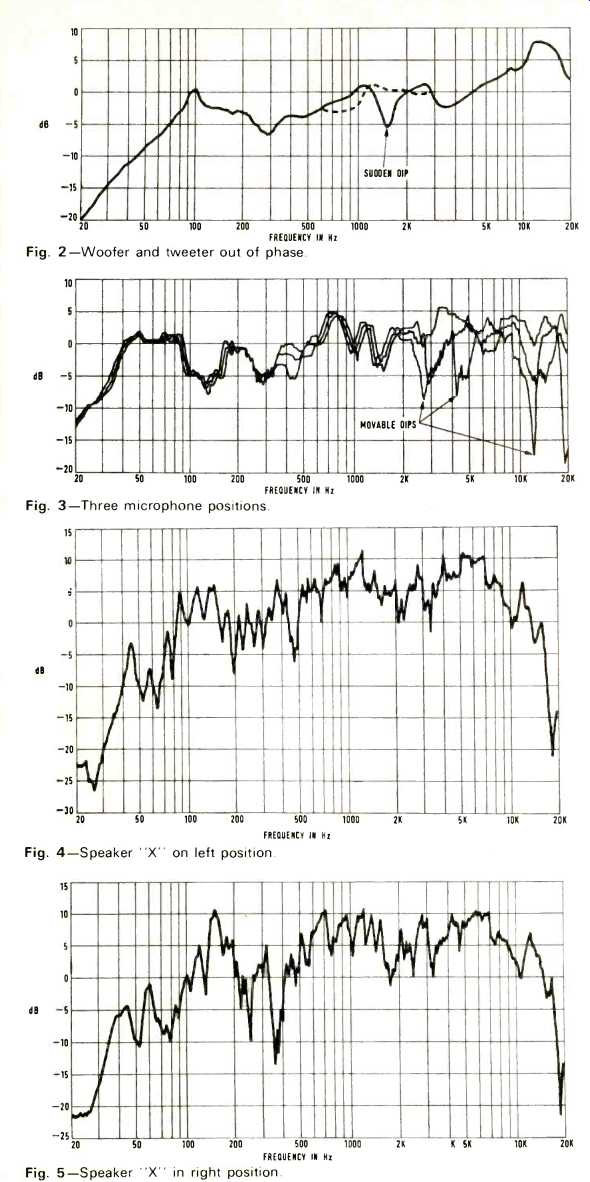
Fig. 2--Woofer and tweeter out of phase.
Fig. 3--Three microphone positions.
Fig. 4--Speaker "X" on left position.
Fig. 5--Speaker "X in right position.
Things like this, while they show up clearly on the frequency curve, cannot be heard in use. We listen with two ears, not one, the music is constantly changing, our head is continually slightly on the move, and in our domestic surroundings there are a whole host of reflections which complicate the pattern of variations still further. Even a single cone will still do this, as all parts of its area cannot be the same distance from the measuring microphone-and if they could be, it is unlikely that all these bits of the total area will be in step or in phase. (Only an electrostatic might manage.) So, summing up thus far, the frequency curve of a loudspeaker has lots of wiggles that we shan't hear and a few wiggles we shall hear, but we cannot predict which. Only the big humps, hollows, and slopes are directly meaningful to a listener. Finally, looking at two different loudspeaker curves and trying to decide which is the better speaker of the two is almost a complete waste of time.
To the engineer, however, developing a new design, these measurements 'are very useful. The curve will show, for instance, whether his design modification to increase or reduce the sound output at a particular point in the frequency spectrum has had the desired effect. If he is wise he will still listen to it to see if this modification has produced any undesirable effects that may not show on the curve. To the production engineer, regular measurements done under exactly the same conditions will show if standards are being maintained or if any changes are creeping into the product as supplies and staff, etc. change with time.
Having seen some slight justification for a loudspeaker response curve, how is it made? One merely puts a microphone with a flat response in front of the loudspeaker (one meter is the standard distance), varies the input frequency, keeping the voltage at the speaker terminals constant, and measures the microphone output. This sounds straightforward enough and does not take very long to do if one has a level recorder which plots the curve automatically. However, where is this done? The most obvious place is in typical listening room conditions.
Speaker X, it had better be nameless (very non-standard), had the measuring microphone rigidly fixed to it with a light and acoustically transparent girder structure, to make sure we were always measuring the same speaker the same way. Placed in the left stereo speaker position, (Fig. 4) shows its measured behavior. Placed on the right side, it gave Fig. 5. Out of sheer curiosity the speaker was placed in the center of the far end of the room and the microphone removed and placed, in turn, at ear level above two adjacent chairs from which listening normally takes place (Figs. 6 and 7). Any resemblance between Figs. 4, 5, 6, and 7 is (almost) purely accidental.
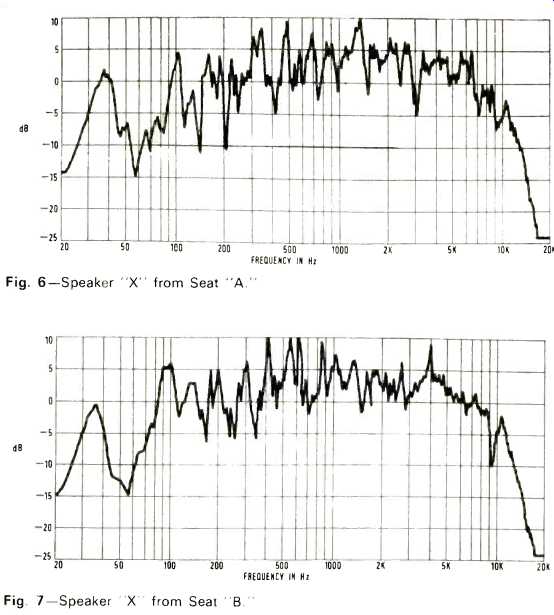
Fig. 6-Speaker "X" from Seat "A."
Fig. 7-Speaker X from Seat "B."
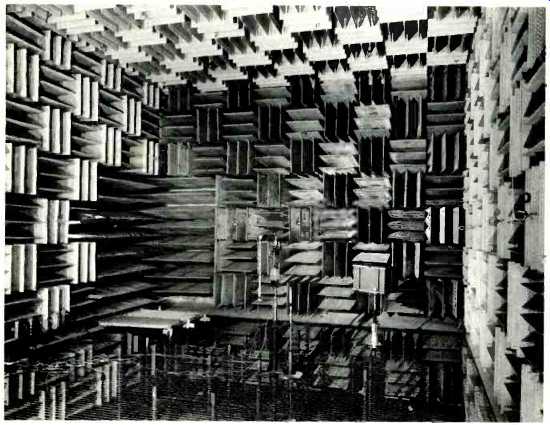
Fig. 8--An anechoic room for use in loudspeaker testing. Photo courtesy Jensen
Sound Laboratories.
Quite clearly we are measuring the room more than the loudspeaker, especially in Figs. 6 and 7. This is why this measurement must always take place in non-reflecting surroundings.
Ideally this is out of doors on a quiet, windless day, with the speaker and microphone about 20 ft. from the ground hung from a crane. This has been done, but is not too convenient, even if the weather permits, so at great cost we build anechoic chambers. These are very large rooms, preferably soundproof, with walls, floor and ceiling completely covered with a very thick layer of sound absorbing material.
The most effective form of absorbent seems to be a mass of wedge-shaped members, with their thin ends pointing into the chamber. Special grades of polyurethane foam or rock-wool in thin cotton bags are the most successful materials to date (Fig. 8). The length of the wedges determines the lowest frequency down to which practically 100% absorption takes place. To go down to 20 Hz the wedges would need to be about 12 ft. long! (I don't think there's even one in the world with 6 ft. wedges.) If the working space is large, then 5 ft. wedges give very small errors above, say, 30 Hz, and anyway one can always allow for a constant error.
Speaker X, with its attendant microphone, was taken to an anechoic chamber and gave the curve in Fig. 9. The little bump at 35 Hz is where the room is no longer absorbing most of the incident sound.
The poor man's anechoic chamber has to be the open air, and very useful results can be obtained quite simply.
Ideally one should bury the speaker flush with the surface of the ground and hang the microphone directly above. Not wishing to dig up the lawn, or spoil the cabinet work, Speaker X was laid in the middle of the lawn well away from walls and buildings, and the curve of Fig. 10 resulted. This curve is better than Fig. 9 at the very low frequencies, but has a nasty series of dips in the 140-220 Hz range. This is due to some sound (from the woofer) reflecting from the ground (not too much as it's lawn) and arriving at the microphone half a cycle late and subtracting. Raising the speaker on to a low stool (21 cm) increases the path difference and cancellation takes place at a lower frequency: 100-200 Hz (Fig. 11). The three dips are thought to correspond to the three distances--over the side, over the bass end, over the tweeter end. Further raising on to a 54 cm stool and 185 cm step-ladder gave progressive lowering of the cancellation frequencies, and also less actual cancellation as the reflected sound is weaker due to greater distances travelled and more time for dispersion (Figs. 12 and 13). Fig. 13 is very close to the anechoic room curve; a few more feet .higher and it would be acoustically superior. (Memo: must order scaffolding!)
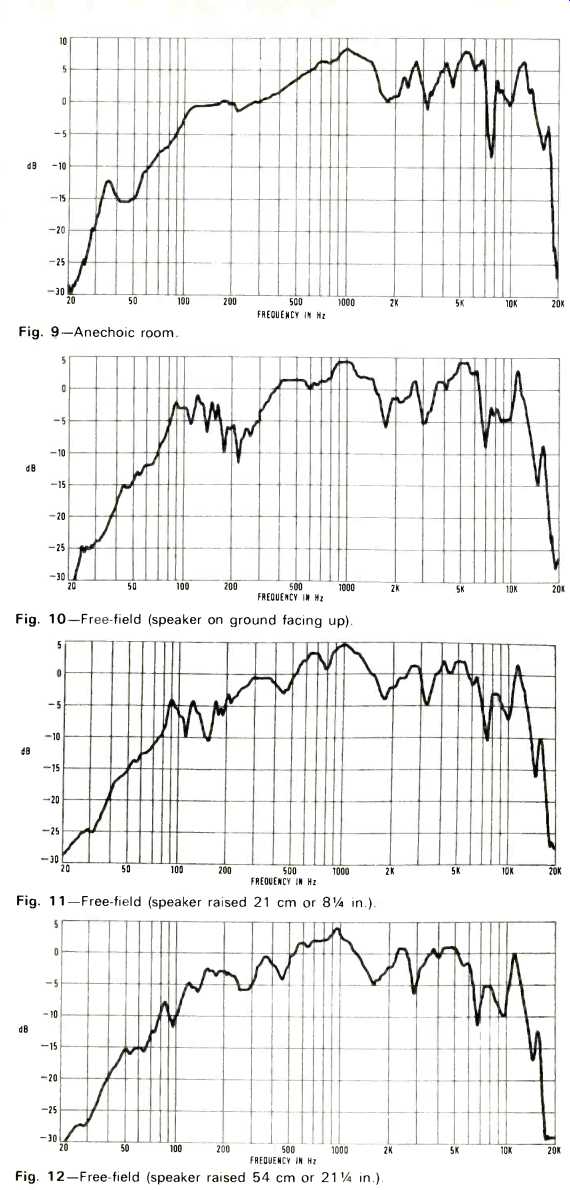
Fig. 9--Anechoic room.
Fig. 10--Free-field (speaker on ground facing up).
Fig. 11--Free-field (speaker raised 21 cm or 8 1/4 in.).
Fig. 12--Free-field (speaker raised 54 cm or 21 1/4 in.).
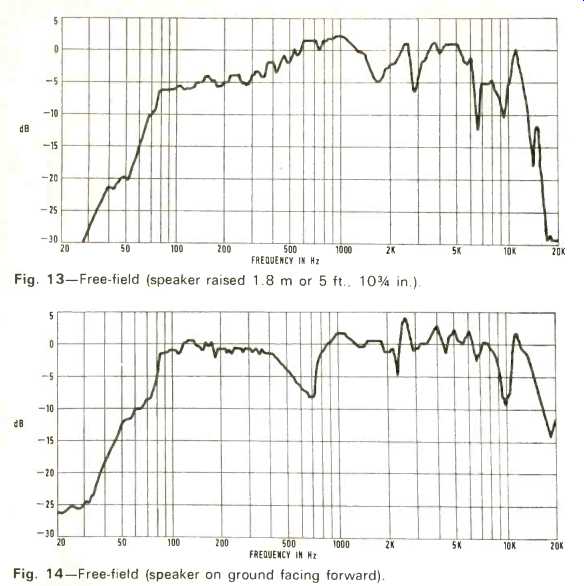
Fig. 13--Free-field (speaker raised 1.8 m or 5 ft., 10 3/4 in.). Fig.
14--Free-field
(speaker on ground facing forward).
Figure 14 shows a measurement taken with the speaker standing up normally on the same ground, the microphone now only 18 in. or so above the lawn. The bass end is now good, but the cancellation has moved up to 700 Hz and deepened. There is also evidence of reflections at higher frequencies too.
Apart from Fig. 14 the correlation above about 1 kHz is excellent for all the other outdoor results. This is because the higher frequencies do not spill out over the cabinet edges like the low frequencies. With an omnidirectional speaker, of course, one would have to hoist it aloft.
There is a small flaw in the validity of anechoic measurement, be it in a good chamber or hoisted aloft. This is bass loading. Aloft, at low frequencies the sound energy spreads in all directions. At home, our speaker is never far from floor and two walls, probably very close to one of them.
Under these conditions, the bass is increased as the same power is now concentrated into something less than equal to a hemisphere. Comparing either Fig. 10 or Fig. 14 with Fig. 13, both show a good 3 dB higher level at 30 Hz. What should we do? And how would one measure something like a Klipsch corner horn? I give up! --No, there is more work to be done.
Editor's Note: AUDIO does not test speakers in an anechoic chamber with a mike three feet away. (Who listens that way?) Instead, speakers are measured in a typical listening room with "pink noise" (which avoids room effects), on and off axis, plus an average curve. Taken together with the other measurements, we feel it gives a reasonable review of the performance.
(Audio magazine, Mar. 1972)
Also see:
Crossover Network Design (Mar. 1972)
Speaker Q's and A's Mainly for Beginners (Mar. 1972)
The Acoustic Feedback Loudspeaker System (Jan. 1972)
Speaker Tests: Room Test by Richard C. Heyser (Jan. 1975)
Speaker Tests--Phase Response (by Richard C. Heyser) (Dec. 1974)
= = = =