Manufacturer's Specifications:
Type: Three-way, bass reflex.
Drivers: 10-in. (25-cm) cone woofer; 6 1/2-in. (16-cm), polymer-laminated cone midrange, and 1-in. (2.5-cm) dome tweeter.
Frequency Response: 20 Hz to 35 kHz.
Sensitivity: 90 dB SPL at 1 meter for 1 watt input.
Crossover Frequencies: 200 Hz and 2.5 kHz.
Impedance: 4 ohms.
Rated Input Power (DIN): 100 watts.
Maximum Input Power (EIAJ): 250 watts.
Recommended Amplifier Power: 50 to 250 watts.
Dimensions: 44 1/4 in. H x 15 9/16 in. W x 13 3/8 in. D (112.4 cm x 39.6 cm x 34 cm), including grille.
Weight: 70.5 lbs. (32 kg).
Price: $1,500 per pair.
Company Address: Precise Acoustic Laboratories, 200 Williams Drive, Suite B, Ramsey, N.J. 07446.
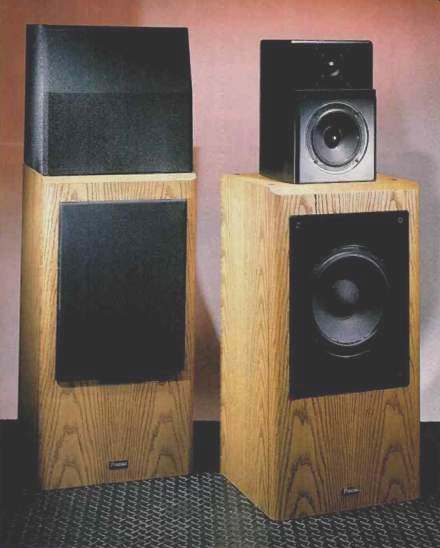
The Monitor 10 is the top model in a line of five loudspeakers made by Precise Acoustics, a division of Onkyo U.S.A. created to design, build, and market high-quality loudspeakers in the United States. While the Model 10 is currently built in Japan, it will soon be made in the U.S., as the other four models already are, and all five were designed in the U.S.A. The principal design work was done by Keith O. Johnson, who is probably more widely known for his work for Reference Recordings, where he has been responsible for some very impressive audiophile recordings. Years ago, Johnson built his own tape deck and invented a method of recording the highest audio frequencies deep into the magnetic tape, rather than near the surface, which is the conventional way: he called this "focus gap recording." The technique called for the use of a special recording head and the use of a very high bias signal, in the megahertz range. It is still used today for high-speed cassette duplicating systems.
More recently, Johnson has come up with another innovation, this time one that applies to loudspeaker design. The technique, called Differential Mode Stress Analysis (DMSA), is used to investigate the modal behavior of loudspeaker diaphragms. This may sound very complicated but it really isn't. Loudspeaker diaphragms, whether they are flat, conical, domed, etc., all tend to have complex vibration patterns that can be set into motion by the music they are trying to reproduce. These modes of vibration must be controlled, otherwise they will add their own output to the total sound and cause it to differ from the original.
Finding these modes, or vibration patterns, on a loudspeaker diaphragm is not an easy task. In the past, two methods have been used. The first utilizes a fine powder, which is sprinkled on the diaphragm; when certain frequencies are applied to the loudspeaker from a signal generator, the powder will migrate to the areas of the diaphragm that are not vibrating. The second method also requires the use of a signal generator, but this time a stroboscopic light is used to illuminate the diaphragm. (The strobe light is similar to the kind used by auto mechanics to set the timing of an automobile engine.) The frequency of the strobe light's flashes is adjusted to match the various vibration patterns of the diaphragm, allowing them to be seen. The DMSA technique can be used with music signals; this sets it apart from the other techniques, which always require a pure sine wave tone as the input signal to the loudspeaker. The key ingredient in DMSA is a tiny differential microphone that Johnson designed and built. The mike is placed close to the diaphragm and moved across it while the diaphragm is reproducing sound. The output from the microphone can be connected to instrumentation and perhaps to a pair of headphones. The two elements of the differential mike pick up the sounds from separate but adjacent points of the diaphragm. When the two adjacent areas of the diaphragm are moving together, as they should be, there is no output from the microphone. If, however, the diaphragm is breaking up into modal patterns, there will be output from the microphone because each element in the microphone picks up a different .output from the diaphragm. The material and treatment of the diaphragms used in the Precise Monitor 10, as well as the other models in the Precise line, were designed and developed using Johnson's ingenious technique.
The first thing that I noticed about the Precise Model 10 was that it was very well constructed and beautifully finished. The system consists of two cabinets, one on top of the other. The bottom enclosure is finished in oak and is a ported bass system, with a 10-inch bass driver on the front baffle and the port opening on the rear of the enclosure. A smaller enclosure, which has the 6 1/2-inch midrange driver and the 1-inch treble driver, sits on top of the bass cabinet; it is finished in matte black with smoothly rounded corners.
The treble driver is mounted on a front panel, which is set back from the midrange driver. This mid/high enclosure is detachable but cannot be used separately from the bass system, as I found out during my technical measurements.
A socket on its bottom fits into a pin that sticks up from the top of the bass cabinet; this locates it on top of the bass enclosure and allows it to be turned right or left about 30°. A detachable hood, covered with black grille cloth, fits over the smaller box; it is held in place by four pins which mate with sockets in the top of the bass enclosure. The input to the system is on the back panel of the bass enclosure; the smaller, mid/high enclosure is connected to the bass enclosure by two pairs of wires that come from the top of the larger box. For those readers who like to rap their knuckles on enclosures and tap cones, the "knuckle test" indicates that the enclosure is solidly constructed, with no peculiar sounds, and the "cone tap" test elicits nothing unusual in the way of strange sounds.
The bass cabinet is 12 5/8 in. deep x 15 1/2 in. wide x 29 1/2 in. high. The cabinet appears to use inch-thick panels except for the baffle, which is 1 1/4 inch thick. The volume of the bass enclosure is about 3,945 cubic inches, which is 2.28 cu. ft. The input plate features large, gold-plated terminals with holes suitable for thick loudspeaker connecting cables; these terminals are mounted at an angle to make them easier to use. Inside the bass enclosure, the input terminals are connected by heavy wires to a crossover board that is mounted by plastic fasteners to a diagonal brace at the bottom of the enclosure. This board carries two chokes, three capacitors, and three resistors. The output from this network feeds a separate bass-control circuit.
The bass-control circuit does not use a p.c. board; its parts are mounted on a piece of particle board that is fastened to the right side of the cabinet. This circuit includes one large choke, two back-to-back electrolytics, and two large resistors. These parts are connected to the bass switch, which is mounted on the input plate on the back of the bass cabinet and allows the bass to be increased or decreased 2 dB from its normal setting.
MEASURED DATA
- Type: Three-way bass reflex with separate mid/high enclosure.
- Frequency Response: 40 Hz to 20 kHz, ±4 dB.
- Sensitivity: 76 dB SPL at 1 meter for 1 V input.
- Efficiency: 85 dB SPL at 1 meter for 1 watt input.
- Amplifier Power: Recommended, 50 to 250 watts per channel; maximum, 300 watts.
- Harmonic Distortion: At 90 dB SPL, less than 1.0% second or third harmonic above 100 Hz; less than 6.3% second or third harmonic below 100 Hz.; at 100 dB SPL, less than 2.0% second or third harmonic above 100 Hz, less than 7.1% second or third harmonic below 100 Hz.
- Minimum Impedance: 2.4 ohms.
- Absolute Polarity: See text.
- Low-frequency Resonances: 27 and 40 Hz.
- Crossover Frequencies: 120 Hz and 3 kHz.
- Controls and Switches: Three-position toggle switches for bass and treble.
- Input Connections: Bass five-way binding posts, gold-plated, with large holes; mid/high, four banana sockets, gold plated.
- Enclosure Material and Finish: Bass, 1-inch medium density fiberboard, oak finish; mid/high, 3/4-inch medium-density fiberboard, black finish.
- Enclosure Dimensions: Bass, 29 1/2 in. H x 15 1/2 in. W x 12 1/8 in. D; mid/high, 13 3/8 in. H x 9 1/4 in. W x 7 3/8 in. D.
- Weight: Total, 75 lbs.; bass, 57 lbs.; mid/high, 14 lbs.; hood, 4 lbs.
I had previously determined, by measurements I made on both loudspeakers, that they were almost identical. I did find a difference in output at frequencies between 4.5 and 6.5 kHz, but only of about 2 dB; the systems tracked within 0.5 dB elsewhere. Since their characteristics were so close, I made detailed measurements on only one system of the pair.
Figure 1 shows impedance magnitude versus frequency, from 10 Hz to 20 kHz, for all three positions of the bass and treble switches; the solid curve represents impedance with the switches in the "0-dB," or normal, position. The listening evaluations were made with both switches set to this position. Precise specifies the Monitor 10's nominal impedance at 4 ohms, and this appears to be a good choice. The minimum impedance occurs at about 80 Hz, where it drops to 2.4 ohms. Since most program material has a lot of musical energy at or near this frequency, any amplifier chosen to drive the Monitor 10 should be able to supply sufficient current without overloading. This should be no problem since most modern amplifiers and receivers have this capability, at least at moderate levels. The undulations in the impedance versus frequency curve indicate the complexity of the crossover.
The complex impedance is shown in Fig. 2. This is essentially an X-Y plot, with the resistive component of the impedance on the X-axis and the reactive component on the Y-axis. Notice that the Y-axis shows both positive and negative values for the reactive component. This indicates that the impedance will have an inductive characteristic when it is in the upper half of the chart, a capacitive characteristic when it is in the lower half, and appears to be merely resistive when it is right on the zero line. The complex impedance of the Monitor 10 is not unusual for a system with the impedance variations of three drivers plus a complicated crossover having a total of eight inductors and 15 capacitors. The vertical scale has been expanded to show more detail so, even where the impedance appears capacitive, its magnitude is not as large as it might appear and should not cause problems for any reasonably good amp.
Figure 3 shows the magnitude and phase of the acoustic output of the Monitor 10 measured with a microphone 1 meter in front of the system and between the 6 1/2-inch and 1-inch drivers. The 10-inch bass driver is also contributing output but, since the lower range of the measurement was limited to 200 Hz, its contribution is not significant, especially up in the midrange. The droop in the midrange is caused by the fact that the 6 1/2-inch and 1-inch drivers are not in phase through this range, where both are contributing significant output; the phase plot for each driver shows this clearly. Since the Monitor 10 is designed to place a seated listener on the same plane as this measurement, this can cause problems in the perceived sound, as will be seen later. Since the 1-inch driver is physically mounted behind the 6 1/2-inch driver, on a separate baffle plane, it appears that an attempt was made to cause the output from the two drivers to be presented in phase to a listener in front of the system. Figure 3 indicates that such is not the case.
The energy/time measurement shown in Fig. 4 is another method of indicating how well the energy from the two upper drivers is synchronized; this also reveals that the treble energy arrives ahead of the energy from the midrange. The bass driver was also operating during this test, but its output is insignificant since, as was the case for the measurement of Fig. 3, the lower range of energy is limited to that above 200 Hz.
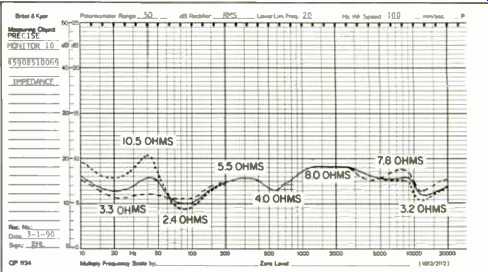
Fig. 1--Magnitude of impedance, with bass and treble switches set to the normal, "0
dB" position (solid line), to "+2 dB" (dotted line) and to "-2
dB" (dashed line).
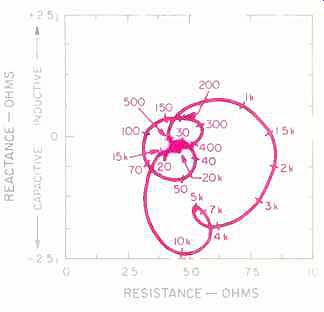
Fig. 2--Complex impedance, showing reactance and resistance vs. frequency.
The vertical scale has been expanded to show detail.
Figure 5 shows the 3-meter room response of the Monitor 10 measured with the microphone at a height of 42 inches, about ear level for a seated listener. This also put the microphone in the same plane as it was for the 1-meter measurement of Fig. 3, which is directly in line with a point between the two drivers on the mid/high enclosure. I measured the response of the Monitor 10 from 200 Hz to 20 kHz at 0° and 30° off the axis, to simulate what a listener would hear if seated directly in front of the system or off to the side in a common stereo setup. The response changes very little for the different angles but does show a large dip in the midrange for either position. The panel members were seated during the listening evaluations, so their comments, which were sprinkled throughout the evaluation forms, verify this lack of midrange energy. For the sound of stringed instruments, such as violins, the comments were: "Good highs but not much midrange" and "bright but lacks articulation." For guitar, comments were: "Lacks middle range" and "nebulous sound." And for full orchestra, comments were: "Muted sound", "lacks preciseness," and "no detail." Figure 6 shows the same response range as Fig. 5, for positions directly in front of the Monitor 10 at microphone heights of 42 and 62 inches, to simulate what a standing listener would hear as compared to the sound heard by a seated listener. The results indicate that a standing listener would probably make entirely different comments about the sound quality, since the Monitor 10 radiates much more midrange energy upward. Since I knew about this difference from my measurements, I asked two members of the panel to briefly compare the sound from seated and standing positions for two selections; I did this at the end of the listening sessions. Their comments verified that the difference was easily perceptible. The most interesting comment for the standing position was that "the imaging and sense of depth is much better when I stand up." The manner in which the Monitor 10 produces output at various angles around the system is shown in Figs. 7 and 8.
In Fig. 7, comparing the output at 1.9 kHz to that at 900 Hz shows that the 6 1/2-inch driver is becoming more directional at the higher frequency, which is quite normal. The treble driver is also becoming directional at '18 kHz, which is certainly normal. At 3.5 kHz, however, where the output in front of the system is reduced by the tendency of the 6 1/2-inch and 1-inch drivers' outputs to cancel each other, there is actually an increase in output at 60° to each side.
Remember that the actual output at 3.5 kHz is not as great as shown here, because the curve is "normalized" to the output at 0°. If you refer to Fig. 3 or Fig. 5, you will see that the output at 3.5 kHz is down in level from that at 900 Hz, 1.9 kHz and 18 kHz. The main thing Fig. 7 indicates is that the Monitor 10 does not radiate its midrange output uniformly in the horizontal plane around the system. Because I was aware of this, I conducted multiple listening sessions, with only two listeners at each session, and made certain that they were seated so that each speaker was facing directly toward them. The vertical polar radiation patterns for the same four frequencies are shown in Fig. 8. It is clear that the on-axis position, directly between the two upper drivers is not the best. At 3.5 kHz most of the output is radiated above and below the zero-axis position. A standing listener will receive an entirely different impression from that of a seated listener, with the standing listener hearing much more midrange energy. When you listen to a loudspeaker system, it is a good idea to do it from various positions, especially the seated position, which is how you will do most of your listening once you take the speakers home.
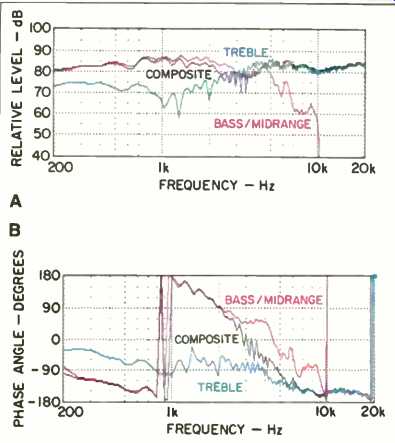
Fig. 3--On-axis frequency response (A) and phase response (B) for bass/ midrange
and treble drivers, separately and together. Although only response above 200
Hz is shown, there is some contribution from the bass driver. The phase differences
are sufficient to cause some cancellation of output in the crossover region;
see text.
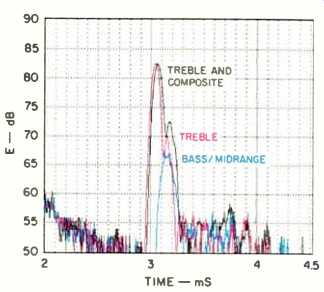
Fig. 4--One-meter energy-time curve, with grille off, showing bass-midrange,
treble, and composite output.
The treble output has two peaks, the first and larger of which overlaps that of the composite output and arrives about 95 µS before that of the bass/ midrange.
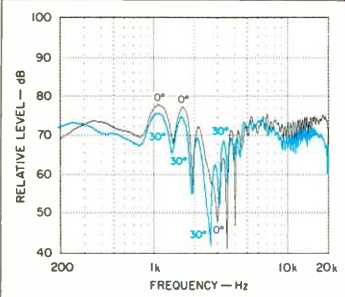
Fig. 5--Three-meter room response, measured on axis and 30° off axis, with
the microphone 42 inches above the floor and the system on a 3-inch base.
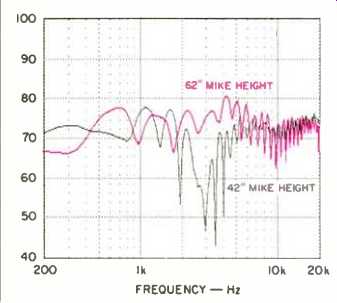
Fig. 6--Three-meter room response, on axis, at microphone heights of 42 and
62 inches, approximating seated and standing listener positions.
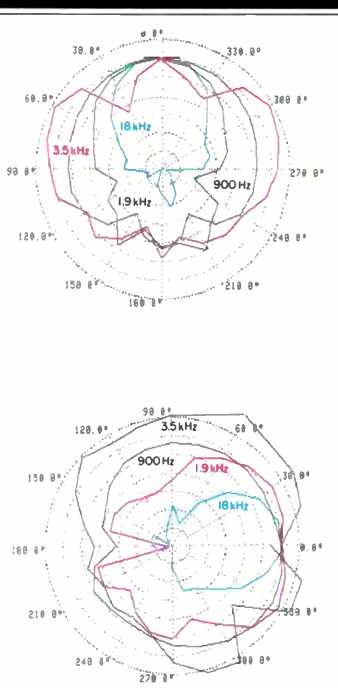
(top) Fig. 7--Horizontal polar responses, with the speaker facing the top of
the graph. All curves have been normalized to their 0° values, and hence
show relative directionality, not relative output, at different frequencies;
see text. (above) Fig. 8--Vertical polar responses, with the speaker facing
right. The 3.5-kHz curve shows the cancellation in the 0° (forward) direction
and the tendency to beam more energy above the speaker's axis.
Figures 9 and 10 show the second- and third-harmonic distortion for average sound pressure levels of 90 and 100 dB SPL respectively. The distortion is very low at the 90-dB level-which is higher than the average level maintained during the listening sessions I conduct, because it is too loud for reliable results from extended evaluations. The distortion at the higher, 100-dB average SPL is still very reasonable, with the second harmonic increasing and the third harmonic remaining respectably low. The intermodulation distortion was also very low because the bass and midrange are handled by separate drivers.
Figure 11 shows how the Monitor 10 reproduces square waves at 350 Hz and at 1, 4.5, and 7 kHz. I like to use square waves for testing because they are complex signals, each consisting of a fundamental and its harmonics in a definite relationship, much the same as musical sounds; the only musical sounds I can think of that are close to pure sine waves are whistles and "sweet potatoes." The fact that the treble energy precedes the lower frequency energy is evident from the small vertical spike in the 350-Hz and 1-kHz square waves. Various checks that I made showed that, at a listening position in front of the Monitor 10, the treble energy arrives about 95 µS before the lower frequency energy, which represents about 1.3 inches of offset. The high-frequency overtones of complex sounds will precede the fundamental and lower harmonics; this can cause the sound of instruments like solo guitar to be heard as "lacking attack on the plucked strings" although this comment might also be caused by the lack of energy in the midrange.
Figure 12 shows the output for the polarity test signal, which is a positive-going pulse. While the initial energy is negative, the output undulates from positive to negative twice before finally returning to zero; this probably explains why determining the correct absolute polarity for actual program material proved to be very difficult. There was a perceived change in brightness when the polarity was switched, but neither position of the polarity switch provided a sound more realistic than the other. Because of this, I could not list an absolute polarity in my Measured Data. Figure 13 shows two interesting things about the bass system of the Monitor 10. The first is that the slope of the low-pass crossover network is very gentle and allows the bass system output to extend well into the midrange. Some designers opt for steep roll-off of the upper frequencies, but I have found that a smooth and gentle roll-off characteristic, like that of the Monitor 10, yields a better, more coherent blending of the sound from the bass and midrange drivers.
The second thing Fig. 13 shows is the bump in the output at about 80 to 100 Hz. Some panel members made comments that can be directly correlated with this measured response characteristic-the sound of the double bass was "tubby" and the sound of a kick drum was "thumpy." The effect of the bass output switch is shown in Fig. 14.
This measurement was made with the microphone close to the cone of the 10-inch bass driver. The bass output switching scheme is certainly ingenious, and the ability to change the output in the bass range is almost never found in loudspeaker systems using passive crossovers. This can be helpful in adjusting the bass output to the characteristics of different size rooms. The build-up-of output around 80 Hz is also evident in these curves, as it was in Fig. 13.
A comparison of the output versus frequency curves from the bass driver and the port is shown in Fig. 15. I first placed the microphone close to the cone of the 10-inch bass driver and ran a curve of the output. Then I placed the microphone at the mouth of the bass port and ran another curve. I changed the signal drive to the system when I made the second curve, so that the output from the port was at about the same level as that from the bass driver, to make it easier to see how they blend together.
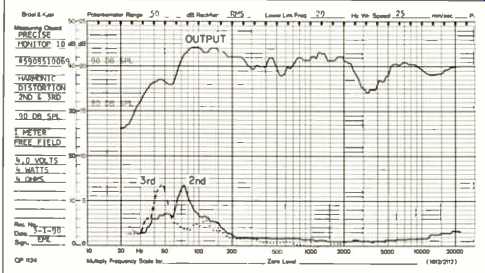
Fig. 9--Output (top) and second- and third harmonic distortion for 90 dB average
SPL, measured in free-field (anechoic) environment at 1 meter. Distortion is
less than 1% over most of the range, rising to 3.2% second harmonic at 74 Hz
and 6.3% third harmonic at 47 Hz. Bass output would be greater in a normal
room. The input was 4 V (4 watts).
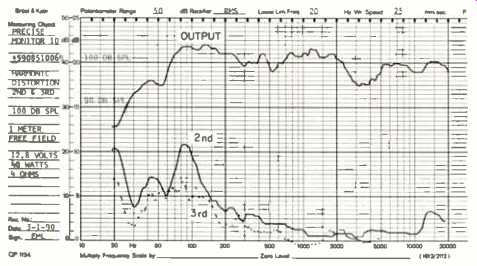
Fig. 10--Same as Fig. 9, but for 100 dB average SPL. Distortion is still below
1% for most of the range, rising to 7.1% second harmonic at 74 Hz; the third
harmonic remains very low at this high SPL. Input was 12.7 V (40 watts).
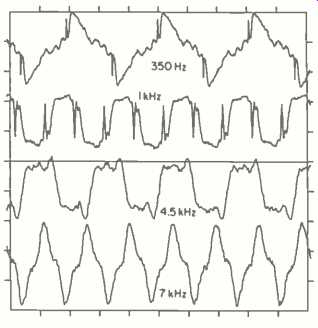
Fig. 11--Square-wave response at 1 meter.
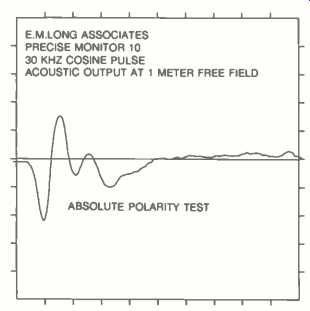
Fig. 12--Absolute polarity, measured at 1 meter in free field; see text.
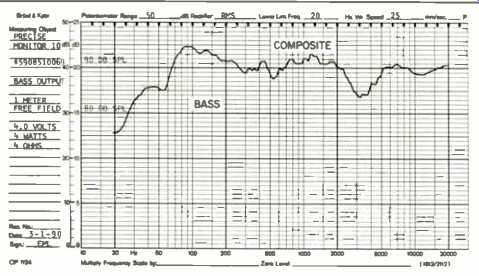
Fig. 13--Output of bass driver and of complete system (including port and
bass/midrange driver), measured at 1 meter in free field. Note the gentle crossover
slope in the bass-driver curve.
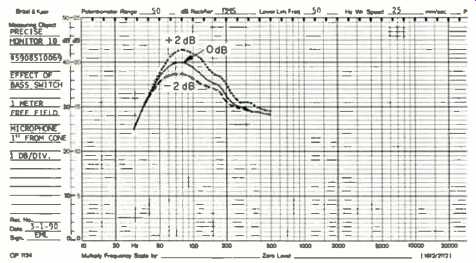
Fig. 14--Effect of bass output switch at all three settings, measured with
microphone 1 inch from cone of bass driver.
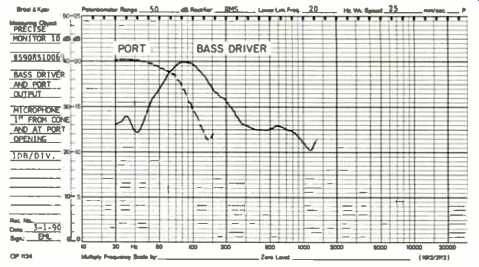
Fig. 15--Output from bass driver and port, each measured at microphone distance
of 1 inch. The output levels have been adjusted to blend the curves; see text.
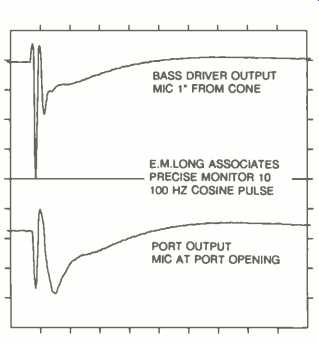
Fig. 16--Response of bass driver and port to 100-Hz positive cosine pulse.
The polarities of the driver and port are 180° apart, as they should be. The
port takes longer to recover, since it is tuned to a very low frequency; see
text.
Figure 16 shows the acoustic output from the 10-inch bass driver and the port for a single positive-going, 100-Hz pulse. The microphone was placed in the same positions that I used for the curves of Fig. 15. The initial response of the bass driver is positive and the initial response of the port is negative, as they both should be. The bass driver shows considerable output in the negative direction after the input pulse has ended, and there is a considerable recovery time for both the port and the bass driver. The "tubby," "thumpy" quality of the bass is probably increased by the fact that the bass driver and the port both continue to produce output after the pulse has ended. The output from the bass driver is also at about 80 Hz, which is about the frequency of the lowest note of a guitar.
Conclusions
The Precise Monitor 10 is a complex system that includes a number of interesting design features. It is solidly constructed and carefully built. The individual drivers making up the system are quite good--especially the treble driver, which exhibits a very smooth response both on and off axis, with very low distortion. If the midrange output on axis (which is in line with a seated listener) had been more uniform, I think the perceived quality of the system would have been much higher. The quality of the bass is unexceptional for an enclosure of this size, consisting mostly of upper bass around 80 Hz. The listening panel members found the overall sound of the Precise Monitor 10 to be very average; one comment, which says it all, was: "Not exceptional sound." If you have an opportunity to listen to the Precise Monitor 10, please do so; after all, you might like the sound. At least you will be better able to judge what we say about other systems.
-Edward M. Long
=================
(Source: Audio magazine, Sept. 1990)
Also see:
Pioneer TZ-9 Speaker (Jun. 1990)
= = = =