AUDIO is adding several loudspeaker testing procedures in order to provide additional data about speakers. While these tests will be laboratory tests simply because no two listening situations are identical, we have attempted to bring these tests as closely as possible in line with the actual conditions of use. While researchers do not have a uniform opinion about the relative value of some of these tests, these new methods of presentation are a step forward in providing additional information about the properties and characteristics of speakers. The purpose of this article is to introduce these new tests, several of which have previously appeared only in learned journals, and to explore their meaning, as well as to review the other tests which we have been using.
Frequency Response
The frequency response of a speaker is a measurement of a speaker's ability to reproduce constant sound pressure of any pitch component, from lowest to highest, from constant electrical stimulus. It will continue to be our standard practice to plot the relative magnitude of sound pressure for each frequency component.
Frequency response, like that of an electrical network, also has a phase response as well as an amplitude response for each pitch component, and this phase response is associated with "when" a sound arrives at your ears after the application of an electrical signal.
We all use the different "whens" of arrival to distinguish between direct and reflected sound in evaluating the spaciousness of a room and to locate sound sources. These abilities are based on the constant speed of sound, but imagine what would happen if the speed of sound depended on pitch. An instrument's fundamentals and harmonics would all be there, but they wouldn't arrive together as we normally expect. Some speakers do exhibit delays like this, and these are closely associated with phase response.
The exact relationship of phase and amplitude response is quite complicated and still open to final interpretation. However, it can be stated that two speakers with exactly the same amplitude response will not produce the same sound unless they also have the same phase response and that a speaker with a smoother amplitude response than a second will not reproduce more accurate sound unless the phase response is also well behaved. Highly important to a speaker's ability to produce accurate sound, when it has been properly equalized, is that of minimum phase change. A minimum phase change speaker is one which, when all amplitude response variations are removed by conventional resistance, capacitance, and inductance networks, has the minimum possible phase shift over the frequency spectrum. It is then like the proverbial piece of wire in its handling of signals. Conventional tone control equalization for balancing the amplitude response will also automatically balance the phase response for a minimum phase loudspeaker.
We will identify those regions of the frequency spectrum of each tested speaker where non-minimum phase reproduction occurs for direct sound. We must stress that this does not mean that a minimum phase speaker will automatically produce more accurate amplitude response than a non-minimum phase speaker. However, a non-minimum phase speaker will usually exhibit frequency response difficulties which can be associated with time delay effects which, in turn, cannot be corrected with conventional passive equalization.
Basic to our presentation of both amplitude and phase response is a spectrum analyzer, a Probescope Model SS-100, specially modified to become an adjustable bandwidth tracking filter which can be phase locked to any signal from 10 Hz to 100 kHz. The standard test setup uses a 1-in. Hewlett-Packard mic on axis one meter from the speaker being tested. A glide tone is fed to the speaker, and the tracking filter, tuned to the frequency of the glide tone, picks up the direct sound as received by the mic. Since the frequency bandwidth of the tracking filter is narrow and its center frequency changes rapidly to follow the glide tone, only direct sound is passed for measurement because reverberant sound will not have arrived before the filter changes frequency. Thus the amplitude response measured is anechoic. Phase response is obtained in a similar manner using a continuously variable phase shifter which permits either relative or absolute phase measurements.
To take into account the coupling of a speaker and room, without placing undue emphasis on room characteristics, a second measurement of amplitude is made using a wider bandwidth, or time window, so that early reflections from floor, ceiling, and-where appropriate-walls are included.
Tests below 100 Hz will not be performed here since the longer wavelengths of those lower frequencies would require inclusion of more room reverberation characteristics than are of interest.
The distance for this test will be three meters on axis, one meter above the floor, to approximate the usual listening position. If listening tests show that off-axis positions are preferred for stereo effects, these speaker arrangements will be used for this test.
The formats of these data is shown in Figs. 1 and 2. The amplitude response, identical to what is usually called the frequency response, will still be plotted in decibels. The phase response is plotted in electrical degrees relative to a pure transmission in which the air path delay from mic to speaker is removed. The convention chosen for measurement of phase shift is that a positive voltage applied to the positive (usually red) speaker terminal will produce an increase in sound pressure and assumes the speaker cone moves toward the listener with this polarity.
Evaluation of the amplitude curve is done in the traditional manner. Sharp peaks of more than 3 dB generally are more obtrusive than dips of the same size, because sounds traveling two slightly different distances can cancel by any amount even to total null at one frequency but cannot reinforce to give an intensity greater than their sum. Such peaks will generally tend to make background noises, such as record pops and tape hiss, stand out more than they should. The peaks indicate resonances and if extreme can actually cause ringing at a discernible high frequency and hangover at lower frequencies.
Sudden sharp dips in amplitude over a relatively narrow frequency range are often due to interference effects of much the same type as those occurring with natural sound in a room.
They may be relatively inaudible for direct sound, but other polar angles of radiation may not have the same frequency dip. The effect could then be a lateral shift for these frequencies when you listen for stereo program material in a relatively live room. Such interference effects may not be noticeable in those speakers which depend on room reflection but are to be avoided for speakers which rely heavily on direct sound for stereo or quadraphonic imagery.
The other major effect of amplitude response on reproduction of direct sound-change of timbre-can be estimated by visually smoothing a curve through the average values of response. One rule of thumb is to note the relative response around middle C (262 Hz), two octaves below (65 Hz), and four octaves above (4186 Hz). If the speaker is down more than about 3 dB at 65 Hz, it stands a chance of sounding "thin." The shape of the speaker's low frequency roll off and your pre-amp's tone control curves can indicate whether you can bring this up to a full bodied bass without incurring a bump of more than 3 dB at some intermediate frequency, such as A, at 110 Hz.
A look four octaves above middle C to C8 will indicate whether the principal musical partials of most instruments will be reproduced fully. Difficulties in this range will usually indicate a noticeable change in timbre. If the high end is rolling off, it will be dull, while a rise in response usually betokens brightness. The use of tone control and speaker curves also applies here.
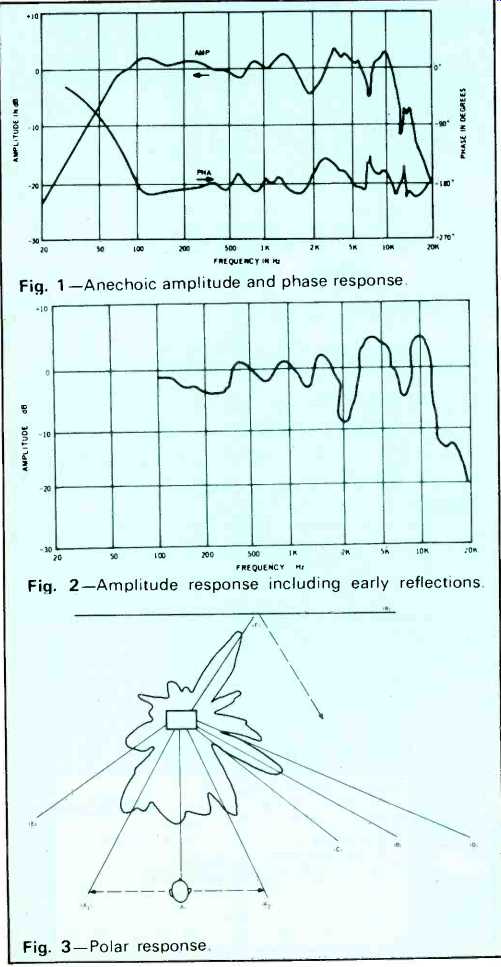
Fig. 1-Anechoic amplitude and phase response.
Fig. 2-Amplitude response including early reflections.
Fig. 3-Polar response.
Polar Energy Response
The success of good stereo and quadraphonic imagery depends largely on how much and what quality of sound is radiated at different horizontal angles. Since it is impractical to publish response curves for every possible angle and frequency, a polar plot will be made which, together with the frequency response, can give a reasonable feel for the dispersion you can expect in your listening environment. The basic test setup is much the same as that used for the amplitude and phase response tests except that a specially calibrated motor is used to turn the speaker on its axis and to indicate the relative angle. All fundamental frequencies, from 20 Hz to 20 kHz, are measured with constant input, and the total sound energy in this band is plotted as a continuous function of angle.
The polar plot is made under the assumption that speaker directivity becomes more prominent with increasing frequency.
Our plot is made on an equal frequency basis and means that the higher frequency variations show more prominently in this plot. Experiments using both an equal frequency basis and an equal octave basis have shown little significant difference in most speaker polar responses. The choice of an equal frequency basis is made because of its listening relationship with the speaker's reproduction of white noise.
A typical polar plot is shown in Fig. 3, looking down on the speaker from above. The general meaning of this speaker's polar response is that you can expect rather uniform sound anywhere within the dashed line from A1 to A2. The polar plot also warns us that there is a strong "finger" of response at position B, where high frequencies are more prominent than at C and D. However, since the overall level at B is about the same as at A, the sound at B is probably well balanced and quite listenable. The sound at E is down overall and because lower frequencies tend toward less directivity, this position's sound will probably be bass heavy.
The polar plot is made without reflected sound, and if your room were anechoic, it would tell you how to balance your system. However, we don't listen in anechoic chambers and here is where your listening room comes into the picture. If you have a hard wall, such as wood paneling or plaster, behind the speaker, as indicated by W, you can expect a strong reflection from the response of the back finger, F. This is fine if you want to use reflected sound to augment stereo imagery, but the polar plot shows that the non-symmetry of the back lobes will tend to move sound over to the left for this speaker.
If you want strong imagery of violins and brightness on the left, use this speaker in front of a hard surface, but don't expect balance on the right channel. By deciding where a speaker will be placed in relation to reflecting surfaces in your listening room, you can spot trends of reproduction and possible trouble areas. There are other considerations in choosing a speaker, but the polar energy response is one of the few you can tie to your listening room.
Harmonic Distortion
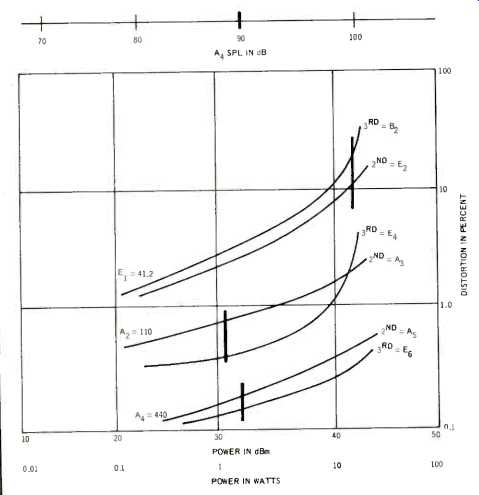
Fig. 4--Harmonic distortion.
We measure harmonic distortion by using a fixed frequency sine wave and plotting the second and third harmonic output as a percentage of electrical drive power. The test signals are the equivalent of pure flute tones with no harmonic structure of their own. The three test frequencies are: E1 = 41.2 Hz, corresponding to the lowest fundamental normally in musical material and the lowest tone in the usual range of the biggest systems; A2 = 110 Hz, well up in the musical spectrum and within the usual range of the smaller systems, and A4 = 440 Hz, A above middle C and a reference pitch generally known while also at or near the crossover frequency in many systems, thus a spot where trouble can easily take place.
The second harmonics are: E2 = 82.4 Hz, A3 = 220 Hz, and A5 = 880 Hz respectively, while the third harmonics are extremely close to their musical fifths: B2 = 123.5 Hz; E4 = 330 Hz, and E6 = 1320 Hz. These tones not only encompass the lowest four octaves where distortion is most prevalent but can be meaningfully related to sounds with a conventional musical basis. The second harmonic distortion is indicative of gap misalignment and field nonuniformity, and third harmonic distortion is tied to a voice coil driving out of the linear region of the gap or otherwise bottoming out. Higher order harmonics are seldom found unless physical deformation occurs, which is usually audible as a buzzing or a similar effect. The use of drive power will give you some idea of how much amplifier you need before the speaker becomes sonically improper for steady signals.
Figure 4 is a typical plot for harmonic distortion. The vertical axis is the percentage of distortion of each partial. The horizontal axis is amplifier drive power in both dBm, which is a decibel power ratio above one milliwatt, and its equivalent in watts. Thus one watt is +30 dBm. This power level is not the actual volt-amperes delivered to the speaker, but is the level which a constant voltage amplifier would deliver to a resistor with a value equal to the rated speaker impedance.
This is done so as to be more consistent with the rated capabilities of amplifiers.
There are three sets of curves, one for each test frequency. Generally the lowest pitched test tone will have the highest distortion. For the example shown, a one-watt level of the tone A2 will produce 0.8% A3 and 0.6% E4 as additional acoustic outputs. A low organ pedal note of E1 will at the same drive produce 1.5% E2 and 2% B2. Of course the acoustical output at E1 is less than A2 at this electrical drive power because, as indicated in Fig. 1, the speaker is rolling off. If you were to use full bass boost available on many pre-amplifiers to bring up the pedal note, you might be able to add 12 dB drive to E1 relative to A1. Unfortunately, this would take you from 30 dBm to 42 dBm and the organ pedal note would now have 10% E1 and 15% B1 as distortion partials. This note might produce impressive sound pressure in your room but is no longer musically accurate.
The ratio of third-to-second harmonic distortion is a crude estimate of driver capability. The speaker shown is running out of steam at both A2 and E1 for power levels above 10 watts as shown by the pulling away of third above second harmonic distortion. A smooth increase of second-harmonic distortion with level is usually a satisfactory indication, but sudden breaks in the curve may indicate non-linear suspension or misalignment of the driver.
Before condemning a speaker for bad distortion, it is necessary to know what sound pressure level (SPL) is actually produced at each fundamental pitch component. One watt into some speakers can be a pleasant level while the same power into another speaker can break both windows and leases. An intensity level of 1 watt per square centimeter corresponds to 160 dB SPL for a plane wave of sound. If one watt of acoustic power were radiated uniformly from a point source, the intensity level one meter away (which is our test distance) would be 109 dB if we approximate the spherical wavefront with a flat wavefront. This is a very high level and above the capability of some speakers.
For distortion SPL comparisons, measurement is made of the speaker power required to produce 90 dB one meter on axis. This is rather loud but within the capability of almost every speaker system and corresponds to an omnidirectional source of about 11 milliwatts or 11 dBm. The electrical power required to produce this level for each fundamental will be shown as bars drawn through the corresponding harmonics, as shown in Fig. 4. This lets you convert from amplifier power level to the sound pressure level in decibels by sliding the curves sideways until the bars line up with each other and lie over the 90 dB SPL value.
You can use these data in several ways. First, the relative distortion produced as you equalize the speaker for flat output from E1 through A4 is immediately apparent. Thus for our example a 90 dB level at A1 now has low distortion down to A2 but enormous distortion at E1. Conclusion: If you like true pipe organ sound, you probably should not consider buying this speaker.
The second way you can use these data is to find out how much amplifier power is required to produce the level and quality of sound you prefer. For example, the unequalized speaker of Fig. 4 will show audible distress for single low and mid bass sine waves at about 20 watt level. Composite material with many partials will probably gobble up many times that level before you hear the speaker giving up, so a 60 watt amplifier might bottom out before you note speaker distress at SPL's as high as 100 dB.
Intermodulation Distortion
Speakers also suffer from intermodulation distortion. This occurs when one signal is modified by another because they share the same driver. Intermodulation can occur due to either transfer function nonlinearity, of the same nature as that producing harmonic distortion, or relative motion of the driver causing a Doppler "warbling" of one signal by another.
Since single speakers in a system usually do not cover the entire frequency spectrum, it is not possible to use conventional amplifier practice with tones of 60 and 6000 Hz or any two tones rigidly fixed in frequency. The greatest problem occurs in the bass driver and is the effect of very low frequencies on higher frequencies. Two test tones of equal electrical drive level are used, 41.2 Hz, corresponding to E1, and either 440 Hz or one half octave below the woofer crossover frequency, whichever is lower. Sidebands about the higher frequency due to 41 Hz are measured and the total sideband energy as a percentage of the energy at the higher frequency is presented at one or more electrical power levels.
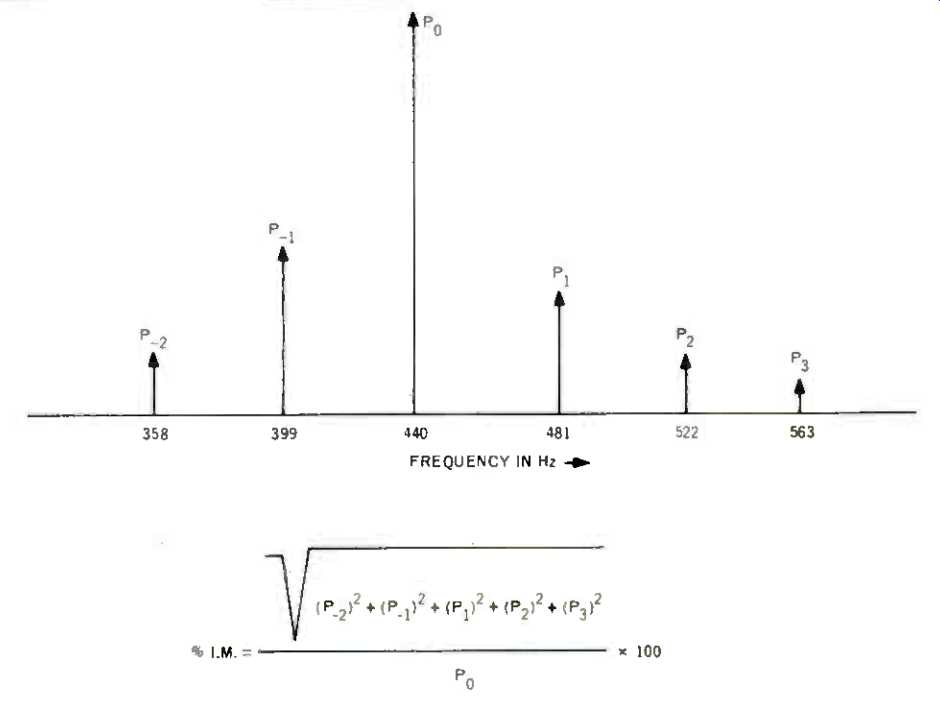
Fig. 5--Method of calculating IM distortion.
An example of what this means is shown in Fig. 5. The signal output in the vicinity of 440 Hz is shown along with the intermodulation products due to 41 Hz. The level at 440 Hz is acoustically measured prior to the addition of 41 Hz and used as reference. Then 41 Hz is added at the same electrical drive level as 440 Hz and the pressure magnitude of each sideband is measured. The total energy in the sidebands is calculated and then presented as a percentage of the unmodulated 440 Hz. This is a one-number power measurement which is not suitable for distinguishing frequency modulation from amplitude modulation, and equal electrical drive power for each frequency is used to provide comparison for cleanness of sound when driven from a "flat" program source.
Certain special cases may arise when other intermodulation tests need to be performed. One example might be the case where an overly compliant woofer may badly wobble in and out of the linear gap region due to subsonic signals from an amplifier when bad record warp exists. While this is not directly the fault of speaker manufacture, it can give sonic coloration and some measure of this is made.
The guidelines for evaluation of distortion measurements are simple: The better speaker will have lower distortion at a given sound pressure level.
Signal Suppression Test
We know that most speakers can handle music and voice at power levels approaching the peak clipping capability of even super power amplifiers, yet if we try a sine wave at what we think these crescendo levels to be, we may char the speaker. We have already outlined two tests using sine waves, harmonic and intermodulation distortion. This third distortion test is intended to disclose how well musical crescendos may be handled by a speaker.
The concept behind this test is that the highest level signals which you normally ask a speaker to reproduce, such as cymbal crashes, traps, and even the human voice, have a high peak-to average intensity ratio. A measure of a speaker's ability to handle these is made by the amount of intermodulation distortion produced on a moderate signal by a random crescendo with peak-power levels approaching 1000 times (30 dB) the signal to be tested. That may appear to be an unrealistically high ratio but experience on live sounds picked up by a wide range condenser mic shows this ratio is not unusual.
Two test signals are used for this measurement. The first is a flute-type tone with a musical basis, such as 440 Hz. The second is white noise, which treats all frequencies uniformly and is not only reproducible in any laboratory but is a good all-around representation of many sound processes.
When random noise modulates a tone, it produces side bands about that tone. The sonic effect is random wobbling of the tone's pitch and amplitude-sort of a combined vibrato and tremolo. What we are trying to measure is how much effect is produced on regular program material by a sonic outburst from an independent signal of higher level.
We do this by measuring how much energy in the flute tone is spread into sidebands by the noise burst, by use of a very narrow bandwidth filter before and during the time the noise is applied. The level at which one decibel suppression of the tone occurs in a 1 Hz band is used as the indication of power-handling capability when the average noise is 20 dB higher than the average sine wave power. The peak noise voltage (three sigma)* across the speaker terminals is then used to indicate the amplifier capability to drive the test speaker to this level.
This test is strictly an indication of how inner musical voices are modified by loud random signals and is not a direct measure of the speaker "flatting out" on the loud signals, which is presently determined by looking at the mic pick-up with an oscilloscope.
Transient Response
What we mean by transient response is the ability to produce pressure wavefronts which accurately follow electrical input as a function of time. This is the "clock on the wall" counterpart of the frequency response. Just as the sine wave is the basic signal for determining frequency response, the basic signal for determining transient response is the impulse, a sudden sharp momentary release of energy which should produce a sharp sound ordinarily described as a "crack." A typical transient response of a speaker is shown in Fig. 6.
Figure 7 is a computer-based plot of the time spread of sound intensity derived from the impulse response in Fig. 6.
The vertical axis is relative sound intensity in decibels and the horizontal axis is time in milliseconds. This plot shows the actual arrival times of signal energy components relative to the times they should have arrived in order to constitute perfect reproduction for all components in the frequency span measured. If a woofer woofs or a tweeter tweets at a later time than optimum, this will show as some form of energy spread with time.
A speaker which has perfect reproduction of every signal component in the tested frequency range will have the signal energy hump shown in Fig. 8. This tells us that every signal component, regardless of its pitch, duration, or intensity, arrived at exactly the right time with the correct amplitude and with the correct phase.
However, real world speakers do not have perfect reproduction and differ considerably from one another in transient response. For certain pitch components, a speaker may take a little extra time to get started while responding quickly to others. Instead of a photo finish with all the pitch components arriving at the same time, the race is always won by some and always lost by others regardless of program material. The result is a time delay for some frequencies, which results in a distortion or loss of the "edge" of those sound qualities we associate with real life. (The technical interpretation is somewhat more complicated because some pitch components produce a sound that is equivalent to breaking up into a multiplicity of late arrivals.) Transient distortion is measured by applying a special signal to the speaker terminals which at one moment in time has all possible pitch components of interest. At a point one meter distant the entire sound spectrum is measured, including all late arrivals, and we clock the total energy in all pitch components at each moment of arrival. This is the energy-time plot of Fig. 7.
If a speaker spreads in time the energy of what should be an impulse, this will show in the measurement. A speaker with internal reflection of improperly mounted or crossed over drivers will produce a staccato smear in time which will show up as multiple energy humps for the moment when each signal arrives. Quite often, as an example of this, you may see a second bump a millisecond or two after the first arrival for small cabinet-mounted speakers. This is caused by the sound from the back of the cone penetrating into the box, reflecting from the rigid box back-wall and coming out through the relatively transparent cone as a late partner to the first direct sound.
To aid you in visualizing how much time smear may exist, we will-when practicable-indicate what portions of the speaker are involved. This is shown in Fig. 7 as the side view of the speaker box with the front of the box at 3 milliseconds, corresponding to the one meter distance, and the rear of the box at the position corresponding to the time it would take sound coming from that spot to reach the microphone.
With this measurement you can begin to sense the sonic effect of a particular speaker's reproduction of transient sounds. The amount of actual time smear for the high pitch components, which give liveliness, is usually small enough so that we can't perceive them as separate entities; all we know is that there is something which separates the reproduced sound of many speakers apart from that live sound.
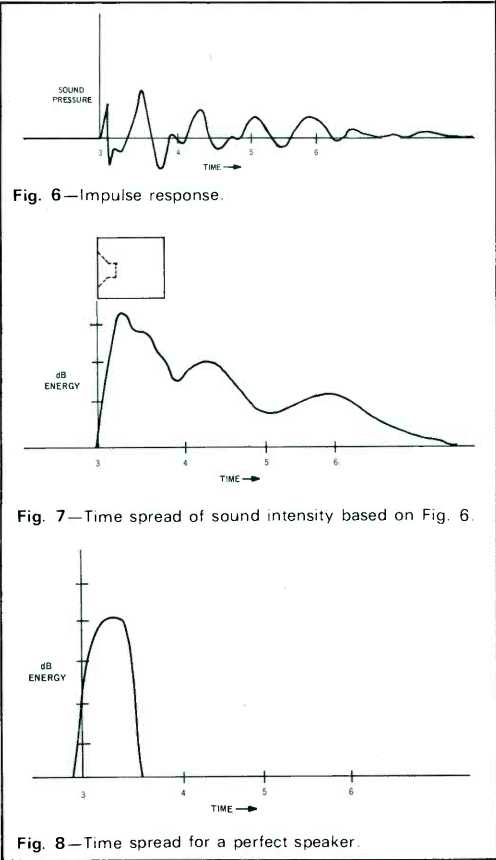
Fig. 6--Impulse response.
Fig. 7--Time spread of sound intensity based on dB
Fig. 8--Time spread for a perfect speaker.
Equipment Notes
As mentioned above, these tests use several sophisticated pieces of research equipment, and since some have no commercial counterpart, a word of explanation is in order. The Probescope SS-100 spectrum analyzer has been modified to include additional capabilities as either a tracking filter or time delay spectrometer (TDS). As a tracking filter, it can be phase locked to any signal from 10 Hz to 100 kHz, and the fundamental, second, third, fourth, and fifth harmonic automatically locked on by preset switching. The design allows its center frequency to be phase locked to Mf ± fD where f is the fundamental frequency of any periodic input, M is a selectable integer from 1 to 5, and fD is a synthesizer offset frequency on 0.1 Hz steps to 999.9 Hz.
The time delay spectrometer modification was the subject of three AES papers which should be referred to for details.
(See "Acoustical Measurements by Time Delay Spectrometry", J.A.E.S., Oct., 1967, Vol. 15, No. 4; and "loudspeaker Phase Characteristics and Time Delay Distortion, Parts 1 & 2," J.A.E.S., Jan. & April, 1969, Vol. 17, Nos. 1 and 2.)
The output of the SS-100 occurs at its i.f. frequency of 225 kHz, which is synchronously heterodyned to d.c. in quadrature channels. These are time-weighted in accordance with either a rectangular or a raised cosine multiplication, then processed through sampled integrators. When the TDS mode is used for test, the output of these integrators corresponds to the Fourier transform of the frequency spectrum signal, and this is used for the energy-time plot.
For the polar energy response, the d.c. heterodyned i.f. signals are squared and then integrated for the period of frequency sweep. In the phase locked tracking falter test mode, the output is a matched filter. With a one second gate, this matched filter has a noise bandwidth of 1 Hz and the mean square output is logarithmically calibrated for reading the signal suppression for the speaker test where noise is used.
A second nonstandard piece of equipment is a normalizing gain pot, which was made by ganging two precision Daven logarithmic attenuators on the same shaft with a potentiometric switch. A clockwise rotation increases the gain in the transmit channel and decreases the gain in the receive channel by an exactly compensating amount. The test equipment then sees a constant level regardless of the test level. This allows a single setting for 100 percent level in harmonic distortion, and the tracking filter can plot out distortion on the X-Y recorder at any convenient rate. The full range of the normalizing pot is 32 dB with 2 dB steps and a worst case error of±0.3 dB. For speaker impedance testing, a General Radio 1304A oscillator with a 908 dial drive is used as a constant voltage source sweeping 20 Hz to 20 kHz. This is made into an effective constant current with a 5K resistor. The voltage across the speaker is processed by the phase locked spectrum analyzer and displayed on a Moseley X-Y recorder. If more exact and complete impedance measurements are required, a General Radio 1603 Z-Y bridge is used, with measurements beyond 20 kHz normally made with a Hewlett-Packard 200 CD oscillator or a 606A signal generator.
Polar energy is tested by first mounting the test speaker on a special motor-driven tripod with a precision sine-cosine potentiometer mounted on the azimuth drive. The TDS output, a sweeping sine wave, is level set through Hewlett-Packard 350B attenuator, then through the normalizing transmit potentiometer to the power amplifier. A Tektronix 310A oscilloscope is used to monitor the speaker drive at all times.
A Hewlett-Packard 1-in. condenser capsule is used for microphone pickup, and its preamplifier output fed to a Hewlett-Packard 450A line-driving amplifier back to the normalizing receive pot. A Ballantine 320 true RMS meter is used as a combined acoustic level calibrator and monitor amplifier to drive the TDS input. The display on the TDS is, in fact, the frequency response of the speaker and this setup is used to check response as a function of polar angle. The frequency response is squared, integrated, and driven to the sine-cosine pot to be split into rectangular coordinate channels. This is returned to the spectrometer and processed for the X-Y recording, which is now in polar format with logarithmic radius.
The frequency response setup is identical to the polar energy setup except that several means of display are used.
First, the TDS display is photographed with linear frequency scales for reference. Second, a Hewlett-Packard 130C X-Y oscilloscope is set up to display logarithmic frequency coordinates. Third, a General Radio 1304A oscillator with a dial drive is used to drive logarithmic frequency coordinates on the X-Y recorder and the vertical is a sample and hold output obtained upon coincidence of sweeping frequency and 1304A frequency.
For harmonic distortion measurements, a Heath AG-9A low distortion sine wave oscillator is used to drive the speaker through level setting attenuators and a power amplifier. The Tektronix 310A 'scope is used to monitor voltage across the speaker, while the mic is placed close enough to the speaker to be in the near field and measure the sound pressure in the harmonics prior to far field polar pattern wave front deformations. To reduce capsule distortion products due to higher SPLs, the capsule is desensitized by capacitive loading prior to amplification.
The normalizing pot keeps the receive level constant independent of speaker power. A Ballantine 320 voltmeter is used as a calibrated amplifier which feeds a Heath HD-1 harmonic distortion analyzer. This is used only as a tunable notch to reduce the fundamental component and increase the dynamic range of the spectrum analyzer. A Hewlett-Packard 130C oscilloscope monitors the analyzer input. The spectrum analyzer is first phase locked to the fundamental and the HD-1 placed in the "all-pass' position. The fundamental component with 1 watt drive is used to normalize the spectrum analyzer to 100 percent. The HD-1 is then set to "notch" and adjusted to minimize spectrum analyzer reading.
Measurement then consists of locking the spectrum analyzer to the desired harmonic and clicking the normalizing attenuator through its 2 dB steps. The X-Y recorder is synchronously stepped with the normalizing potentiometer so that readings can be made quickly.
For intermodulation distortion, two sine wave oscillators, the General Radio 1304A and Heath AG-9A, are adjusted to the proper frequencies and have their outputs added in equal ratio and sent through precision attenuators and a power amplifier to the speaker. Mic output is amplified, normalized, and measured by a Hewlett-Packard 300A wave analyzer. The higher tone, which is to be checked for intermodulation by the lower tone, is set to 100% on the analyzer at the lowest practical speaker drive level. It is then tuned to the appropriate sideband and manual readings taken at 2 dB power increments. When all significant sidebands and power level readings have been taken, the data are reduced by use of a Hewlett-Packard Model HP-35 calculator.
The signal suppression setup is similar to that for inter modulation except that a General Radio 1390B noise generator is used with a sine wave oscillator. The normalized microphone output is amplified and preliminary filtering made through the Hewlett-Packard 300A wave analyzer set to the frequency of the tone. This is done to reduce the dynamic range requirements of the subsequent filtering. The i.f. of the 300A (20kHz) is phase locked by the spectrum analyzer which uses a one second gate to implement a matched filter detector. The mean square output of the matched filter is monitored on a meter and sent to a recorder.
At the lowest practical drive level, the matched filter is set to 0 dB with the sine wave. The noise is then added at 20 dB higher average level than the sine wave. The normalizing pot is stepped in 2 dB increments until either a 1 dB drop is noted in the matched filter or amplifier clipping occurs. The peak speaker voltage for three sigma noise peaks is then used as the peak amplifier rating needed to produce this 1. dB suppression.
For the time-energy plot, the frequency response is taken by the TDS. This produces one complete spectrum per second. The frequency response is multiplied by Hamming spectrum weighting and sent to a processor which takes the continuous Fourier transform of this weighted spectrum. A control unit selects the proper synthesizer digits to correspond to the appropriate time epoch for each one second spectrum and digitally positions the horizontal axis on an X-Y recorder to correspond to this epoch. The in-phase and quadrature Fourier transform are squared, logarithmically amplified, and used as the recorder Y axis drive. The control unit steps the synthesizer and advances the recorder once per second from starting epoch to final epoch. A maximum of 256 steps may be taken in one record.
Conclusion
Our discussion has concentrated on the laboratory tests because these are reproducible from one time to the next and one facility to another. It is still our policy that final judgment of sound reproduction must come from a critical listening test where human values of perception are strongly dominant. The listening test will therefore continue to be performed as it always has. The reason we perform laboratory tests is to make available to you impartial measurements of how well a speaker does its job and we do this in numerical data form for easy and valid comparison of one speaker with another.
(Audio magazine, Nov. 1973; Richard C. Heyser)
Also see:
Speaker Tests Phase Response (Dec. 1974)
Speaker Tests--Impedance (Sept. 1974)
Fundamentals of Loudspeaker Design (Dec. 1973)
= = = =