By Gerald Stanley
[Gerald R. Stanley is Head of Research and Resources for Crown International, which makes the System 10 TEF computer, a dedicated unit for Time Delay Spectrometry (TDS) measurements. ]
In the fall of 1967, an important chapter in the history of audio measurements began with the unveiling of Time Delay Spectrometry (TDS) at the 33rd Convention of the Audio Engineering Society by its inventor, Richard C. Heyser [1].
TDS allowed the response of loudspeakers, and other systems that are noisy and reverberant, to be quickly and accurately analyzed in situ. Each signal, ranging in time from the direct sound to the reverberated, could be studied independently of all other signals having different propagation delay times.
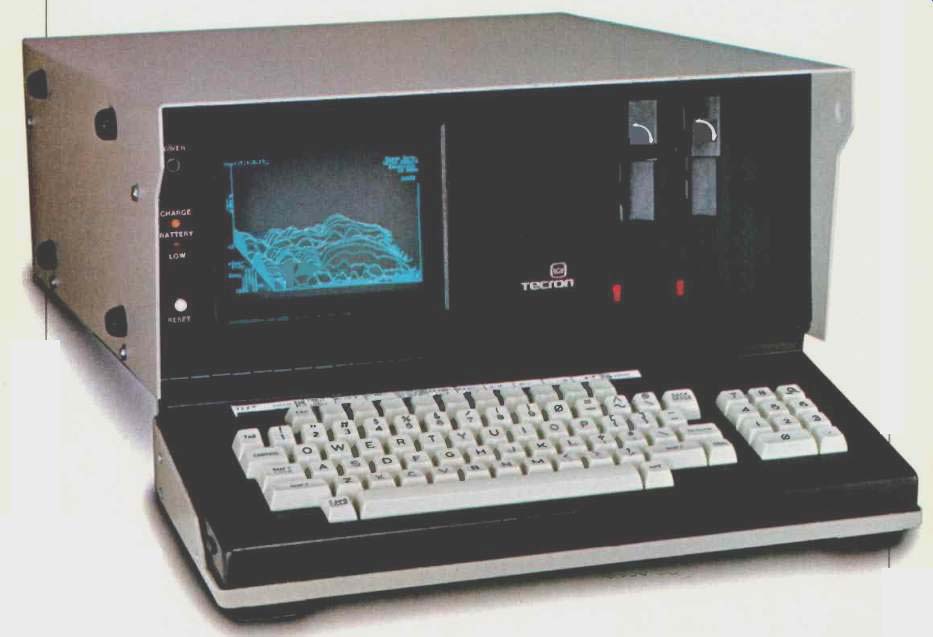
above: Crown System 10 TEF computer
Audio readers have been privileged to have numerous loudspeaker reviews by Dick Heyser. TDS and other ingenious techniques have revealed much about speaker behavior [2 to 7].
A simple conceptualization of TDS is that of an FM transmitter of variable frequency scanning the band of interest, with a precisely delayed receiver tracking the transmitter and observing the transmission's response.
TDS can also be visualized with the aid of Fig. 1. The line AB extending from (t1, f,) to (t2, f2) represents the sinusoidal test sweep signal. Delayed in time by td, a narrow-band receiver tracks the test signal to observe any signal that appears with a delay of td.
This is represented by line CD. The dashed lines which parallel AB and CD represent delayed responses of the system under test to the stimulus AB. These signals, except the one at CD, are all rejected by the analyzer.
An implementation of the measuring apparatus is shown in Fig. 2. This would typically be made by modifying a commercial spectrum analyzer, adding some external circuitry, and using a Fast Fourier Transform (FFT) analyzer, storage oscilloscope, phase meter, and frequency synthesizer.
When the JAES published the paper on TDS, I studied the paper and the possibilities of implementing such instrumentation. Unfortunately, the required instrumentation was at that time very expensive and well beyond the means of most of its potential users.
This was not to deter a few determined individuals. Having obtained a license to make the measurement (the measurement is patented and held by Cal. Tech. and Jet Propulsion Laboratory), these individuals modified and interconnected the needed instruments.
As much as $50,000 worth of complex equipment was often required for a fully implemented TEF (Time, Energy, Frequency) measurement.
Some might ask, why make such expenditures if all that is needed is to program a microprocessor to pulse the system and then Fourier analyze the system output at progressive delays? This technique is well known and can be cheaply implemented with microprocessors plus analog-to-digital conversion hardware.
The answer is that such simple techniques perform well in textbooks but rarely so in the real world. Noise and distortion are not easily overcome in such systems, and valid measurements take very large amounts of test averaging and test time. Clearly, some insight into the problems of real-world measuring is required.
Scientific observations may be classified as either passive or active measurements. In a passive system, no deliberate disturbance to the system being measured is provided except for the extraction of the amount of energy necessary to activate the observation's sensors.
TDS is an active measurement that provides a stimulus (external energy input) to the system under observation.
Active measurements are preferred to passive measurements if the energy needed to perturb a system is safely and reasonably available. For example, it is not possible to test theories of stellar composition by extracting a core sample from the center of the sun.
The quality of an active measurement can be classified by the degree of success obtained in the following: The stimulus energy should be directed at the desired characteristics of the system you wish to study. For example, the response of an elephant to a tiger cannot be ascertained by presenting a kitten (or even 500 pounds of kittens) to the elephant.
The greater the amount of such well-directed energy that can be delivered to a system without altering its nature (i.e. breaking it, making it perform in a nonlinear manner), the larger the valid observed effects can be.
The more the observation (analysis) is able to distinguish the results of the stimulus from other activities of the system (noise and distortion), the more valid the observation, i.e. the greater its signal-to-noise ratio.
If a measuring technique is deficient in any of these aspects, the loss of observational quality cannot be recovered by any means other than possibly increasing the amount of testing, and thus the total energy used to test.
The success of TDS is a direct result of its excellence in all of the above areas [9]. Audio systems are characterized by their useful bandwidth when using frequency-domain models. This means that audio systems should be subjected to energy which stimulates those frequencies desired for study and no other. In TDS, a linear FM sinusoidal sweep is used as a stimulus, and the resulting frequency range covered is the range swept.
TDS presents the test stimulus throughout the entire observation time and thus accumulates a large total amount of energy, all of which is useful to the test. The test signal also presents the system a low crest factor (peak to rms ratio) of the test signal.
High crest-factor signals evoke increasingly nonlinear behavior in many systems, such as loudspeakers, and may make the observations invalid as observations of supposed linear behavior.
The TDS observation system has a matched receiver which is tuned to accept the desired stimulus and simultaneously reject noise and undesired distortion products. (Note that the distortion can be selected and the linear responses rejected in TDS systems if so programmed.) Acoustic test environments are noisy. Even in an anechoic environment (not permissible if the object of the test is a listening space), the noise of the microphones is non-trivial if dynamics equivalent to human hearing are required.
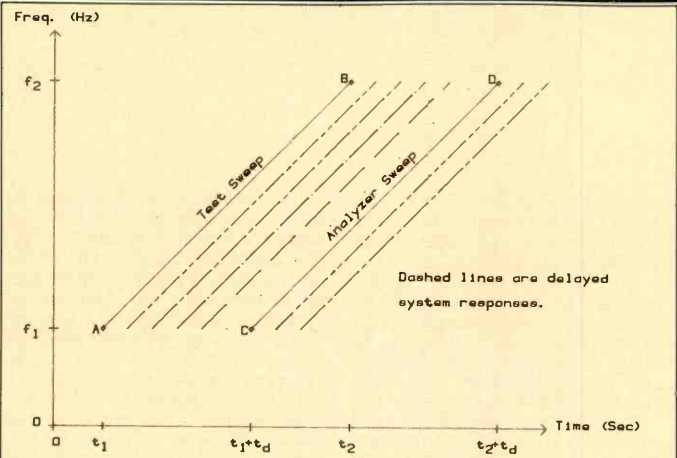
Fig. 1--TDS on the frequency-time plane.
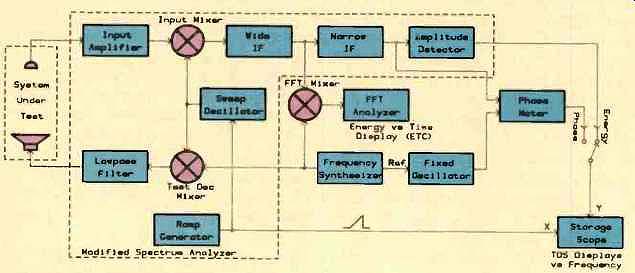
Fig. 2--TDS implementation by traditional means.
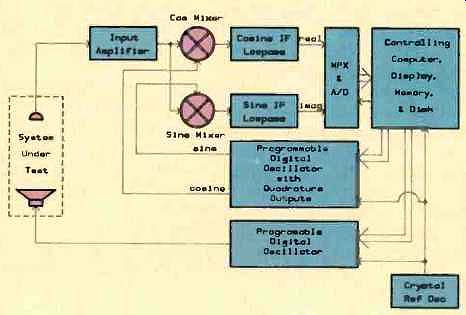
Fig. 3--Block diagram of the TEF 10.
It is not unusual to make TDS measurements in noisy areas with equipment running and people talking without any need to average multiple measurements. The consequence is fast and accurate analysis in the real world.
In 1978, Don Davis of Synergetic Audio Concepts, who was actively involved in licensing and training TDS users, approached Crown International and myself to develop a cost-effective TDS analyzer. He was not then aware of my previous interest in TDS and the (by then) bulging file of Dick Heyser's papers in my file cabinet [1 to 8]. It has been rightly said that inspiration is more perspiration than revelation. The development both of TDS by Dick Heyser and of the TEF System 10 computer are both cases in point.
What is now obvious to the casual observer was not so at the beginning.
The first design attempts were directed along the lines of previous implementations. Not only must the proposed instrument be less expensive than its forebears, it must be in one portable box small enough to fit under an airline seat and flexible enough to support a variety of computations, such as Hilbert and Fourier transforms.
The future demands on an emerging technology dare not be excessively confined by hardware constraints.
It soon became clear that a general-purpose computer system with a large amount of mass storage was required.
Only with software and floppy disks was the requisite flexibility and storage possible. The standard densities used in home computer disks would not be adequate, however, as some measurements would store over 64K (65,536) bytes with each task. Subsequently, 1 megabyte mini-floppies were chosen.
It is necessary to perform a 1,024 point, 16-bit FFT computation to produce what is known as the Energy Time Curve, or ETC. The ETC is the magnitude of the impulse response and doublet (a figure derived by a Hilbert transform of the impulse response). To be user-acceptable, the computation must be done in less than 2 seconds. By using an LSI math processor in conjunction with a 4-MHz, Z80A microprocessor, it has been possible to do the FFT in approximately 0.6 second. (Z80 is a registered trademark of Zilog Inc.) The solution is shown in Fig. 3. Not one but three Z80As are used to implement the TEF analyzer. The test signal and analyzer signals are each created at the actual frequencies of use by digitally computing the instantaneous phase 70,175 times per second. Sixteen-bit computations of phase are performed using downloaded programs which create linear FM sweeps.
The analyzer is d.c.-coupled and can measure from d.c. to 31.6 kHz. By using two sweeps (in quadrature), it is possible to accurately measure response at d.c. This capability was not available previously without computing capacity.
The computer implementation is very flexible in that the phase angle between test and analyzer oscillator signals, as well as the time delay, can be programmed.
The needed time delay between test signal and analyzer signal is provided by software routines which are executed before the oscillator routines begin.
Time delay is adjustable in 1-microsecond steps from 0 to 240 seconds. This constitutes a much wider range of delay than had been previously possible.
The intermediate frequency (i.f.) amplifiers are not the band-pass amplifiers of traditional spectrum analyzers, which do not allow sufficiently narrow bandwidths for high time-resolution, slow-sweep measurements. Instead, they are low-pass filters. Very narrow, Gaussian-shaped bandwidths are possible without using difficult-to-control, temperature-compensated crystal band-pass filters or multiple conversion techniques. The functional O of Fig. 2's filters would otherwise need to be in the millions to construct a bandwidth of 0.115 Hz, which is the minimum bandwidth of the TEF 10. The TEF's maximum Gaussian bandwidth is 20 kHz.
The analyzer is truly portable, as it contains batteries and a charger. Operation can continue for 15 minutes after power loss, making the unit both brownout-proof and useful for quick measurements in environments where there is no external power. In vehicles, or wherever else 12-V d.c. is available, the unit may be powered from that instead of a.c.
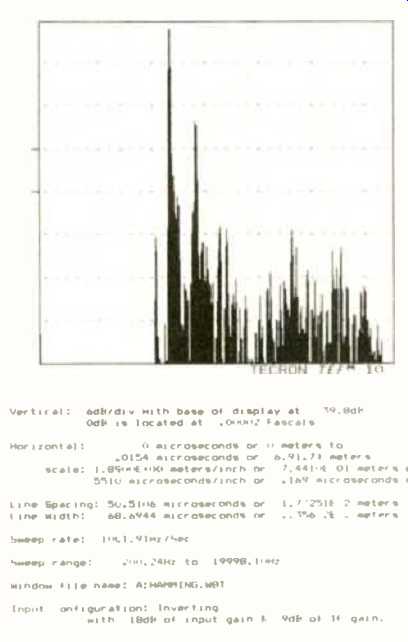
Fig. 4--An Energy-Time Curve (ETC).
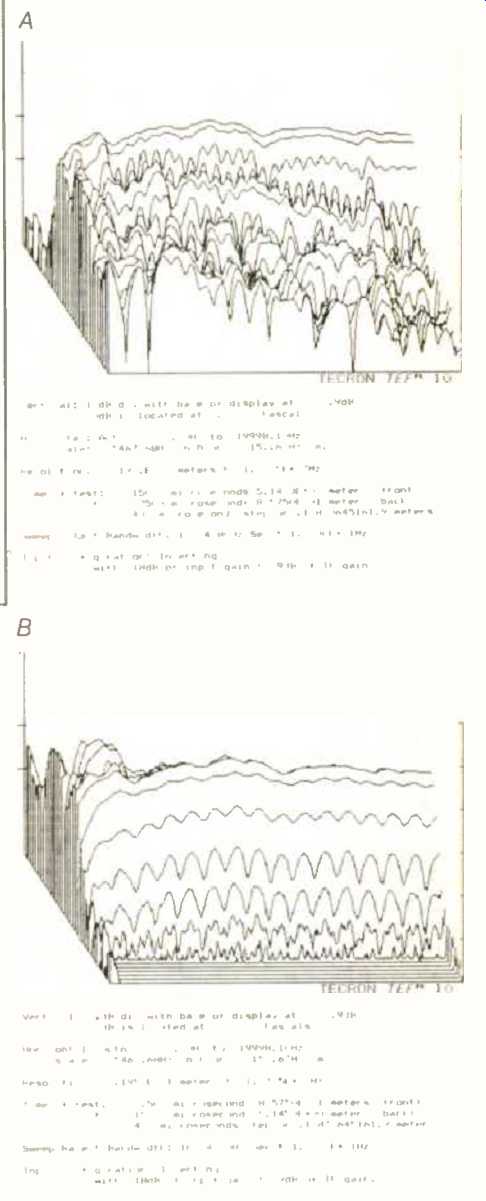
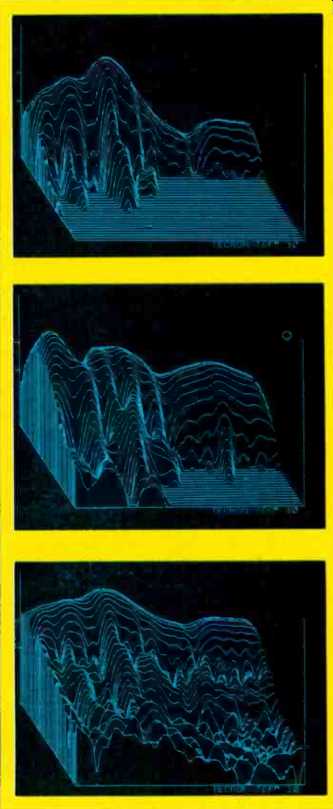
Fig. 5--Energy vs. time and frequency, with early arrivals in front
A) and late arrivals in front (B).
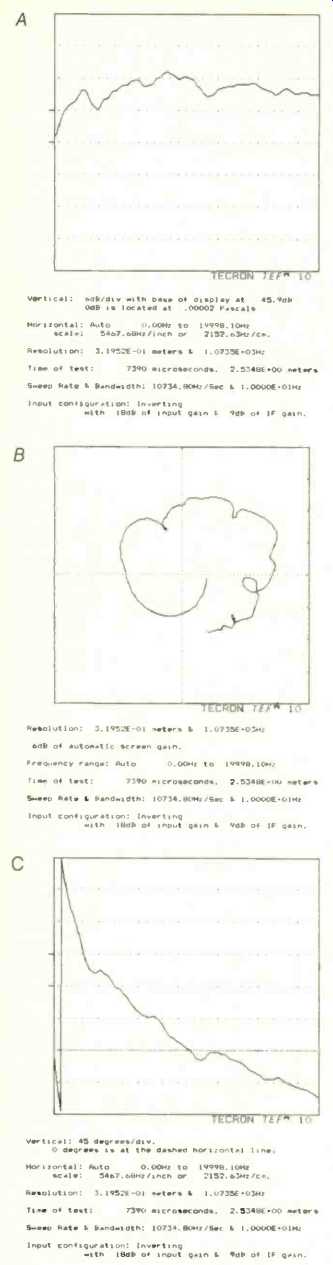
Fig. 6--Three interpretations of one direct-arrival sweep: Energy vs.
frequency (A), Nyquist display (B), and phase vs. frequency (C).
The TEF System 10 computer is not organized like traditional instruments.
Internal switching and adjustments are all computer-controlled. Operator control is via a QWERTY (typewriter-like) keyboard. A standard disk operating system, CP/M, is used, which also allows the TEF 10 to use a wide variety of common programs, including word-processing and several computer languages. (CP/M is a registered trademark of Digital Research Inc.) The TEF software uses a menu-directed approach, so "controls" not relevant to the present mode of operation are not visible to confuse the beginning operator. An operator's manual is available on line. Every menu has a help file which may be read and edited if desired.
The data is documented automatically. Data and settings are saved with each measurement. Setups may be loaded from disk and, upon beginning measurement, the last settings used are restored from disk. The operator may add text remarks to the measurements by using a built-in screen editor.
If calculations are needed, an RPN (Reverse Polish Notation) calculator program may be brought on screen.
The graphic data display has a resolution of 256 by 512 pixels (picture elements) on a high-resolution, 7-inch green CRT. Data on the screen can be output to a dot-matrix printer to yield hard copy, as shown in Figs. 4 to 6.
(Figures 4 to 6 are reproduced half of original size; one inch here is two inches on original drawing.) Figure 4 is an Energy Time Curve of a stereo system. The display is of energy (shown in dB on the vertical axis) versus time (on the horizontal axis). The highest feature is the direct signal arrival. To the right are reverberant signals, with the dominant reflected signal being from the floor: A small, pre-direct-arrival signal appears to the left of the main signal arrival, approximately 30 dB down. This was caused by an unintentional panning of the test signal into the undriven stereo channel, whose speaker was about 11 inches closer to the listening position than the test channel's speaker. This signal is clearly seen, due to the ETC's large dynamic range.
Data may be displayed in a variety of ways. Figure 5A shows energy versus time and frequency for the system of Fig. 4. The horizontal axis is frequency, and the depth axis is time, with early arrivals shown in front. Figure 5B is of the same data with the time axis reversed. Note that comb-filtering effects are clearly seen when reverberant signals are combined in common time slices. The pre-direct-arrival signal is also seen as ripples on the front of the direct-arrival response. Any one of the 32 sweeps which compose this display may be shown individually.
Figures 6A to 6C show individual interpretations of a single sweep of the direct-arrival signal from one tested system. They include energy-versus frequency, Nyquist (real-versus-imaginary), and phase-versus-frequency displays, respectively. The frequency axis may be shown as log frequency; however, linear display is more often diagnostic in allowing the recognition of periodic (comb-filter) behavior.
Equalization of sound systems has historically been done by using third octave real-time analysis. Such methods equalize the averaged response of the direct and reverberant sound fields and not the more pertinent direct-arrival response. The total time-blindness of such methods has sometimes produced results where the system sounded better without the equalization. At no time was it possible to rapidly quantify the contributions of multi-pathed acoustic signals. It is no longer necessary to accept these measuring limitations.
The marriage of TDS and a computer have made real-world, time-frequency domain analysis more than a gleam in the eye of a theoretician. After 16 years, TDS has arrived.
References
1. Heyser, Richard C., "Acoustical Measurements by Time Delay Spectrometry," Journal of the Audio Engineering Society, Oct. 1967.
2. Heyser, Richard C., "Loudspeaker Phase Characteristics and Time Delay Distortion," JAES, Part I, Jan. 1969; Part II, April 1969.
3. Heyser, Richard C., "Determination of Loudspeaker Signal Arrival Times," JAES, Part I, Oct. 1971; Part II, Nov. 1971; Part Ill, Dec. 1971.
4. Heyser, Richard C., "Breakthrough in Speaker Testing," Audio, Nov. 1973.
5. Heyser, Richard C., "Speaker Test Impedance," Audio, Sept. 1974.
6. Heyser, Richard C., "Crescendo Test," Audio, May 1976.
7. Heyser, Richard C., "Time and Frequency in Loudspeaker Measurements," Audio, July 1977.
8. Heyser, Richard C., "The Delay Plane, Objective Analysis of Subjective Properties," JAES, Part I, Nov. 1973; Part II, Dec. 1973.
9. Biering, H. and O. Z. Pedersen, "System Analysis and Time Delay Spectrometry, Part I," Bruel & Kjaer Technical Review, No. 1, 1983.
=============
(Source: Audio magazine, Nov. 1983)
Also see: Computer-Aided Filter Design (Nov. 1983)