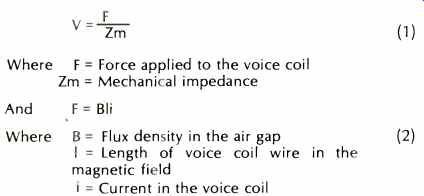
SOME OF THE MOST popular high-performance loudspeaker systems designed for the home utilize the acoustic-suspension or sealed-box principle. During the past several years, many improvements have been made in the woofer for this type of loudspeaker. New and improved materials and processes, such as polyurethane surrounds, vacuum-formed cones, and high-temperature voice coils, have contributed greatly to power-handling ability and smoother upper-range response. The performance below 500 Hz or so, however, has not been significantly improved, with the low bass response and distortion of the better units of some 20 years ago being essentially equal to those of present day design.
A problem with conventional design is that the laws of physics determine the maximum piston-band efficiency and low-frequency cutoff that can be obtained in a system with a given cabinet volume. If more efficiency is desired, bass response must be sacrificed, and conversely to obtain more bass, it is necessary to sacrifice efficiency.
One known method of circumventing this physical limitation is the negative-spring principle (1), which is somewhat complex in design. Another is the use of electronic equalization to modify the amplifier response, and this requires additional wattage for any gain achieved.
The purpose of this article is to describe a third method that is both simple to implement and that requires no additional wattage from the amplifier.
Back EMF
Since the above problem is related to the motion-induced back EMF generated by the speaker at fundamental resonance, we need to understand its nature. The magnet voice coil assembly of all dynamic speakers of the type we are discussing is a motor. An induced voltage is produced whenever an electrical conductor moves through a magnetic field; this effect is exhibited by all motors, whether rotary (the conventional type) or linear (such as a speaker) and is termed "back EMF" because its polarity is always opposite to that of the externally applied voltage. So this motion-induced back EMF opposes the amplifier voltage, raises the speaker's impedance, and reduces the current flow through the voice coil.
[*Watkins Stereo, 1244 Caribbean Dr.; Kingsport, Tenn. 37660]
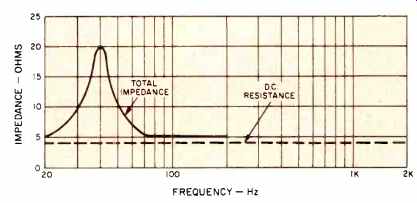
Fig. 1--Typical impedance curve. The total impedance is the d.c. resistance
plus the reactance due to the back EMF.
Since this back EMF is caused by the motion, i.e., velocity of the cone-voice coil, let us see how velocity and thereby back EMF, behaves. In a sealed-box, the enclosed volume of air is not a controlling or limiting factor above the region of resonance. Velocity is low, the air in the box is compressed and rarefied very little, and the air volume reactance is negligible. The output is determined by the cone area, motor, and mass of the cone and voice coil (2). Starting at 500 Hz, then, as we come down in frequency, the mass is "easier" to move due to decreasing mass reactance, and velocity doubles with each lower octave. In this area, and down to around 100 Hz, velocity is low, very little back EMF is generated to oppose the amplifier voltage, the back EMF is not a principal factor in determining current flow through the voice coil, and current flow is determined mainly by the d.c. resistance of the voice coil. This is the piston-band of operation where the decreasing air load resistance is offset by the increasing cone velocity, and the speaker output is approximately flat. As we move below 100 Hz or so and approach resonance, the air in the box enters the picture. The mass begins to resonate with the compliance of the air in the box, and velocity increases. When resonance is reached, the moving mass is at any instantaneous moment supplying energy to the air in the box (compressing or rarefying it) due to its kinetic energy, or the air in the box is supplying energy to the moving mass (forcing it in or out) due to its pressure or rarefaction. Thus, the mass and elasticity of the air in the box neutralize each other at resonance and velocity is greatest. With velocity greatest at resonance, the back EMF is greatest, and will raise the impedance by a factor of about 3 to 6. If the voice coil d.c. resistance is 4 ohms, the back EMF will add about 1 ohm at the resistive point in the 100 to 500 Hz range for a total of 5 ohms impedance in a typical woofer. Then below 100 Hz the increasing velocity may add 16 ohms at the resonant point due to the large back EMF, and the total impedance will be 20 ohms. This is shown in Fig. 1. Since the two points are resistive, we can calculate the power input to the voice coil by
Where,
E = Voltage from the amplifier in volts
R = Resistance in ohms.
With E essentially constant, and with a voltage of 10 volts, the voice coil is absorbing 20 watts at the point above resonance and only 5 watts at resonance. Since a speaker is more efficient at resonance, this condition produces flat response in conventional design. It is clear however, that while the back EMF was not a principal factor in determining current flow and wattage through the voice coil above resonance, it has become the dominant factor at resonance and has severely limited the wattage intake of the speaker.
In fact, if the power intake at resonance could be brought up to 20 watts and electro-mechanical losses were negligible, the relative bass output would increase by 4 times, that is, it would be elevated 6 dB above the higher-frequency output. If the output at these higher frequencies above resonance could then be increased, the net result would be an over-all higher output.

Fig. 2--Response for different values of motor strength in the region of
fundamental resonance with conventional design.
Dominant Parameters
While the device to be described may be characterized in terms of QT (shape of curve at resonance), it is believed that the approach used here offers a better "feel" for the principle involved. Although some approximations are necessary due to different factors in dominant control in given areas, the pattern of behavior is clearly shown (3). The reasonable assumptions made are that the inductance of the voice coil below 500 Hz is negligible, that the amplifier source resistance is negligible (a high damping factor), and that good design is used throughout, and in particular in keeping proper control of the mechanical and acoustic resistive elements (4). Since acoustic power output is proportional to velocity squared times the radiation resistance, and back EMF is also proportional to velocity, we will work mainly with this term. In the region above resonance and below 500 Hz, say at 200 Hz, where the cone of a 12-in. woofer is vibrating as a piston, the cone velocity is

Zm varies with frequency, is a minimum at Fr, and eq. 4 shows that this low mechanical impedance at Fr is reflected back into the electrical circuit by the back EMF as a high impedance. So, as noted before, the voice coil does not absorb nearly as much power at Fr as it can above and below. Equation 9 shows that motor (BI) is mainly in control of output at Fr. Since back EMF is proportional to BI, a higher BI gives more back EMF at resonance, and the velocity and acoustic output go down. Equations 6 and 9 show that for a given speaker, that is, a given area of cone, mass, and volume there will be an optimum value, neither too small or too large, of BI product that will give the flattest response.
The See-Saw Effect
Now let's look at the performance of a loudspeaker system in which the sealed volume, cone area, and mass are kept constant and plot the results of changing motor strength.
In Fig. 2, as shown by Eq. 6, in the 70 to 500 Hz range if BI is increased output will increase, if it is decreased output will decrease. However, around resonance the reverse happens. As shown by eq. 9, increasing BI decreases output and decreasing BI increases output at resonance. The results shown in Fig. 2 are very similar to what would be obtained by de-normalizing the standard Qt curves of .5 and 2 in Fig. 3 (6). The curves of Fig. 3 are generally referred to in discussing bass response. However, it must be noted that they have all been normalized with respect to actual flat band efficiency of each; i.e., the O dB point on the vertical axis is redefined for each speaker, regardless of actual efficiency.
This normalization process does however, have a disadvantage, in that when adjusting the BI product, it does not clearly show that a highly damped speaker will be more efficient above resonance than a less damped unit which peaks at resonance.
From Fig. 2 it can be seen that for a given speaker system, and where flat response is desired, the motor must be of the proper strength. Balancing the bass response to the flat band is much like balancing a see-saw, with the pivot point at 70 Hz or so. If the motor is too small, efficiency is low, and there is a bump in the bass. If it is too large, efficiency is high, but the bass response is down. This also shows that purchasing the speaker system with the larger magnet (it is often assumed that the speaker with the largest magnet is best) could buy one a speaker with less than optimum bass response. By juggling motor then, there is an inevitable trade-off between bass response and efficiency in the flat band.
With a given size enclosure, the foregoing discussion shows the limitations which must prevail. Efficiency in the 70 to 500 Hz midrange area is tied to efficiency in the bass range, and the see-saw effect prevails. When driven by modern-day solid-state amplifiers with their high damping factors, measurements and/or reference to reliable test report curves will show that many of the better speaker systems will begin to fall off in bass response above resonance. This is due to the motor having been increased (the "see-saw" tilted up in favor of the midrange) in order to obtain reasonable efficiency, i.e., a total power output above resonance of about 80 dB SPL (sound pressure level), re to .0002 microbar at 1 meter distance for 1 watt of electrical input. So in the final analysis, the crux of the problem is due to the see-saw effect of varying motor strength. For good efficiency above resonance, we need a large motor; for good bass efficiency, we need a smaller motor.
Dual Motors
A solution is to provide the speaker with two motors.
This would cut loose the see-saw effect, and we would be free to adjust upper range and bass separately, and without one affecting the other. The usual practice in adjusting motor strength is to vary the magnetic strength, that is, the B in the BI product. To construct a speaker with two different magnetic field densities to drive the same cone would be both expensive and difficult to manufacture.
Let's look at the BI product in a different way. In a conventional speaker, it is constant with frequency. Suppose we could in effect make I vary with frequency in such a manner that a lower value of BI in one frequency range would not affect a higher BI product in another range, and vice versa. Figure 4 shows a simple method of doing this.
A second voice coil is wound over or under the conventional voice coil and is driven by a series LC resonant circuit adjusted to resonate at the same frequency as the fundamental mechanical-acoustical resonant frequency of the woofer. With proper design of the inductor L and capacitor C, the LC circuit presents almost zero impedance at resonance, and a sufficiently high impedance one octave either side of resonance to effectively remove voice coil 2 from the circuit. Thus I of voice coil 2 can be adjusted to eliminate the high value of motion-induced back EMF at fundamental resonance, a lower impedance path is provided at Fr for current flow, and bass response at Fr can be adjusted at will and independently of midrange response above Fr and response below Fr. Taking our example used before, this will allow the impedance to be lowered to say 5 ohms (compared to 20 ohms before) at resonance, and the wattage intake can be brought up if needed to equal that above resonance (20 watts). At this point it should be noted that no attempt is made to violate the laws of physics. A second motor is added that generates less back EMF and offers a lower impedance to the amplifier, allowing more wattage intake to the speaker in the region of a resonance, and providing more bass response. We are simply using the wattage in a given amplifier that was there all the time, but not being used in the bass range.
The additional cost of building a woofer of this type over a conventional woofer is a pleasant surprise. A voice coil gap of twice the width is not required (a wider gap requires a larger magnet to obtain the same flux density) to accommodate the extra voice coil. The outer and inner clearance spaces are the same as usual, and since a single layer coil with a notch in the top plate for the return end of the coil has proved satisfactory, the gap width need only be increased by about 25 percent. Any extra money put into a larger magnet can be utilized to provide benefits that can be put to good use.
Once it is realized that the motor can be increased to the point of gap saturation with the attendant overdamping of bass compensated for by the second voice coil, the dividends of the design are apparent (as the flux density is increased, the impedance at resonance is increased, and fewer turns may be used in the second voice coil without its impedance falling to an unacceptable value). More overall efficiency, a smaller enclosure, extended bass as noted, or a combination of these may be achieved, according to how the parameters are chosen, and with the usual tradeoffs in these areas minimized. For the same shape of curve and volume of box the maximum realizable efficiency gain is calculated to be slightly over 3 dB.

Fig. 3-Frequency response in the region of fundamental resonance for different
values of QT.

Fig. 4-Circuit for a dual-motor woofer. L and C are adjusted to resonate
at the same frequency as the fundamental acoustic resonance of the woofer.
The tuned bandpass circuit formed by L and C allow the secondary voice coil
to operate only in the region of resonance.
Several variations of the principle involved were tried, but more research is needed in some areas. While using the circuit of Fig. 4, if the main voice coil is disconnected at resonance, a further increase in acoustic output occurs.
The measured EMF across it is higher than the amplifier drive voltage by about the same ratio as the ratio of turns of wire in the two voice coils. Inserting a parallel LC circuit in series with the main voice coil allows the increase to be utilized.* The Q of the LC circuits are controlled in a straightforward manner by the LC ratio. Mutual coupling of the two inductors in the two LC circuits can also be accomplished.
Performance
Figure 5 shows the frequency response of a woofer in which a gain of 5 1/2 dB at 30 Hz was achieved. In all the tests the speaker was sunk in the ground with the front edge flush with the ground surface, and well away from any buildings (180-deg. solid angle, free-field conditions), and the microphone was at 1-meter distance, on-axis with the geometric center of the speaker.
The following test equipment was used for the performance figures shown:
Hewlett-Packard 200-CD audio oscillator, Hewlett-Packard 400-H A.C. vacuum-tube voltmeter, Hewlett-Packard 120-B oscilloscope, Hewlett-Packard 330-B distortion analyzer, Crown DC-300A amplifier, B & W 410 a.c. vacuum tube voltmeter & distortion analyzer, General Radio 1390-B random noise generator with p2 pink noise filter, General Radio 1564-A sound and vibration analyzer, General Radio 1962 1/2-inch condenser microphone, General Radio 1560-P42 microphone preamplifier, General Radio 1562-A sound level calibrator, custom-built a.c. impedance bridge, and Eico 377 square wave generator.
The woofer is a 12-in. unit (9 1/2-in. actual cone diameter), mounted in a box of two-cubic-foot net internal volume, and the box filled with a suitable amount of fiberglass.
In constructing this unit, primary emphasis was placed on extending the bass, slight emphasis on efficiency, and none on reducing enclosure volume. The reason for this is that the writers experience has shown that, other things being equal, the loudspeaker listener will usually prefer the speaker with the cleanest and most extended bass response.
Taking 87 dB SPL (reference .0002 microbar) produced with 1 watt input (2 volts into a rated impedance of 4 ohms) as reference, the response is flat to 30 Hz, and down only 3 dB at 25 Hz. The response is flat ± 1 1/2 dB from 27 thru 600 Hz. It has been stated (7) that a range of 30 to 15,000 Hz is required to reproduce orchestral music with no discernible frequency discrimination. This is in agreement with the lowest musical tones generally found in recorded program material of the piano, double-bass viol, harp, organ, and drums. The curve of Fig. 5 is unusual, considering the 2-cubic foot volume, the overall efficiency, it being flat to 30 Hz, and that no amplifier equalization is used.
Total rms harmonic distortion is shown in Fig. 6. Note that the curves are for constant sound pressure levels, not constant wattage input. A specification showing low distortion down to 30 Hz with a constant wattage input is not very meaningful, if the acoustic output of the speaker is down 10 dB at this frequency.

Fig. 5-Frequency response of a dual-motor (1 watt into rated impedance of
4 ohms), mike at 1 meter on-axis, 180-deg. radiation angle, and free-field
conditions. SPL ref. is 0.0002 µ Bar.

Fig. 6-Total rms harmonic distortion with free-field conditions as noted
previously. The sound pressure level was held constant for each curve, and
the frequency lowered until the distortion reached 10 percent.
[*A capacitor in series with the main voice coil was used in the test speaker for this article. ]
Free-field specifications can be taken as statements of fact and offer data for direct comparison, but an assessment of performance in the listening room-even an "average" room-involves many variables, and becomes a difficult task. Furthermore, no standard has been adopted on either the maximum SPL needed or the limit on distortion. These are subjective matters, and it is therefore difficult to assign rigorous figures. The effect of boundary reflections on the response in the listening area is also of importance. Much work is now being done in these areas, and we can expect more useful information to become available.
Nevertheless, it is desirable to assess the performance of a new device in terms of practical use, and an attempt will be made to present the low bass capability in a manner that will allow the reader to make his own evaluation.
We need to decide on the lowest frequency to be reproduced, the SPL it is to be reproduced at, and the amount of distortion to be tolerated. Let's set the low frequency at 30 Hz as mentioned earlier, the SPL at 100 dB (extended listening at levels much higher than this can cause hearing impairment), and the distortion limit on the order of 5 percent (this level of distortion is tolerated in loudspeakers designed for demanding use at higher frequencies and lower volume levels than we are talking about here). At 30 Hz and radiating into 180 deg. free-field, the distortion at 97 dB SPL at one meter is 5.2 percent. Now if we move the speaker into the listening room, place it against a wall and add another unit for stereo use, the SPL will double and will be 100 dB. In an "average" room of 2500 cubic feet, and at this low frequency, the reverberant field SPL should equal the direct field SPL at about one meter (8), so the 100 dB SPL should prevail in the listening area. On this basis, we have a woofer in a two-cubic-foot box, flat to 30 Hz, with a stereo pair producing 100 dB SPL at 30 Hz in the listening area at a distortion level of only 5.2 percent, and with a power input to each of only 10 watts. If the SPL is lowered to 95 dB, the harmonic distortion drops to 2.3 percent, and at 90 dB it is 1 percent. This 5.2 percent low bass harmonic distortion in a woofer still allows for a surprisingly clean waveform, if clipping of the peaks and sharp aberrations are missing. Figure 7 is an oscilloscope photo of the acoustic output at 30 Hz at the SPL producing 5.2 percent distortion.
The impedance curve for a complete system is shown in Fig. 8. In one prototype, the curve was ruler flat below 200 Hz, however, the best overall results were obtained with some deviation from this ideal, and the curve shown is the one obtained from the design giving the other data presented in this article. The minimum is 4 1/2 ohms at 25 Hz, the maximum is 7 ohms at about 2200 Hz, and a 4-ohm rating is appropriate. It does not fall under 5 ohms below 20 Hz, and above 20,000 Hz, there is a gradual rise due to the usual inductance of the tweeter voice coil. The conventional bump at bass resonance is missing, due to the effect of the second voice coil increasing the power intake in this region.
Transient response refers to the ability of the woofer to follow the starting and stopping (attack and decay) of sudden changes in the electrical signal. In a woofer, this is a function of the system Q. It is generally considered that a Q of one offers the flattest response with a minimum of ringing, and the response curve of Fig. 5 conforms to this shape. Since the woofer is driven by a series resonant LC circuit, we need to see if the transient response follows the rules. It has been shown (9) that a woofer in a sealed box with a Q of one will have about 33 percent overshoot to a step-signal, and will decay within one cycle. Figure 9 is an oscilloscope photo of the wave-form of the acoustic output in response to the step-front of low-frequency square wave. The overshoot past the neutral or start position is exactly that expected with a Q of one, and shows that the woofer is properly damped both acoustically and electrically. This test was made indoors, and the small ripples in the waveform are due to room boundary reflections.
System Performance
The frequency response of a complete system consisting of a 12-in, woofer, 4 1/2-in. mid-range, and 1-in. dome tweeter is shown in Fig. 10. One-third-octave bands of random noise were used to produce the curves. The dot dash line is the on-axis response, and the solid line is the average of five frontal curves; one on-axis, and four at 45 degrees, with the microphone at the sides and ends, one meter away from and aimed at the geometric center of the box. Taking 85 1/2 dB SPL as reference, the lower curve (a good indication of the overall response), shows the system to be ± 3 dB from 23 through 20,000 Hz. The system's impedance curve is that of Fig. 8. Although the output of the midrange driver needs to be increased slightly, the response is relatively smooth.
In listening comparison using program material with deep bass content, the low bass is simply "there." The lowest notes are reproduced cleanly at equal volume, and the temptation to turn up the bass control is missing. The low notes have an "easy unstrained" sound, which is attributed to the linearity and low phase shift of the load presented to the amplifier.
In summary, the design does not involve trade-offs in areas of performance, requires no additional amplifier power or equalizer, has the advantage of simplicity of construction, and offers an improvement that is readily discernible on listening.
A patent application has been allowed for the loudspeaker system described in this article.
References
(1) Terrance Matzuk, Improvement of Low-Frequency Response in Small Loudspeaker Systems by Means of the Stabilized Negative-Spring Principle, Jour. of the Acoustical Society of America, Vol. 49, No. 5, Part 1, p. 1362, May, 1971.
(2) Henry Kloss, Loudspeaker Design, Audio, March, 1971. p. 30. (3) J. D. Tillman, unpublished class notes (Electroacoustics-EE.4570) Electrical Eng. Dept., University of Tenn., Knoxville, Tenn.
(4) Roy F. Allison, Low-Frequency Response and Efficiency Relationships in Direct-Radiator Loudspeaker Systems, Jour. of the Audio Eng. Society, Vol. 13. Jan., 1965.
(5) Harry F. Olson, Acoustical Engineering, p. 130; D. Van Nostrand, 1957.
(6) Leo L. Beranek, Acoustics, p. 226; McGraw-Hill, 1954.
(7) Harry F. Olson, Psychology of Sound Reproduction, Audio, June, 1972, p.20.
(8) Roy F. Allison and Robert Berkovitz, The Sound Field in Home Listening Rooms, Jour. of the Audio Eng. Society, Vol. 20, July/Aug., 1972, p. 459.
(9) Richard H. Small, Closed-Box Loudspeaker Systems, Jour. of the Audio Eng. Society, Volume 20, Dec., 1972, p. 798.

Fig. 7-Acoustic output of the woofer at 30 Hz and 97 dB SPL. Free-field
conditions as noted previously. (Oscilloscope of microphone output).

Fig. 8-Impedance of a system using dual-motor woofer.

Fig. 9-Acoustic output of the woofer in response to the step front of a
low-frequency square wave.

Fig. 10-Frequency response of a three-way system using the dual-motor woofer
with one-third-octave random noise. Speaker radiating into 180-deg. free-field
conditions as noted, with one-watt input.
(Audio magazine, Dec. 1974; William H. Watkins)
Also see:
Bass Equalization in Loudspeakers (Nov. 1973)
= = = =