by Leonard Feldman
The following is the first in a series of background notes to the graphs ac companying our Equipment Profiles, this one on FM tuner quieting and distortion characteristics, which is usually Fig. 1 in Len Feldman's tuner and receiver reviews.
The purpose of these notes is to provide the novice with a reasonably non technical explanation of how the charts serve to provide a great deal of information in a relatively small space.
While each reviewer has been asked to assume a certain level of technical understanding on the part of the reader, we will appreciate feedback as to whether the notes are too technical or not technical enough.
We presently plan to include an "All That Data" note in each issue in which space is available and to change the subject of the note with each succeeding installment, e.g. tuners this month, cassette decks next time.-The Editor.
Whether we measure the tuner section of a complete receiver or a separate component tuner, Audio Magazine always publishes test results in the form of charts and graphs in addition to the brief verbal comments that we make regarding those measurements. One chart or graph we use to depict some of our tuner measurements can, if interpreted fully, tell you, our readers, a great deal about the performance of the tuner or tuner section under investigation. A sample of that chart is reproduced in Fig. 1 and, for those unfamiliar with it, we would like to explain the information that can be gleaned from it.
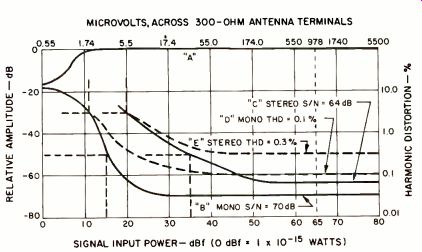
Fig. 1--Mono and stereo quieting and distortion characteristics of a
typical good FM tuner section.
dBf vs. Microvolts
You'll notice that at the top of the chart, running horizontally, are some rather odd numbers, beginning 0.55, 1.74, .... Along the bottom of the graph, also running horizontally, are a more regular series of numbers, beginning 0, 10, 20, .... The upper set of numerals describes increasing signal strength (from left to right) in micro volts, or millionths of a volt, while the lower numbers also describe increasing signal strength, but in power terms, or dBf. dBf stands for decibels referred to 1 femtowatt, and a femtowatt, for those who don't know (and that's probably most everyone), is 1 x 10^-15 watts! If that kind of notation troubles you, you can think of that very tiny quantity of power as 0.000000000000001 watt! Since the performance of an FM tuner usually gets better with increasing signal strength, we use dBf or microvolts (abbreviated pV) to describe that changing signal strength. Why two types of notation? dBf is the newer and preferred form, simply because it is free of any possible ambiguities.
You see, power is defined as the square of the voltage divided by the load impedance. Now, some tuners have a 75-ohm antenna load impedance but most have a 300-ohm antenna load impedance. If you choose to talk about voltage, instead of power, when describing signal strength reaching the antenna terminals of a receiver, then 2 microvolts arriving at the 300-ohm terminals of a tuner produces exactly the same power as only 1 microvolt intercepting a 75-ohm antenna input to another tuner. The ambiguity arises because the maker of the tuner with the 75-ohm antenna might well claim a sensitivity of 1.0 microvolt, while the maker of the tuner having a 300-ohm input would call his sensitivity 2.0 microvolts. In fact, both tuners require the same amount of power to achieve the same reception. No such ambiguity can exist when we use dBf, since then we are talking about power--and that's the same for any tuner, regardless of its antenna input impedance.
For the sake of "old timers" who still think microvolts, the upper scale in Fig. 1 correlates "old" microvolt values in terms of new dBf readings. But from [...] changes drastically with increasing signal strength. This curve represents the background noise level relative to the audio level. And since we are expressing one value with respect to another, we can use the handy decibel notation (the scale at left) or, if you prefer, the percentage notation (the scale at the right of the graphs). As signal strength increases, noise is reduced. Curve "B" represents that noise level, during monophonic operation of the tuner, while curve "D" represents distortion for mono operation. Note that for a short while, curves "B" and "D" are identical. The signal strength required for the noise and distortion to decrease until their sum is 30 dB lower than the program output is known as the usable sensitivity. For curve "B" (and "D"), that occurs when signal strength is 11 dBf.
50-dB Quieting Sensitivity
While a knowledge of the usable sensitivity of a tuner is of some interest, it is useful only in that it tells us the minimum signal strength required to get a marginally listenable (but hardly satisfactory) signal. For high-fidelity listening that is reasonably noise free, we need to have a signal which can drive the noise down until it is about 50 dB below the program level.
If you follow curve "B" along to the right, beyond the usable sensitivity level, you will note that with a signal input of 15 dBf the noise is now 50 dB lower than the desired program level.
This signal strength is therefore de fined as the mono 50-dB quieting sensitivity. Following curve "B" even further we see that when signal gets strong enough, here about 30 dBf, the curve levels off and noise level re mains constant with further increases of signal. This level of noise defines the ultimate signal-to-noise ratio of tuner. In our example, the ultimate , signal-to-noise ratio (usually measured i signal strength of 65 dBf) turns out 5e 70 dB below the program level, monophonic reception.
[...]
Distortion
[...] ie dashed curve "D" has also been ig downward with increasing sig- […] strength. This curve shows the dis on level of a 1-kHz signal at maxi-[…]-1 modulation (maximum loudness permitted by the FCC) for vary –[…] signal strengths. Again, once the II strength gets to around 65 dBf, further decrease in distortion re- […] with further increases in signal […] gth. So, the distortion measured dBf is reported in the test results. [...]
In our example, it is 0.1 percent for mono performance. Notice that here we normally use percentages, but we could just as easily quote distortion as being "so many dB" below the desired program level, in this case 60 dB. The curve shows us the distortion characteristics of a 1-kHz signal. We could have chosen any other frequency which is broadcast over FM. In fact, widely accepted standards require that distortion be quoted at three frequencies-100 Hz, 1 kHz and 6 kHz. however, our graph would get too cluttered if we tried to draw curves for all of these frequencies, so we simply report the other two in the text of our test reports.
How About Stereo Performance?
You can pretty well accept as a general rule that, in any tuner, stereo performance is somewhat inferior to mono performance. Since most listening these days is to stereo FM, it is therefore essential that the tests we have been describing and the measurements we have plotted in Fig. 1 be repeated for stereo operation of the tuner. That's where curves "C" and "E" come in.
Curve "C" is the quieting characteristic of the tuner when it is in the stereo mode, while curve "E" tells us what happens to distortion of 1 kHz in the stereo mode. In case you are wondering why curves "C" and "E" don't start at the left of the graph, as did curves "A," "B," and "D," the answer is that the circuitry in our sample tuner can not switch into the stereo mode until a signal strength of at least 18 dBf is reached, so that's the signal level at which we start our plots.
As we suggested, usable sensitivity (the signal strength at which noise and distortion are 30 dB lower than pro gram level) is poorer for stereo than it is for mono, about 20 dBf (or 5.5 microvolts). Following curve "C" along downward and to the right, the 50-dB quieting sensitivity for stereo is also much poorer (higher amount of signal required) than it is for mono. Results for this tuner are 35 dBf for 50-dB quieting-a not untypical value for a good tuner. And, to complete the quieting story in stereo, ultimate signal-to-noise ratio, often abbreviated S/N, for stereo is only 64 dB as com pared with our earlier result of 70 dB for mono.
Finally, curve "E" tells us what hap pens to distortion of a 1-kHz signal in stereo with increasing signal strength.
Here again, we find that even with a strong signal (65 dBf is usually the reference signal strength for this measurement), distortion only drops down to around 0.3 percent or 50 dB below program level. How do I know that 50 dB is equivalent to 0.3 percent? Simply by remembering a couple of dB relationships. A change of 6 dB represents a doubling or halving. Thus, 6 dB above 0.1 percent is 0.2 percent, while 6 dB below 1.0 percent is 0.5 percent, etc. On the other hand, 10 dB represents a 3-to-1 increase or decrease (approximately), so, since curve "E" settles in at 10 dB below 1 percent (or 10 dB below 40 dB), its percentage value is roughly 0.3 percent.
All That Data
The five curves in Fig. 1 have told us a great deal about our sample turner.
To review, just from curves "A," "B," "C," "D," and "E," we are able to determine all of the following:
1. Mono usable sensitivity (in micro volts and dBf);
2. Stereo usable sensitivity (in micro volts and dBf);
3. 50-dB quieting sensitivity, mono;
4. 50-dB quieting sensitivity, stereo;
5. Signal-to-noise ratio, mono;
6. Signal-to-noise ratio, stereo;
7. Distortion, 1 kHz, mono, for strong signals;
8. Distortion, 1 kHz, stereo, for strong signals;
9. Stereo switching threshold, and
10. FM limiting characteristics (when program level reaches its maximum).
Clearly, presentations such as these save audio testers and reviewers a great many words (if not the proverb al thousand that a picture is supposed to be worth). And as far as this audio tester is concerned, that's all to the good, especially since our esteemed editor does not base his payments upon word count alone.
========
(adapted from Audio magazine, 1980)
= = = =