Tone burst techniques, gated measurement, analog computing, and imaginary numbers.
I’ve been interested in microphones for some time, especially those used to record music in concert and studio settings. More recently, however, I’ve become especially interested in how various microphones differ, how to measure and compare those differences, and what design trade-offs go into the development of a new microphone. This article examines a particular kind of microphone, the acoustic dipole or “gradient” microphone and its design parameters.
First I’ll describe its operation mathematically in enough detail to predict frequency and polar response characteristics in a spreadsheet. Next, I’ll discuss the techniques needed to obtain accurate measurements of microphone frequency and polar response, using a computer sound card and some simple software programs. The spreadsheet and computer source code are posted online (www. audioXpress .com) for readers to down load. Finally, I’ll show the construction of a prototype dipole microphone using two omnidirectional electret condenser microphone cartridges.
My goal here is not to produce a de sign that’s better or different from existing designs, but rather to gain a more complete understanding of what goes into microphone design and measurement. This way, we can all be a little more confident about making the best use of the microphones that are available to us.
MICROPHONE TYPES
The simplest microphone is the omni-directional pressure microphone, which senses instantaneous pressure at a point in space. Pressure doesn’t have a direction, so an ideal pressure microphone responds equally to sounds from all directions. Sounds arriving simultaneously from various directions simply add up to a single pressure value at the location of the microphone. Note, however, that the addition is instantaneous, so phase matters when doing the summation. Two sounds at the same frequency could add up constructively or destructively, de pending on their phase relationship.
Now suppose you want to design a microphone that picks up sounds along a particular axis, while ignoring sounds along some other axis. A simple technique is to place two pressure micro- phones of equal sensitivity near each other, and then obtain the difference between the two signals. Sound waves traveling along the axis of the dipole (that is, along a line through the acoustic centers of both microphones) will arrive at slightly different times. While the amplitudes will be roughly the same, there will be a phase shift between the two signals so they don’t completely cancel. This, then, is the “on-axis” signal of the directional microphone.
Sound waves arriving from any direction in a plane perpendicular to the dipole axis will arrive at both capsules at the same time, so there will be no phase shift between them, allowing for complete cancellation of the signal. This is the “off-axis” response, for what you now see is a bidirectional microphone, having a figure-eight polar response pat tern. The combined dipole microphone now responds to the gradient of pressure instead of pressure itself; and has a preferred axis for pickup.
But what if you want to pick up sounds arriving from one direction along the dipole axis while rejecting sounds arriving from the opposite direction? It turns out that the dipole gradient microphone can distinguish front from back, in the sense that sound from the front gives a gradient signal which is in phase with the omni response, while sound from the back gives a gradient signal which is opposite in phase to the omni response. Assuming the omni and on- axis gradient responses have the same sensitivity, they maybe added together to obtain a response that is twice the omni response on-axis from the front, equal to the omni response from the side, and null (complete cancellation) along the dipole axis from the rear.
The dipole microphone is now giving what is commonly called a “first-order cardioid” polar response pattern, prefer ring sounds from one direction while rejecting sounds from the opposite direction. This microphone type is widely used—both in studios and in live recording—because it allows direct sound from a performer or instrument to be emphasized, while reducing ambient and reverberant sounds
Most commercial microphones having a first-order cardioid response actually have just one diaphragm and one electrical output. The gradient is obtained by having two ports to accept sound, which is then routed to the front and back of the diaphragm with appropriate time de lays and other acoustic elements. This is a form of analog computer, implemented with air passages. The best way to see how this works is to take one apart, al though you may ruin it in the process.
For my work here, I’ll use two separate omnidirectional capsules and then develop the various polar patterns using an analog computer implemented with gain stages, adders, and an integrator. Clearly, the computations could also be implemented iii a digital computer, but real-time digital signal processing is beyond the scope of this article.
MATHEMATICAL DESCRIPTION
Now let’s work out the math needed to describe the polar and frequency response for the dipole microphone. First you need some assumptions, so things don’t get completely out of hand. I’ll assume the dipole is made of two ideal pressure microphones having identical sensitivity, and flat frequency and phase response over the range of interest. I’ll limit range of interest to 100Hz to 10kHz, for reasons that will become clear as we go along. I’ll assume free- field conditions, considering only the direct sound from an ideal point source, with no reflections or reverberations, and, of course, no ambient noise.
Sounds from the ideal point source will propagate as spherical waves, so assuming no transmission loss in the medium, acoustic pressure will fall as the in verse of distance from the source. Acoustic power, of course, falls as the inverse of distance squared, but the microphone responds only to pressure, not power, thus the hr dependence. The central axis of the dipole will, for my purposes, always remain in a plane that includes the point source.
Now I write the wave equation giving instantaneous pressure p at distance x and time t, for a steady-state sound of frequency w in units of radians per second:
Here e is the base of natural logarithms (2.71828. . . ), and k is the wave number 2 where X is the wavelength of sound at the given frequency. I define a reference distance x at which pressure is arbitrarily set to unity. This will be the distance from the point source to the acoustic center of the dipole. Because wavelength is just c/f, where c is the speed of sound and f is the frequency in units of Hz, you can now write the wave equation as:
You’ve probably noticed that I’m using complex notation here, where i is the square root of -1. It may seem like an unnecessary burden, but it actually helps to keep track of phase when you do the calculations in Excel or other math pro grams. You just need to be sure to let Excel know that these are complex numbers. Note that some math programs expect “j” instead of “i” when entering imaginary values.
Now consider an angle 0 between the axis of the dipole and a line from the point source to the center of the dipole, where d is the acoustic distance between the two microphone capsules in the di- pole ( Fig. 1). By the law of cosines, the distance from the source to each micro phone capsule is given as:
Here I’ve labeled the distance from source to microphone as XA for the front capsule and XB for the rear capsule. For large x (that is, x, >> d12), this can be simplified to x ± (d/2) cos O, but let’s keep the full form for now because I will be considering small x (that is, x comparable to d/2) when I look into the proximity effect.

PHOTO 1: Auratone 5C Super Sound Cube loudspeaker mounted on top of a tripod-style
mike stand. Dipole microphone prototype is supported by a mike stand sitting
on a cheap turntable. Speaker and microphone are positioned 1-m apart, midway
between floor and ceiling, near the middle of the room.

Above: Fig. 1: Dipole microphone design features two omnidirectional capsules
responding here to spherical waves emanating from a point source. Distance
from source to capsule A is XA, and from source to capsule B is x Acoustic
center of the dipole is at distance x Length of the dipole d is the acoustic
distance between capsules A and B.
Now you can construct a spreadsheet to calculate the omni, gradient, and cardioid polar response patterns for an acoustic sine wave. I’ll begin with some columns for given values, including the speed of sound (345m/sec assuming 22° C ambient temperature), distance from source to dipole (1m), length of the di pole (0.01m), frequency of the incident sound wave (1000Hz), and angle of di pole axis with respect to the source (00). I’ve used the “Fill Down” command to copy the given values into 72 consecutive rows, except for angle, which I set to run from 0° to 355° in 5° steps. I placed a column alongside the angle which converts from degrees to radians using the Excel built-in function RADIANS(), because many Excel functions assume radians as input. Now you calculate the distance from source to microphone A using equation (3 a), and from source to microphone B using equation (3b).
All calculations up to this point have been real numbers, but now I will switch over to complex math to obtain the response to the source signal using equation (2) for each capsule, replacing x with the value of xA or xB as needed for each capsule. Because I’ve assumed steady-state conditions, the phase relationship between the two capsules will be the same at any time t, so you can set t = 0 to simplify the calculations. You then take the complex sum and complex difference of the signals from capsules A and B. The absolute value (radius in the complex plane) is the output level in units of pressure where the reference level is unity, while the argument (phase angle in the complex plane) is the output phase in radians. A radar plot of the difference output level should show a figure-eight pattern, while the sum output level should be a circle.
Use the Excel functions IMABS() and IMARGUMENT() to obtain real-valued numbers for plotting. If Excel gives a “#NAME?” error when you try to use complex math functions, check to be sure that you have the Analysis ToolPak enabled, under “Tools Add-Ins.
But now you notice that at 1kHz, the difference (gradient) output level is much lower than the sum (omni) output level, and as you change frequency you find that the difference output level has a large frequency dependence, increasing along with frequency. What happened was that when I calculated the difference between the microphone A and microphone B signals, I effectively took the differential Ap, which caused a factor of i(2rtf/c)Ax to pop out, where Ax is just the dipole length d. This factor causes the frequency dependence along with a 90° phase shift.
To make the on-axis difference signal look like the omni signal, you must divide out a factor of:i(2xf/c)Ax. Luckily, you can integrate the gradient signal with respect to time to remove i^2 pi f and Ax/c is just a constant gain factor equal to the dipole length divided by the speed of sound. So add a new column to the spreadsheet where these factors have been divided out of the complex difference response.
With this change the gradient response is now uniform over frequency, but still off by a factor of 2, due to the sum signal including the signal from two capsules. So you divide the complex sum response by 2 (think of it as an average), and can now compare the amplitudes of the omni and gradient responses on an equal basis. Alert readers will have noticed that x appears twice in equation (2), but when I integrated the difference signal with respect to time, I accounted for only one of the x’s. The presence of this second x is actually the origin of the proximity effect in gradient microphones.
The final step is to show the cardioid response in the polar plot. This is done by taking the complex average of the omni and gradient responses and plot ting the absolute value. The result should be a familiar heart-shaped pattern, but it’s pointed in the wrong direction!
It turns out that I overlooked a minus sign when obtaining the time integral of the gradient response. Reinstating the minus sign will point the cardioid microphone in the right direction. So you can obtain both a front-facing and rear- facing cardioid response from the same omni and gradient signals ( Fig. 2).
By the way, an important characteristic of first-order cardioid microphones is that the response at 90° and 270° should be exactly 50%, or -6dB when plotted logarithmically. You now have a toy model that reveals many of the characteristics of real microphones, as frequency and distance from the source vary. If you are using Microsoft Excel, you can download a fully populated spreadsheet of this model.
MEASUREMENT TECHNIQUES
To test the model spreadsheet, I’ll de scribe the construction of a prototype dipole microphone. But first, you need a set of measurement techniques in order to evaluate the prototype. According to the assumptions that went into the spreadsheet, you want to measure the free-field steady-state response to spherical sound waves arriving from a point source, in the frequency range from 100Hz to 10kHz. If you are already set up to measure microphone polar and frequency response, you can skim over this part of the article. For readers who are interested in developing their own setup for microphone measurements, however, I’ll give the complete details.
To achieve free-field conditions is a bit of work, but well worth the effort. Building an anechoic room is one option, but way beyond reach for most of us. If you want to be able to stand up in side your anechoic chamber, you’ll need 2m clearance vertically, plus 2m above and 2m below for the sound-absorbing wedges, requiring a space of at least 6m in height for construction. This would be for a room with a cutoff frequency around 86Hz, where 2m is a half-wave length. Below cutoff, the chamber reverts to pressure mode and is no longer anechoic. Readers living in a mild climate might consider using an open field or empty parking lot, especially if they can dig a small pit for a loudspeaker to be mounted so- the baffle is even with the ground, pointing straight up in a 27t (hemispherical) configuration.
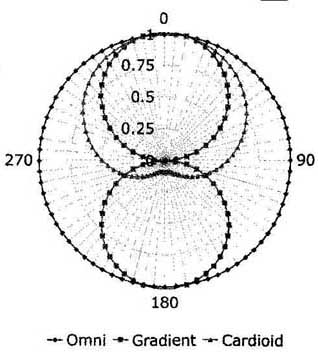
Above: Fig. 2A: Calculated polar plot of 300Hz response with dipole length
of 10mm. Signals shown include omni, gradient, and cardioid. Distance from
source is set to 1 m, so proximity effect is minimal. Radial axis is linear.
--Omni .- Gradient —Cardioid.
The microphone under test can then be suspended directly above the loud speaker, pointing straight down. Note, however, that you’ll need to accept what ever ambient noise is present in the environment. Also, the speed of sound has a rather strong temperature dependence, varying almost 4% over the temperature range from 0 to 200 C.
I actually chose to obtain free-field conditions in my living room with a tone-burst source and gated measurement system using wave files and the sound hardware of a laptop computer. My living room ceiling has a height of 2.43m. With loudspeaker and microphone suspended 1m apart midway between floor and ceiling, the direct sound arrives at 2.9msec after launch, while the first echoes arrive at 7.6msec ( Fig. 3). That gives me 4.7msec of direct sound with no echoes, satisfying the requirements for a free-field measurement. I can fit at least one complete cycle of a free-field measurement at frequencies of 212Hz and above.
When I measure frequencies below 212Hz, at least some of the first echo from floor and ceiling is included in the measurement. If loudspeaker and microphone are moved closer, to 0.3m separation, then I have 6.2msec in the free-field regime, allowing good measurements down to 161Hz. Measurements below cutoff don’t blow up, but rather begin to include more and more sound from directions other than the source with falling frequency. While it’s definitely not steady-state, you will see that this technique gives results that are easily good enough to justify the effort in obtaining them.
All test signals were calculated and written directly to wave files using a simple command-line utility program called “tbg.exe,” written for the purpose in C++. This technique of using offline signal generation and analysis has worked out very well for me, and seems to have no real disadvantages when compared to more sophisticated graphical user inter face (GUI) programs that make their measurements in real time. Complete source code is available for readers to download.
PROTOTYPE CONSTRUCTION
Now you can build a prototype dipole microphone, to see whether the characteristics predicted in the model spread sheet are meaningful. The first thing you must decide on is the length of the dipole. As notice from the spread sheet model, there are nulls (complete cancellation) in the on-axis omni response whenever the dipole length is equal to odd multiples of a half wave length. For instance, a dipole length of 10cm gives nulls at 1725Hz, 5175Hz, 8625Hz, and so on. I’ve used 10mm diameter capsules for my prototype, so the closest I can easily place the acoustic centers of the capsules is 10mm, giving the first null at 17.25kHz. This helps to explain why, especially for large diameter microphones, it may be better to avoid gradient behavior at high frequencies.
The basic requirement is to sample pressure at two nearby points in space. To do this I used a pair of Panasonic omnidirectional electret condenser microphone cartridges, part #WM-034BY, which I had on hand. It seems that this part number has become obsolete, but the cartridges themselves are completely generic, and can be easily substituted without affecting performance. I chose to mount the microphone capsules facing upwards in a probe configuration (Photo 2A). This allowed me to put the electronics beneath the microphone, away from the line-of-sight for incident sounds, and made the microphone nearly symmetric about the vertical axis for polar plots.
You may ask why I didn’t face the capsules forwards, or perhaps one for ward and the other one backwards. I actually considered all of these configurations, but didn’t try them because I had in mind to make a bidirectional microphone that would allow me to develop both front-facing and rear-facing cardioid patterns from the same signals. I also considered the fact that gradient microphones are notoriously sensitive to handling noise and mechanical vibration. Facing both capsules in the same direction should minimize the difference signal between them when both are subjected to the same vibrations

Above: Fig. 2B: Calculated frequency response of microphone with dipole length
of 10mm. On-axis, 900, and 180° plots are shown. Vertical axis is in dB.

Above: Fig. 3: Direct sound arrives at the microphone at time t = x where
x is the distance from source to microphone, and c is the speed of sound in
air. First echo arrives a bit later, after being reflected off floor and ceiling
at height h. Free-field conditions are obtained during the interval between
direct sound and first echo.
As shown in Photo 2B, two brass tubes hold the capsules up above an electronics package contained in an aluminum project box. The tubes and project box are all tied to ground for proper shielding. I obtained a threaded mike stand adapter from Atlas Sound which I mounted on the bottom of the project box, centered along the vertical axis of the microphone. Although not shown, you can easily fit an inexpensive foam windscreen around the capsules if needed.
I provided two jacks at the bottom of the project box, one for a 9 to 12V DC power input, and one for a stereo line level output to match my computer’s sound card input. The two capsules should be rigidly mounted with respect to each other, and should have mechanical resonances well damped. In my prototype, I found that the wires connecting to the capsules had a strong resonance in the low audio range, so I stuffed the brass tubes with tissue paper to keep the wires quiet. I also experimented with using a pyramid, glued from foam-core board, to blend the surfaces of the project box to the probe tubes, but wound up not using it for the measurements in this article.
The electronics package implements the analog computer I designed while coding the spreadsheet earlier in this article. It consists of gain stages, adders, and an integrator, as indicated in the block diagram of Fig. 5. A detailed schematic is given in Fig. 6. The completed assembly is in Photo 3.
I mounted all parts on a piece of 0.1” grid perf-board using DIP sockets and 0.042” perf-clips. Wiring was done point-to-point using a “wrap and burn” technique with enameled magnet wire. A set of jumpers JMP1 allows me to recon figure the outputs between measurements.
Instead of providing trimpots for balancing gains, I decided to mount fixed resistors in parallel to accomplish the same thing. I used packaged resistor net works RN1 and RN2 for the 15-kOhm resistors, because their values should track well over time and temperature. Coupling capacitors C1, C2, C4, and C5 in the circuit path are all sized to put the low-frequency cutoff well below the lowest frequency of interest. The integrator capacitor C3 is sized to roughly match the gradient and omni signal levels. R5 limits the DC gain of the integrator, and can be used to adjust low-frequency response of the gradient signal, and thus tune the proximity effect in the cardioid outputs.
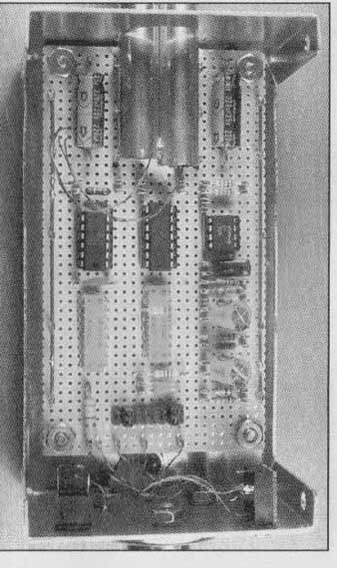
PHOTO 3: Analog computer is assembled onto a piece of perf-board with 0.1”
hole grid. Power supply and ground bus wires are at top and bottom. Circuit
adjustments are made by soldering in optional resistors. Jumper block at right
allows various signals to be monitored.
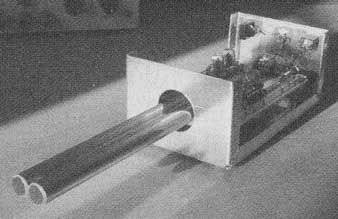
PHOTO 2A: Two electret microphone cartridges are mounted side-by-side in a
probe configuration above an electronics package. Thin wall brass tubes are
tack- soldered to each other, and rigidly mounted to the perf-board circuit
assembly.
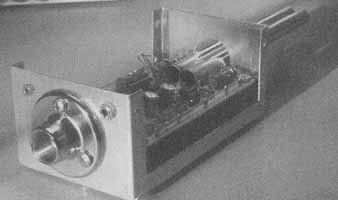
PHOTO 2B: Threaded mike stand adapter is aligned with the acoustic center
of the dipole. Power supply input and line level output jacks are also mounted
on the bottom end of the project box.

Above: Fig. 4: Simple sine tone burst shown above has discontinuous slope
at the start and end. Raised cosine has continuous slope, but gives a DC bump
during each tone burst. Adding in the second harmonic with equal amplitude
and opposite polarity corrects the DC bump, and gives a continuous band-limited
function that can be repeated as necessary to fill a tone burst. Matched filter
removes the harmonic during analysis.

Above: Fig. 5: Block diagram of dipole microphone with analog computer. Gradient
and cardioid signals are derived using sum, difference, and integrator blocks
Gain stage for each capsule converts current to voltage.
I used two Burr-Brown OPA4134 quad op amp packages at IC1 and 1C2 for the analog computer, mainly so I could become familiar with their characteristics. I found them to have low noise, moderate current consumption, and they are very fast. Layout and de coupling are important, as is an oscilloscope that can see oscillations well be yond 20MHz. Readers may prefer to use TL074 or other unity-gain-compensated op amps in this application. I chose an LM10CN integrated op amp and voltage reference for 1C3 to set the bias voltage for single-ended power supply operation.
Instead of just buying two electret microphone capsules and hoping they would match, I actually bought ten capsules (they’re not expensive), measured the on-axis phase and frequency response of each, and then chose the two that had the best phase match at 100Hz, while maintaining a similar frequency response all the way up to 10kHz. I actually measured the capsules in pairs, so I could look at their relative phase response instead of the absolute response, and thus subtract out the absolute distance from speaker to microphone. The assumption here is that I’ve precisely set the two capsules equidistant from the loudspeaker. Note that at 100Hz, 1 milli-radian (mrad) of phase difference is just 0.55mm!
The next step is to match the sensitivity of the two microphone cartridges over as broad a range of frequencies as possible. I did this by first measuring the amplitude difference versus frequency for the two capsules when connected to the preamps as shown in Fig. 7. I then calculated the gain change required to match the outputs at 1kHz and soldered in the appropriate resistors at optional locations R1 and P2. The gain and phase differences between the two capsules after this adjustment are shown in Fig. 7, measured using the harmonically shaped tone burst technique.
You can now measure the omni and gradient responses, both in frequency and polar domain. The results look encouraging ( Fig. 8) with almost 30dB of side rejection in the gradient response at 300Hz. It seems that the integrator de sign was correct, because the omni and gradient on-axis frequency responses are a good match. To obtain the correct cardioid response, you need to precisely match sensitivity of the omni and gradient responses for sounds coming from the rear, the direction of greatest rejection in the cardioid pattern.

Above: Fig. 6: Detailed schematic diagram for dipole microphone and analog
computer. Electret capsules are operated as current sinks at constant voltage.
Jumper block JMP1 lets you assign the two output pins to a variety of internal
signals. V_bias is set to 4.5V DC, to allow single-supply operation. Required
filter and bypass capacitors are not shown.

Above: Fig. 7: Measured gain and phase difference between capsule A and capsule
B in the dipole microphone prototype. Best match is obtained at 100Hz where
it matters most, due to integration of the gradient signal. Note the expanded
vertical scale for both amplitude and phase.
It turns out that the gradient polar response can be asymmetrical due to a small mismatch in phase between capsules A and B, so you may need to ad just the “left” and “right” cardioid balance separately. Gross adjustments can be made by changing the value of integrating capacitor C3. Fine adjustments can then be made by adding resistors at optional R3, or in series with R4 to optimize the left cardioid pat tern. The goal is to obtain the best null for rear rejection over the widest range of frequencies.
If your gradient polar response is symmetrical, then the right cardioid response should also be optimum at this point. In my case, however, the gradient response was about 1dB different from front to back, so I adjusted the gradient signal in the right cardioid by adding some resistance in parallel with RN2A or RN2B around amplifier IC2D. Now I have two cardioid responses, one facing front and the other facing back, with rear rejection of 20dB or better in the range from 200Hz to 10kHz ( Fig. 9).
You may be wondering whether the sum and difference operations implemented in the analog computer discard any information. It turns out that they don’t, in the sense that given the left and right cardioid signals, you can recover the original omni and gradient signals by applying another matrix operation which is the inverse of the sum and difference operation. Expressed as a matrix, it turns out that the sum and difference operator is self-inverse, times a factor of 2.
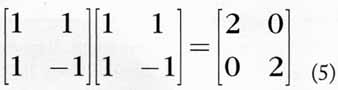
This same matrix operator appears in other places in audio, for instance, in stereo modulation of broadcast signals, and in mid-side stereo microphones.
At this point, I’ve barely scratched the surface of what can be done with directional microphones. I’ve assumed flat response everywhere, except for rolling off the integrator on the low end. Obviously, much more work can be done with equalization and phase matching here.
TABLE 1 Dipole Microphone Prototype Parts List
Designator--Part Number—Description--Manufacturer

Substitutions are encouraged, in the spirit of promoting research and development.
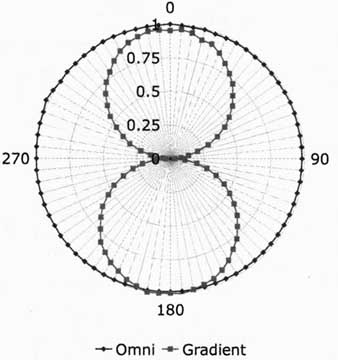
Above: Fig. 8A: Measured polar response of prototype dipole microphone, showing
omni and gradient signals at 300Hz, lm distance, with averaging equal to 4.
Side rejection is almost 30dB. Plot is normalized to on-axis omni response.
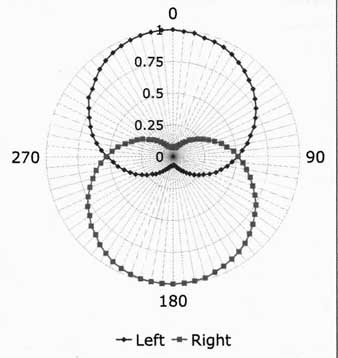
Above: Fig. 8B: Measured polar response of left and right cardioid signals
at 300Hz, 1 m distance, averaging of 4. Rear rejection is greater than 20dB
in both directions. Proximity effect is minimal at this distance. Plot normalized
to on-axis response.
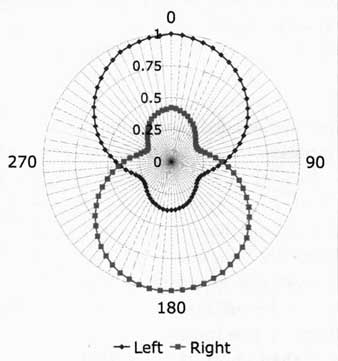
Above: Fig. 8C: Measured polar response of left and right cardioid signals
at 300Hz, 10cm distance, averaging of 4. Proximity effect causes a loss of
rear rejection at this frequency. Plot normalized to on-axis response.

Above: Fig. 9: Measured frequency response of left and right cardioid signals
measured at lm with averaging equal to 4. Left and right curves are superimposed,
with dipole axis at 00, 90°, and 180° with respect to the source. All curves
are normalized to the 90° response of the rear capsule. Side response is down
6dB, as it should be. Rear rejection is 20dB or better from 200Hz to 10kHz
from either side, which is quite respectable.
You could add more capsules to obtain higher order polar patterns or to simulate larger diaphragm microphone designs. The electret capsules weren’t modified for improved headroom, as reported by some authors. I haven’t used any acoustical elements in this design, but you could certainly do that as well.
CONCLUSION
So what does a dipole microphone sound like in actual use? To find out, I recorded a rehearsal of some musician friends. The left- and right-facing cardioid pat terns cleanly divided the group into two bunches, with a few stragglers in between. The bidirectional cardioid pattern could be useful in cases where the only place you can put a microphone is in the middle of the stage. Note that the sum of the left and right signals is just the omni response. This really is a special-purpose microphone as designed, but it holds out lots of promise for future development.
Mechanical noise, coupled from the floor through the mike stand, is tolerable but needs improvement. Signal amplitude is awkwardly positioned between microphone level and line level. Some of the outputs are inverted in terms of absolute phase. Self-noise out of the analog computer is acceptable but needs work. Wind and pop noise sensitivity are high as expected, and readily improved with a generic open-cell foam windscreen. p. 1.
Proximity effect is less than I’ve experienced with other microphones, and may take some getting used to. Now I can begin the real work of correlating measured results with listening performance, for both purchased microphones, and those of my own design. For more on the test methods used here, go see below REFERENCES.
REFERENCES
1. A.D. Blumlein, “Sound-Transmission, Sound-Recording, and Sound-Reproducing System,” U.S. Patent #2,093,540 (Sept.1937).
2. J. Eargle, The Microphone Book, Second Edition (Focal Press, Oxford, 2004).
3. G.W Elko and A.N. Pong, “A Steerable and Variable First-Order Differential Microphone Array,” 1997 IEEE International Conference on Acoustics, Speech, and Signal Processing, Vol. 1, pp. (1997).
4. L.L. Beranek, Acoustics (Acoustical Society of America, Woodbury, 1993).
5. H.F. Olson, Acoustical Engineering (Professional Audio Journals, Philadelphia, 1991).
6. G.B. Arfken and Hj. Weber, Mathematical Methods for Physicists, Fifth Edition (Academic Press, San Diego, 2001).
7. Henning Møller and Carsten Thomsen, “Electroacoustic free-field measurements in ordinary rooms—using gating techniques,” Bruel & Kajer Application Note 17-196 (1975).
8. Roger Sanders, “A Simple Shock Mount for Your Microphone,” The Audio Amateur, #1, 1972,.