Impedance against frequency
It can be extremely useful to measure impedance against frequency. Power amplifiers are carefully designed by plotting loadlines that cunningly maximize output power and minimize distortion, yet we connect them to real loudspeakers having wildly varying impedance. Thus, we might wish to determine the actual impedance of our chosen loudspeaker in order to optimize its matching to the amplifier, or to see if it has any unusual features that might cause problems. (A peak in impedance at HF could cause instability in an amplifier.) Alternatively, we might want to determine the output impedance of a power amplifier to verify that it is sufficiently low not to disturb the Thiele-Small [4] parameters of an associated loudspeaker, causing an unwanted bump at low frequencies.
Measuring the impedance of a loudspeaker
A single magnetic loudspeaker has a non-flat impedance curve for two reasons:
-- The moving mass (usually a cone) and its suspension (usually a spider) combine to produce a low-frequency mechanical resonance which is transformed through the motor into a peak in impedance. A typical moving coil bass driver has a resonant frequency between 20 and 50Hz in free air. Tweeters resonate between 500Hz and 1.5 kHz, but the resonance may be so heavily damped (perhaps by Ferrofluid) as to be unobservable.
-- As implied by the name, moving coil drivers have a coil which possesses inductance, causing impedance to rise with frequency. Although the moving element of a ribbon tweeter is very nearly resistive, the necessary impedance-matching transformer has leakage inductance, producing an impedance curve very similar to a moving coil tweeter.
Although it is theoretically possible to compensate the impedance curve for the low-frequency mechanical resonance, it requires inconveniently large component values. Fortunately, compensating for voice coil inductance is practical, requiring a simple CR Zobel network across the loudspeaker terminals (see FIG. 11).
In theory, the required resistance is equal to voice coil DC resistance, and the required capacitor is found using:
C_Zobel = L_voice coil/R^2 _DC
Most manufacturers specify voice coil inductance, enabling the required capacitance to be calculated easily. In practice, the value is only guide, so it is better to connect the calculated Zobel network across the driver, then trim its values until a flat impedance results. A variable capacitance box makes life much easier, and they are surprisingly cheap second-hand (see FIG. 12).
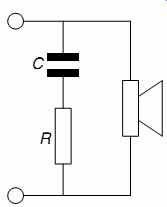
FIG. 11 A simple Zobel network can compensate for a loudspeaker's voice
coil inductance
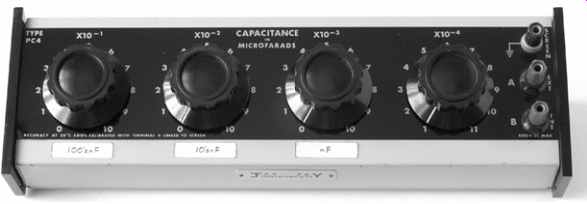
FIG. 12 Capacitance (and resistance) boxes are surprisingly cheaply available
second hand, and are very useful
The easiest way to measure loudspeaker impedance is to make a potential divider from your oscillator's output resistance and the loudspeaker's impedance, then measure its attenuation (see FIG. 13).
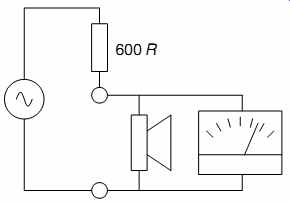
FIG. 13 Measuring loudspeaker impedance
We make the assumption that the oscillator has a constant output resistance with frequency, then use the potential divider equation in reverse to find the lower resistance:
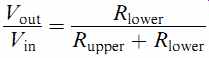
Rearranging:
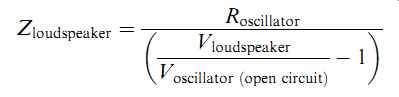
Note that the attenuation term has been inverted, and that we must measure the output voltage of the oscillator without any loading, before connecting the loudspeaker across it. Since an awkward calculation is required to derive the impedance, and it is quite likely that Vin and Vout were actually measured in dBu but must be converted back into absolute voltages, a spread sheet is ideal both for the calculations and for plotting the graph. As an example, a modern ribbon tweeter was measured before and after a Zobel network was added (see FIG. 14).
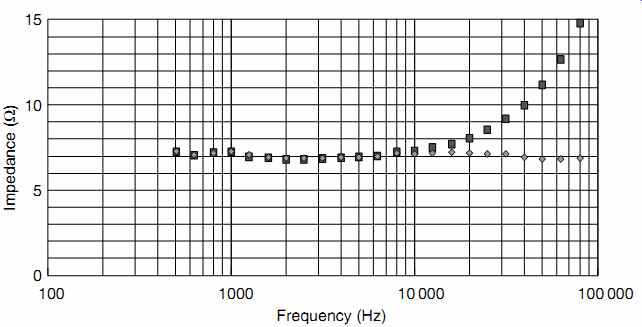
FIG. 14 Impedance against frequency of a ribbon tweeter before and after
compensation with a Zobel network.
The graph shows two plots: one naked, and one showing the effect of a parallel Zobel network consisting of an 8R2 resistor and 500 nF capacitor that converted a rising impedance into a very nearly resistive 7 Ohm load.
Purely resistive loudspeaker loads are desirable because:
-- Non-resistive loads demand current that is out of phase with the applied voltage. Deviation from a perfectly straight load line in the amplifier is likely to cause distortion.
-- Reactive loads can provoke HF instability in some amplifiers.
-- Unless the amplifier has zero output impedance, a varying load impedance with frequency creates a potential divider having attenuation varying with frequency. This results in an amplifier/loudspeaker combination that has an amplitude response that varies with frequency (because the impedance of the loudspeaker varies with frequency). Even if the errors are quite low amplitude (<1 dB), broadband errors are very noticeable, so they must be avoided.
Measuring the output resistance of a pre-amplifier
The output resistance of a pre-amplifier can be measured very easily by setting a convenient open-circuit output voltage, then loading it with a variable resistance, and adjusting that resistance until the output voltage halves. At this point, the load resistance is equal to the source resistance, so the load resistance is removed and measured with a DVM, or if a resistance box is used as the load, the output resistance can be read directly (see FIG. 15).
When used with x10 probe, an oscilloscope has an input resistance of 10 M-ohm, which is certainly high enough to be able to measure the open-circuit voltage of any practical pre-amplifier.
So if we were to adjust the signal at the input of the pre amplifier to produce a 6Vpk-pk sine wave on the oscilloscope, it would have a vertical sensitivity of 1V/div. If the sensitivity were changed to 0.5V/div, and the variable resistor adjusted to restore the original deflection of six vertical divisions, then the output voltage of the pre-amplifier would have been halved. The variable resistor could now be removed and its measured value would be equal to the output resistance of the pre-amplifier.
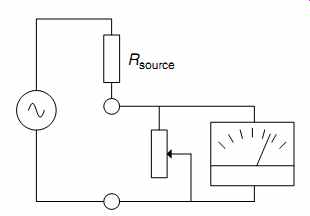
FIG. 15 A variable resistor across the output of a pre-amplifier allows
output resistance to be determined quickly and easily.
Measuring the output impedance of a power amplifier
Power amplifiers are designed to have very low output impedances (ideally a fraction of an Ohm). If the previous method were used to measure the output impedance of a transistor power amplifier, the amplifier would be destroyed or would shut down. We need a different method. The way to measure a power amplifier's output impedance is to use a variation of the method used for determining loudspeaker impedance (see FIG. 16).
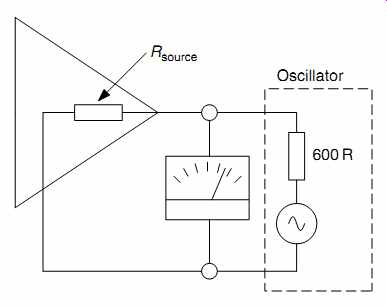
FIG. 16 To measure a power amplifier's output resistance, we connect it
across an oscillator and see how well it can attenuate the oscillator.
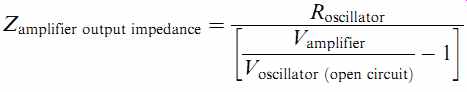
We short-circuit the input of the amplifier to ensure that it cannot produce a signal. We then connect a meter directly across the output terminals and also connect our oscillator across the output terminals. Because the amplifier is designed to have almost zero output impedance, it should be able almost completely to attenuate the output of the oscillator. We use the same equation for determining amplifier output resistance as we used for the loudspeaker:
Disappointing results tend to fall out from this measurement (see FIG. 17).
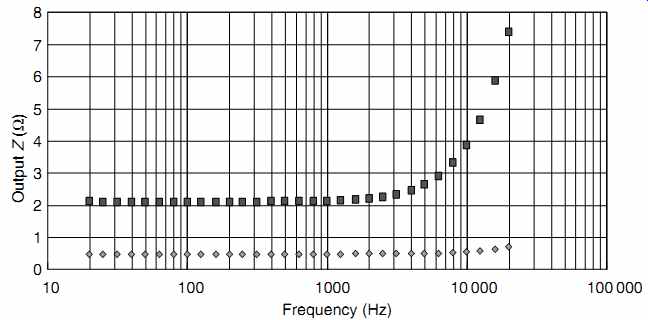
FIG. 17 Output impedance against frequency for two power amplifiers. Lower:
Crystal Palace push-pull amplifier with global feedback. Upper: Scrapbox Challenge
single-ended amplifier with zero global feedback. Both amplifiers were configured
to drive an 8-ohm load
The output impedance is invariably higher and changes more with frequency than would be expected from a simple consideration of output tube r_a transformed by the square of the output transformer turns ratio. The reasons for this are:
-- Valves in practical circuits rarely achieve the stunningly low values of r_a quoted by manufacturers on their data sheets.
-- The output transformer secondary resistance and reflected primary resistance are in series with r_a.
-- The leakage inductance of the output transformer is in series with r_a.
-- Feedback amplifiers must reduce their feedback at high frequencies to maintain stability. Feedback reduces output impedance, so if feedback reduces with frequency, its ability to reduce output impedance is reduced, and output impedance rises with frequency.
Precautions must be observed when using this method of measuring output impedance.
The test set-up must not be plugged or unplugged with the power amplifier switched on, or there is a danger of short circuiting the output of the amplifier (which can destroy a transistor amplifier). The oscillator must be set to produce a high output voltage, but the power amplifier attenuates the oscillator so effectively that the meter/oscilloscope must be set to a high sensitivity. If the amplifier is switched off without first decreasing the sensitivity of the meter/oscilloscope, the resulting gross overload could damage the meter/ oscilloscope.
Another possible problem is that the oscillator may object to driving a high level into a short circuit, and its current limit may operate. Sweep the entire audio frequency band to ensure that it doesn't current limit, and if it does, back the level off.
The test makes the assumption that the output resistance of the oscillator is a constant resistance. Some oscillators may not conform to this ideal, so select the lowest source resistance available and add an external series resistor. The value of the resistor depends on the individual design of the oscillator:
-- Dedicated audio test sets were designed to be able to drive 600-ohm music lines, and a constant output resistance with frequency was part of their design requirement. They do not need an external resistor.
-- Modern bench audio oscillators tend to base their design on operational amplifiers, so they have an internal output resistance of zero which is built out by a series resistor to give the specified output resistance. They are unlikely to need an external resistor.
-- Old bench audio oscillators are likely to use a transformer to couple to their output terminals. Their output resistance is not necessarily constant. If in doubt, select the lowest output resistance, and add a series resistor of ten times that value to swamp any variations. (The series resistor should be precise and non-inductive, so a metal film type is ideal.) Non-linear distortions
Non-linear distortion implies that the output is not simply a scaled replica of the input, but that additional frequencies have been added as a result of non-linearity within the DUT.
Maximum output power and distortion versus level
One of the most important specifications of a power amplifier is the amount of power that it can deliver into a specified load impedance. There is plenty of scope for argument in defining what constitutes ''maximum power''. Possibilities for defining maximum power are:
-- The power developed at, or just before, the point when clipping of the output waveform can be observed on an oscilloscope.
-- The power developed when distortion reaches an arbitrary value. Perhaps 10%, perhaps 1%, perhaps even 0.1%.
-- The power developed just before the point when distortion begins to rise sharply.
The first definition is quite useful for amplifiers that employ plenty of global feedback, as distortion tends to be very low until clipping occurs, whereupon it rises catastrophically. Even so, the definition is a little fluffy.
The second definition is popular when measuring zero-feedback single-ended amplifiers, although adjusting the criterion from 3 to 10% is a popular ploy for increasing the perceived value of an amplifier by substantially increasing its measured power output. At the opposite extreme, Leak specified amplifiers by the power they could deliver with 0.1% distortion.
The final definition requires the plotting of a graph of distortion against frequency. This is easy with a modern automated audio test set, but harder with an older, manual test set.
The amplifier is loaded with a dummy load, and the resulting distortion is measured by the audio test set. In addition, the monitoring output of the test set feeds the distortion waveform to an oscilloscope (see FIG. 18).
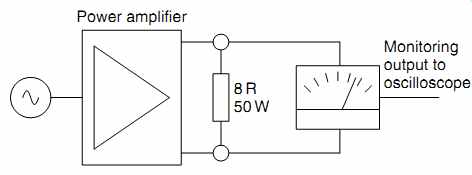
FIG. 18 Determining maximum output power.
Fortunately, when testing tube amplifiers, there is a very distinct point that is very sharply defined and therefore readily identifiable, so it can be used to define maximum output power.
We are not looking for a particular distortion figure (after all, that can be adjusted by negative feedback), rather, we are looking for an abrupt change in the distortion waveform that signifies grid current in the output stage (see FIG. 19).
Comparing the two distortion waveforms, the second wave form has an additional valley at one of its peaks. This valley appears and disappears very sharply with level, so it is ideal for defining maximum power. In this particular test of the author's Crystal Palace amplifier, it defined maximum output power at 1 kHz to be 47W with 0.56% THD. The amplifier delivered 52W with 1.5% THD, just below observable clipping on an oscilloscope.
FIG. 19 A change in output power of only 0.2 dB heralded grid current as evidenced by these distortion waveforms.
No grid current (upper), entering grid current (lower)
Measuring distortion against output power is fiddly with a manual test set, but manageable with care. Calculate the level in dBu for 1W into the test load resistance. Adjust level until the power amplifier develops 1W. Then, increase level in 1 dB steps, recording the amount of distortion at each point until gross distortion results. You can then use a spreadsheet to convert the levels in dBu into power, and plot a graph of distortion against output power (see FIG. 20).
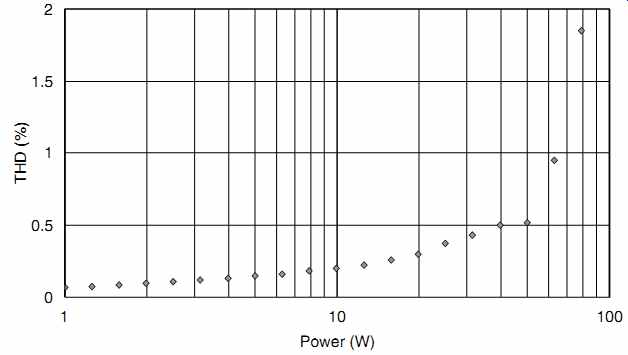
FIG. 20 Distortion against output power at 1 kHz.
Once again, the reason for using a logarithmic scale for output power is that the ear perceives loudness logarithmically.
Looking at the graph, we see a smooth curve with rising distortion and what appears to be a discrepancy at 50W. Considerable effort and number-crunching was required to produce this graph, yet it only tells us what we already knew, and does it less precisely. It seems that plotting distortion against output power is not very useful for finding maximum output power.
Another justification for plotting distortion against output power is that if the distortion rises at low levels, this can be an indicator of crossover distortion. Unfortunately, as all amplifiers produce noise, practical measurements of distortion are not so much THD as THD +N (THD plus noise). As output signal level falls, the noise becomes more significant, so all amplifiers suffer deteriorating THD +N at low levels.
A sudden change in the distortion waveform with level is a powerful indicator of a problem. At high levels, the sudden appearance of a dip indicates grid current (valid for power amplifiers and small-signal amplifiers). Conversely, at low levels, the gradual appearance of triangular spikes as level falls indicates crossover distortion. If you designed the circuit you are testing, you already know which features to look for. If you're testing a single-ended amplifier, there is no need to look for crossover distortion because it is an exclusive failing of push-pull Class AB amplifiers.
Distortion against frequency
A popular test with feedback amplifiers is to test distortion against frequency. The reason for this is that if the amplifier relies on global negative feedback to reduce distortion, the gain before feedback is applied must be maximized, but to maintain stability, this gain must fall with frequency. But feedback can only correct by the ratio between the open loop gain and the required closed loop gain. This means that if the open loop gain is 80 dB and the required closed loop gain is 20 dB, 60 dB of feedback is available for correction. But if only 40 dB of open loop gain is available, and the required closed loop gain is still 20 dB, only 20 dB of correction is available, so distortion must rise. Summarizing, all feedback amplifiers must have distortion that rises with frequency (see FIG. 21).
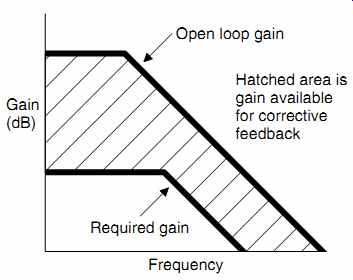
FIG. 21 Open loop gain and available corrective feedback
Transistor power amplifiers often rely on global feedback to lower distortion, so plotting distortion against output power can be quite revealing. Valve power amplifiers almost invariably incorporate an output transformer, so they are typically limited to ~30 dB of feedback before stability becomes distinctly questionable.
Measuring distortion against frequency has to be done very carefully if it is to bear any relation to audible effects. If we measure distortion at 1 kHz, then even the 20th harmonic (20 kHz) is theoretically within the audio band, but if we measure distortion at 10 kHz, only the 2nd harmonic is within the audio band. If the measurement is intended to correlate with audible effects, a 20 kHz low-pass filter must be used, but this would have the effect of making an amplifier producing predominately 3rd harmonic distortion to have falling distortion with frequency after 6 kHz.
Conversely, if we were measuring an amplifier with a view to possible improvement, we would not use the 20 kHz low-pass filter, as this colors the results. As an example, a 10W tube amplifier employing substantial global feedback was tested at 10W (see FIG. 22).
As should be expected from a high feedback amplifier, the distortion is very low at 1 kHz, but rises with frequency in accordance with the falling open loop gain required to maintain HF stability.
In this example, the measured distortion at 10 kHz was exactly ten times that at 1kHz, so the distortion was 20dB worse at a frequency one decade higher. In other words, the distortion rises at 20 dB/decade, which is the same as 6 dB/octave, and is exactly the slope produced by the CR compensation network required to maintain stability. The graph of distortion against frequency mirrors the graph of open loop gain against frequency.
It seems that plotting distortion against frequency doesn't really tell us very much that we didn't already know. However, it does emphasize that over-zealous compensation increases high-frequency distortion. What the graph doesn't tell us very clearly is whether the amplifier might suffer from slewing distortion.
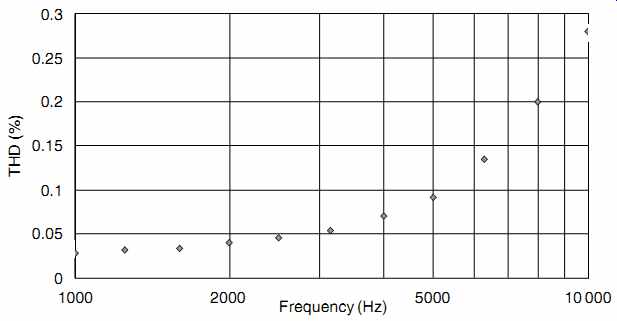
FIG. 22 This 10Whigh feedback amplifier exhibits textbook rising THD with
frequency.
Slewing distortion
A capacitor can change its voltage instantaneously, but it needs an infinite current to do so. At a more practical level, the faster we want to change the voltage across a capacitor, the more current is required. All amplifier stages have input capacitance, so when the preceding stage attempts to change the voltage at the input of the next stage, it must change the voltage across this shunt capacitance. In small-signal terms, the shunt capacitance forms a low-pass filter in conjunction with the output resistance of the preceding stage (see FIG. 23).
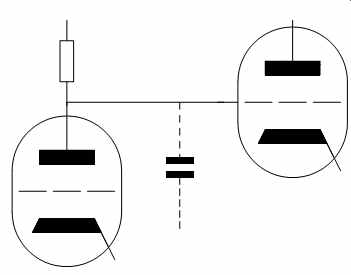
FIG. 23 Shunt capacitance driven by inadequate current causes slewing
distortion
When we attempt to impose a large voltage change quickly, the amount of current that the capacitor can draw may be limited by the quiescent current in the preceding stage. Under this condition, the capacitor charges slower than the input wave form changes voltage, and this distortion is known as slewing distortion. Slewing distortion became particularly noticeable when early operational amplifiers were used for audio, but tube amplifiers are by no means immune to the problem.
Fortunately, the problem is easily detected, if not quite so easily cured.
To test for slewing distortion, drive the amplifier to full power at 1 kHz, then increase frequency to 10 kHz and beyond. At some point, the sine wave will begin to look more like a triangular wave, and this is evidence of slewing distortion (see FIG. 24).
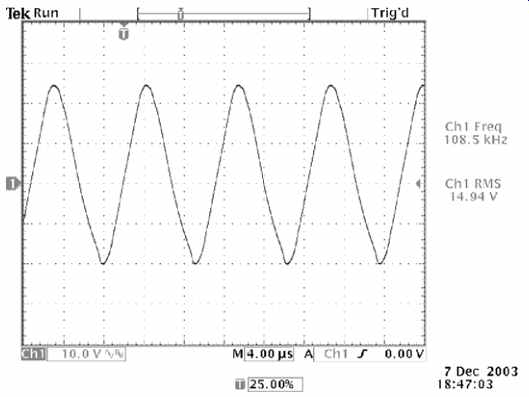
FIG. 24 Slewing distortion turns a sine wave into a triangular wave.
Providing that the effect is not visible at 10 kHz, there probably isn't a problem, but if it occurs at a lower frequency, then the offending combination of stages should be identified and corrected.
The definition of whether slewing distortion is a problem is somewhat woolly, and this is because it all depends on what sort of music you listen to and at what level. Music played on acoustical instruments tends not to generate high amplitudes at 10 kHz, so it rarely provokes slewing distortion, whereas electronically generated music is capable of provoking slewing distortion.
If the patient is a feedback amplifier, the global feedback should be removed and the input level adjusted to restore full power at 1 kHz. Then, change the frequency to 10 kHz and probe inside the amplifier to find the offending combination of stages. Slewing distortion can be tackled by:
-- Substantially increasing the quiescent current in the pre ceding stage (probably by a factor of five) forces a redesign, and a tube having similar mu but higher mutual conductance will probably be required.
-- Reducing the shunt capacitance. Usually the offending combi nation is the driver stage and output stage, because this is where the largest voltage swings occur, and output stages invariably have high input capacitance. Pentodes have far lower input capacitance than triodes, so a triode-strapped output stage could cause slewing distortion! One way of reducing the input capacitance is to insert a cathode follower, but cathode followers are not immune to slewing distortion, so it will probably need to pass five times the current of the preceding stage.
Another possibility for push-pull Class A amplifiers is partly to neutralize the output stage by connecting a small capacitor from each anode to the other tube's control grid. This is positive feedback and needs to be used with great care.
Power bandwidth and transformer saturation
In addition to checking for slewing distortion, it can be useful to check the power bandwidth. This is essentially amplitude against frequency response at full power. The high-frequency -3 dB point at full power is generally limited by slewing distortion and so long as it is beyond 20 kHz, it probably isn't a problem, but the low-frequency power response is more significant.
The low-frequency power response is almost totally governed by transformer core saturation. Rather than looking for the frequency at which output power halves (-3 dB), which would imply gross distortion, it is kinder to the output tubes to measure the frequency at which distortion begins to rise (see FIG. 25).
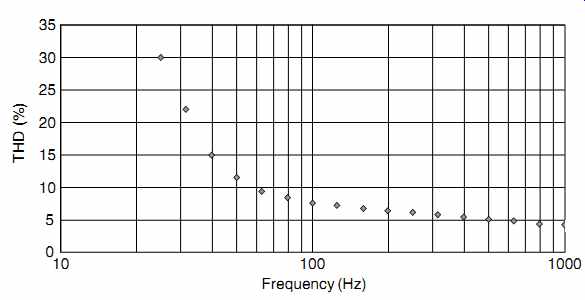
FIG. 25 Transformer core saturation causes increased distortion at low
frequencies (This ill-suited transformer was deliberately chosen to ease measurement.)
The graph shows the distortion of a zero feedback single-ended amplifier with an ill-suited output transformer having insufficient primary inductance. As can be seen, once frequency falls below 60Hz, distortion rises dramatically.
Typical classic push-pull amplifiers could generally support full power down to 50Hz before transformer saturation caused distortion that was visible on an oscilloscope. On test, the Crystal Palace amplifier produced 1% THD at full power at 22Hz, and reducing frequency until transformer saturation became visible on the oscilloscope required 11Hz, but produced pulsing orange flashes from within the output tubes, so the test was hurriedly abandoned.
Investigating the distortion spectrum
If you are able to perform an FFT on the distortion waveform, or have a wave analyzer allowing you to measure individual distortion amplitudes, this can be very useful.
To find individual distortion amplitudes, we need to make a sweeping assumption. Fortunately, the assumption is usually valid. The assumption is that one of the distortion harmonics is much higher level than the rest, >6 dB higher will do, but >10 dB is better, it doesn't matter which harmonic it is. provided that this assumption is true, then the THD measured on the audio test set is equal to the amplitude of that individual harmonic.
As an example, the author tested one section of a 7N7 as the lower tube in a mu-follower amplifier:
Levels measured by FFT or wave analyzer
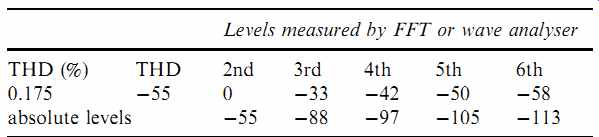
The absolute level at the monitoring output of the audio test set is unimportant. What is important is the relative amplitudes between the 2nd harmonic and the higher harmonics. Because the 3rd harmonic is _33 dB compared to the 2nd, the sweeping assumption that the level of the highest harmonic is equal to the level of the THD is justified, so (having converted THD into dB) we can immediately deem the result to be the level of the 2nd harmonic. The higher harmonics were all measured relative to the level of the 2nd harmonic, so their absolute levels can easily be found. In this example, the technique has produced some remarkably low levels for the 4th and higher harmonics, so it is best to check the distortion residual of the test equipment very carefully before inserting a DUT and believing impressive figures. The author's test equipment is generally reliable to ~ -95 dB.
Investigating the distortion spectrum of an amplifier is a very powerful technique for choosing between different tubes and bias points. In theory, it ought to be good for detecting power amplifier problems, but in practice, observing the distortion waveform on an oscilloscope is faster and more sensitive.
There are many packages that allow computers to perform the FFT. Beware that when you use these, you are relying on the linearity of your sound card. The sound cards that are supplied with computers are not usually very good, and you will need to install a recording-quality sound card, preferably 24 bit, 96 kHz sampling frequency, or better.
References
1. IEC standard 268 (Sound System Equipment). Part 10: Peak program level meters.
2. ''On Reference RIAA Networks'', Jim Hagerman. ''Audio Electronics'' available at: hagtech.com/iriaa.html.
3. ''On RIAA equalization Networks'', Stanley P Lipshitz. Journal of the Audio Engineering Society, 1979 June, Volume 27, Number 6, 458-481.(1).
4. A series of papers by A. N. Thiele and Richard H Small in the Journal of the Audio Engineering Society starting from May 1971, Volume 19, No. 5 to January 1972, Volume 20, No. 1.