AMAZON multi-meters discounts AMAZON oscilloscope discounts
INTRODUCTION
A block diagram is a simplified diagram of a system, program, or process. Labeled geometric figures and interconnecting lines represent the functional relation ships and flow of information between units or sections. Block diagrams are the easiest form of diagram to draw and read, which makes them ideal for conveying information to people with limited technical knowledge. Technical and sales manuals for electronic and computer equipment make frequent use of block diagrams like the one in FIG. 1.
Block diagrams are used in all areas of business, education, and industry for representing both technical and nontechnical information. Social, psychological, economic, historical, engineering, and technical data can easily be presented in the form of a block diagram.
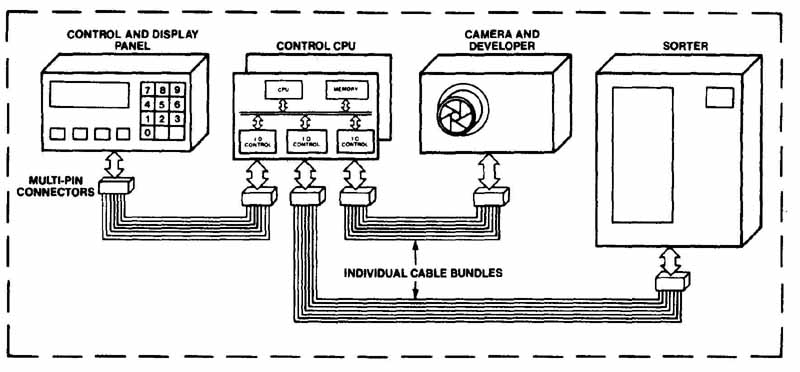
The geometric shapes used on block diagrams are normally kept as simple as possible, although this form can be more artistically rendered than diagrams with strict layout, construction, and symbology specifications. Block diagrams are sometimes drawn in pictorial form. An example of a pictorial block diagram is provided in FIG. 2, a serial I/O interface to a common backplane.
The electronic and computer industries use block diagrams to convey a variety of technical information.
In electronics, block diagrams are used where it is unimportant to show specific circuit connections or the exact electronic component. Each individual block represents a stage, substage, or unit of the total system as an independent function. Individual blocks may represent aspects of a process, as in flow diagrams. Block diagrams are the first step in the design process of a system. The engineer or designer uses the block diagram to describe a particular system with all its related units. The function and purpose of a system can be more readily conveyed and understood when a block or flow diagram is used. The actual composition of each stage or unit of a system, including its connections, circuitry, and components, is not shown on the block diagram.
Blocks may represent individual modules, units, or removable portions of a total system made up of multiple sections. A block may represent something large, such as a complete chassis unit, or something small, for instance, a group of integrated circuits.
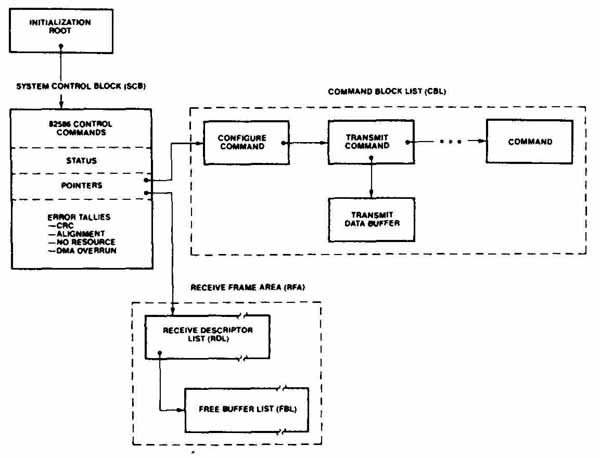
FIG. 1 Block diagrams of memory structures. (Courtesy Intel Corporation)
BLOCK DIAGRAMS
A block diagram—as its name implies—is a diagram composed of block shapes. Although a majority of block diagrams are composed of square and rectangular shapes, many companies use other simple geometric forms, such as ellipses, circles, and triangles. Specialized electronic symbols for antenna, ground, switch, and so on, may also be incorporated into a typical electronic block diagram. FIG. 3 is a typical example of a block diagram. Note that block diagrams show only the functional relationship between specific stages of a total process.
The term functional sequence or functional relationship is extremely important in understanding the construction and interpretation of block diagrams. The functional sequence of an operating device determines the flow between units of a system. The term flow signifies that something is moving from one place to another.
Therefore, a flow must start at one point and end at another in other words, it must have an input and an output. The input for most block (and other) diagrams is placed on the left of the drawing and the output is on the right, as in a book the words are read from left to right. Whenever possible, electronic diagrams are constructed with this left-to-right sequence. Note that most computer flow diagrams are normally drawn with a top-to-bottom flow direction. Some electronic block diagrams use a top left-side input and a bottom right- side output, although the left-to-right sequence is preferred.
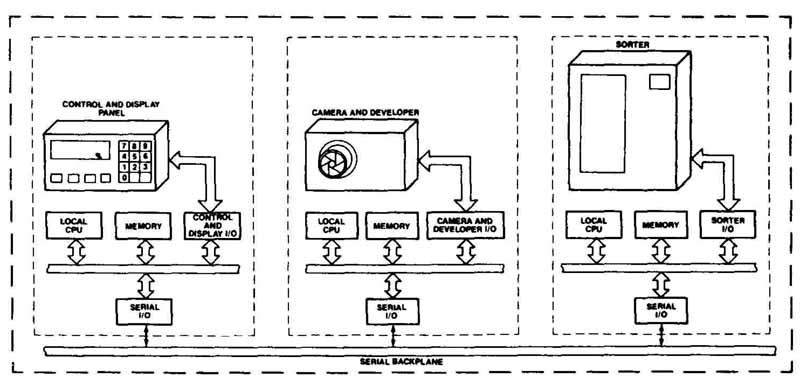
FIG. 2 Pictorial block diagram of serial backplane connection. (Courtesy
Intel Corporation)
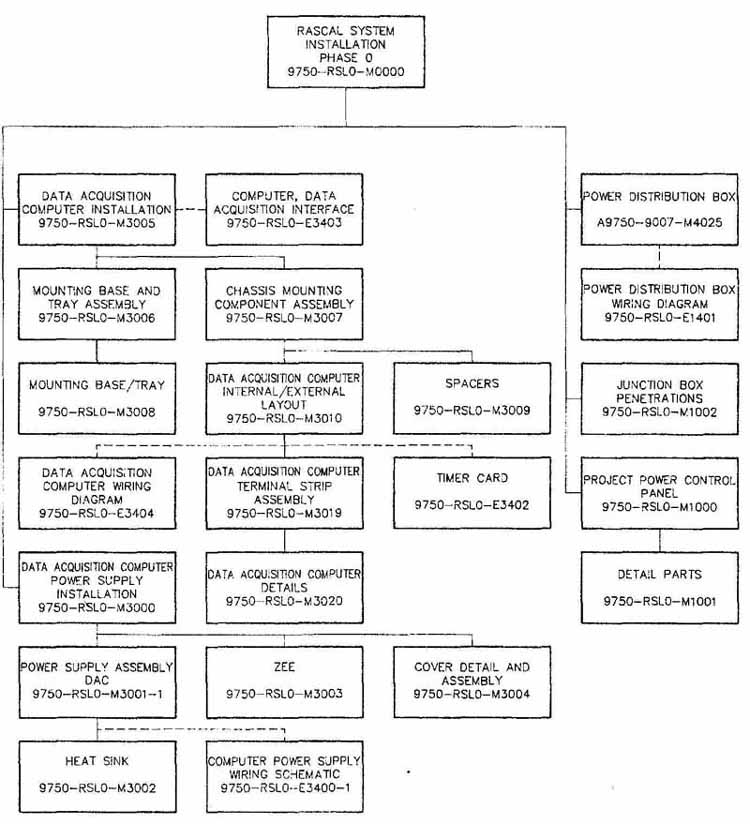
FIG. 3 Block diagram.
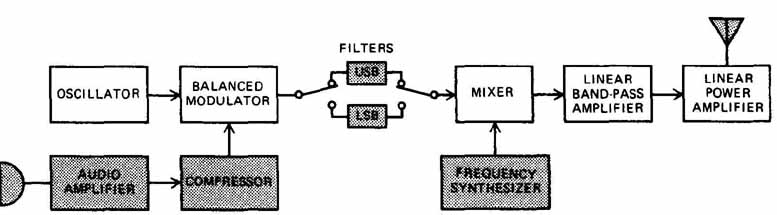
FIG. 4 Single-sideband transmitter.
The single-sideband transmitter shown in FIG. 4 provides a simple example of the left-to-right flow sequence. The flow starts on the left with the audio amplifier and ends on the right side at the linear power amplifier. It is then coupled through the antenna system. Note that the flow from left to right is common, but some systems will feed back, or send a signal back through the system. This feedback may move from right to left or in a loop fashion.
Since the purpose of a block diagram is to depict the functional flow between related units of a system, each successive unit depends on the preceding unit. If one unit precedes another, it must be assumed these units are also related in time. One comes before another; therefore, the preceding unit is before the next unit in terms of real time. For all practical purposes the exact measurement of the time between units is zero, except when you attempt to understand the operation of a particular piece of equipment. Here, time and functional sequence are critical.
It must also be understood that if something flows from one point to another, through a sequence of steps; units, modules, or operations, that same movement precludes backflow, or the reversal of a signal (except when a system is designed to have a specific feedback capability).
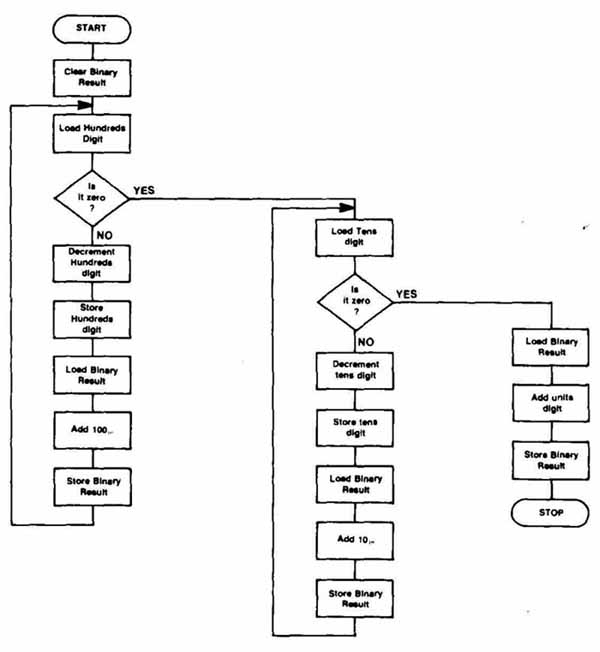
FIG. 5 Computer flow diagram.
Block diagrams of a system can be established on several levels. They can be used to describe the functional relationship between major units, for instance, the sequence of operation for a stereo system: turntable to tuner—amplifier to speaker. A block diagram can also describe the relationship of specific subunits of just the amplifier. Component-to-component block diagrams are seldom used.
In summary, a block diagram can be more accurately defined as a series of geometric shapes depicting the functional relationship between individual units or subdivisions of that system. The functional sequence of a block diagram is based on a flow from one unit to another. This flow may be thought of as time related; one unit functions before each successive unit even if the exact time cannot be realistically measured. Block diagrams can be used to represent technical data, computer program or equipment flow processes, or electronic device or equipment operation sequence.
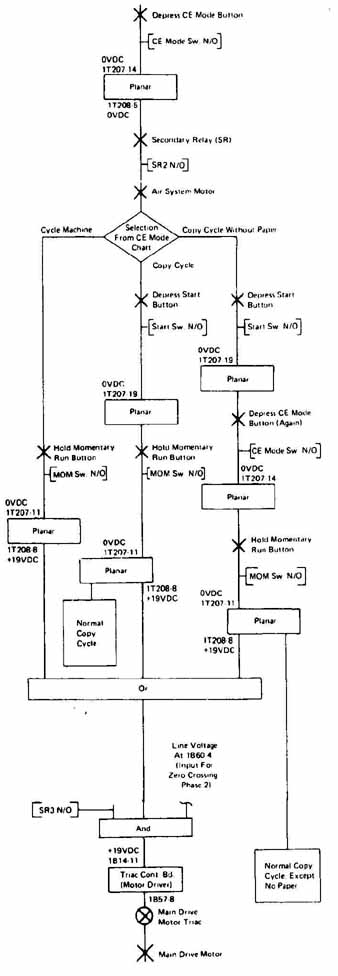 FIG. 6 Flow diagram. (IBM Corporation)
Flow Diagrams
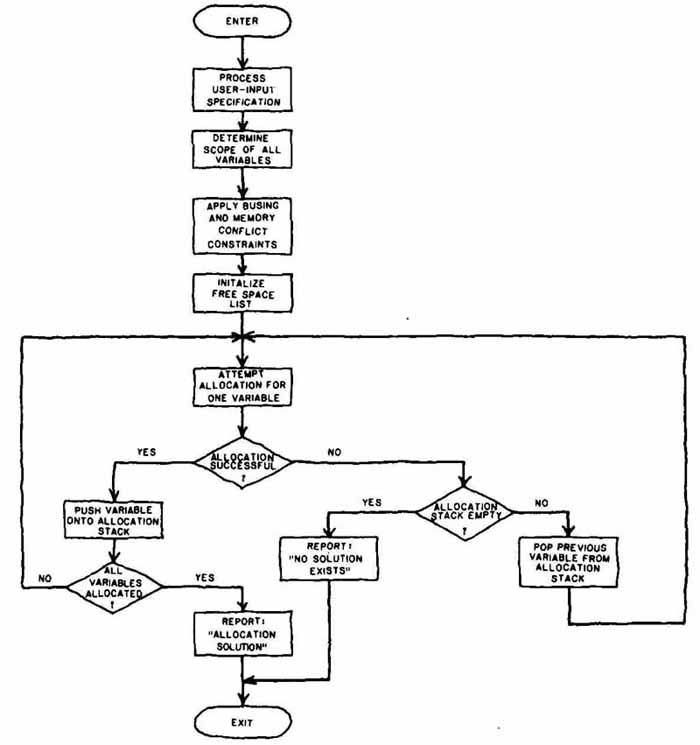
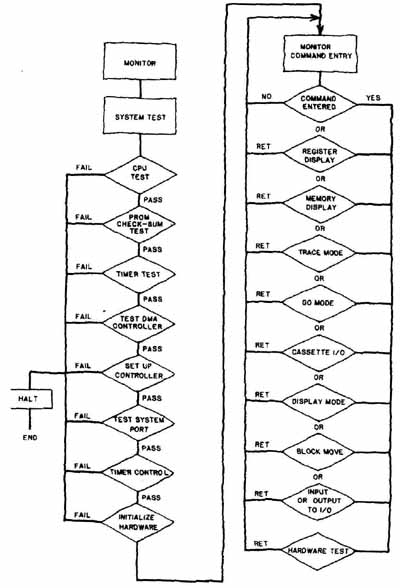
Flow diagrams are used primarily for the presentation of computer program data, as shown in FIG. 5, or operation instructions and processes, as in FIG. 6. In both of these figures the flow direction is from the top down. Note the use of a variety of geometric shapes. Flowcharts such as these are laid out along a main centerline with the blocks evenly spaced to form a pleasing, easily interpreted diagram. More than one centerline is used for diagrams that need to depict double or multiple flow. The actual connecting flow lines between the geometric shapes are always drawn vertically and horizon tally (perpendicular). Angled and curved flow lines are not recommended.
Legend, title, and function words are lettered in the same style and are normally centered within the block (Figs. 5 and 6). These figures use both upper- and lowercase centered lettering. Note that, when two or more lines of lettering are required, symmetrical lettering should be placed around a common centerline. The size of lettering is determined by the smallest possible reduction of the drawing. Block size is determined by the space needs of the largest title, and all similarly shaped blocks should be the same size.
Computer Diagrams
Block diagrams are used throughout the computer industry to describe the organization of computer systems, as illustrated in FIG. 7. Each block in this computer organization diagram represents a series of complicated circuits and components. When preparing computer diagrams, try to maintain a uniform block size to represent similar devices or functions.
In FIG. 8 a diagram is used to depict a single- component, microcomputer chip. This component was formed by large-scale integration (LSI) processes and is an entire circuit in itself. A block diagram is used to represent the circuit functions on this single chip. FIG. 9 is a photograph of an actual microcomputer chip. It includes blocks drawn around the functional areas of this chip. A functional block diagram for the chip would be very similar to FIG. 8.
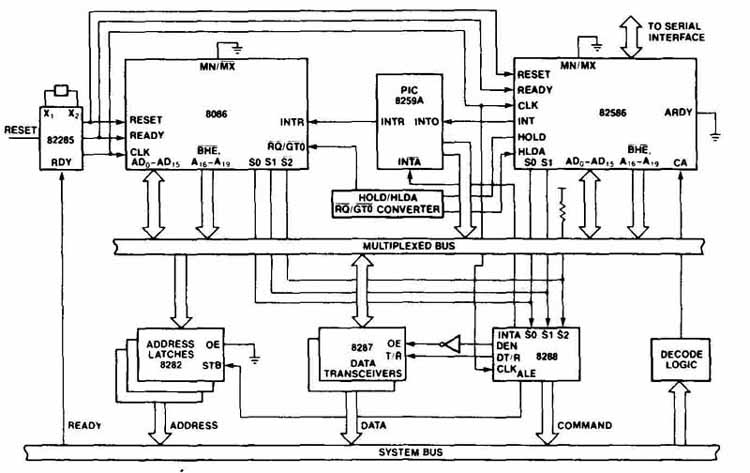
FIG. 7 Block diagram showing computer organization. (Courtesy Intel
Corporation)
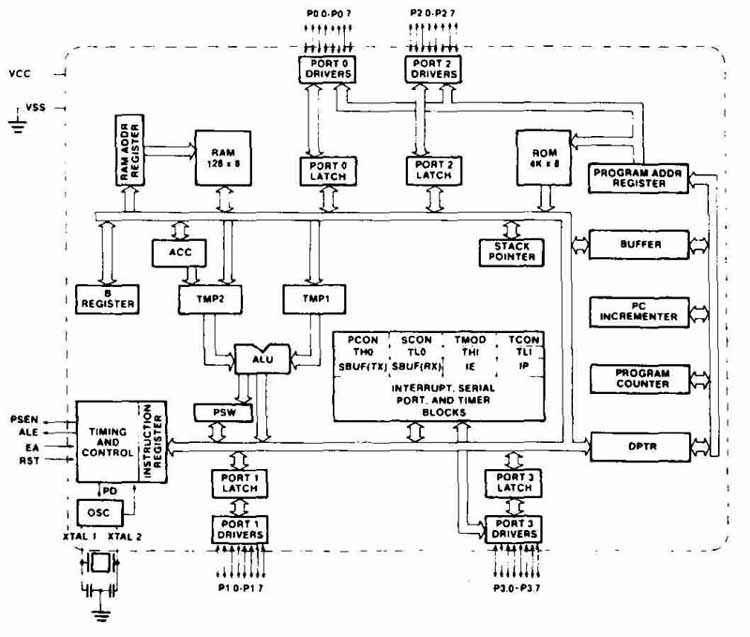
FIG. 8 Block diagram of single-component microcomputer. (Courtesy Intel
Corporation)
Electronic Block Diagrams
The JIC defines electronic block diagrams like this:
EL2.7.1 Block Diagram. The block diagram of the complete system indicates the basic purpose or function of each portion of the electronic system and its relation ship to the overall system. Each block shall be identified and cross-referenced in a manner that the internal circuitry may be found readily on the elementary and related diagrams.
Preparation of a block diagram, and any other diagram, must be made to give the utmost in clarity. Good drafting practices, lettering, and linework, as discussed in Sections 2, 3, and 4, must be applied to the drawing of all diagrams.
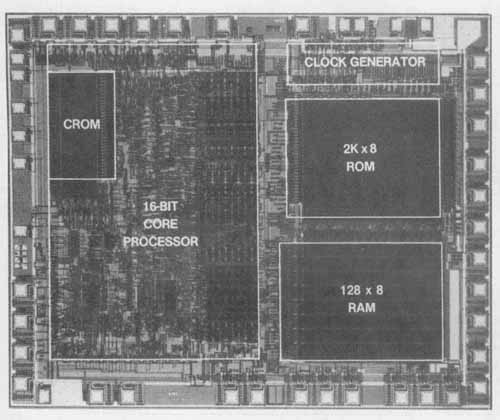
FIG. 9 A microcomputer chip. (Courtesy American Microsystems, Inc.)
Electronic block diagrams originate with the design engineer in the form of a sketch. The finished block diagram is drawn by the drafter. It is the responsibility of the drafter to create a balanced, simple, and precise layout of the final drawing. The block diagram in FIG. 10 is an example of a well-designed and well-laid-out block diagram of a stereo tuner—receiver. Note the use of an area corresponding to the right channel drawn with phantom lines at the bottom of the figure. Phantom lines are used to show future circuits or repetitious circuits that need not be redrawn. Missing units may also be shown blocked in with phantom lines. Note that future, missing, or repetitious units blocked in with phantom lines are still connected to the overall diagram in the proper sequence. Dashed lines are also used to show future or auxiliary units.
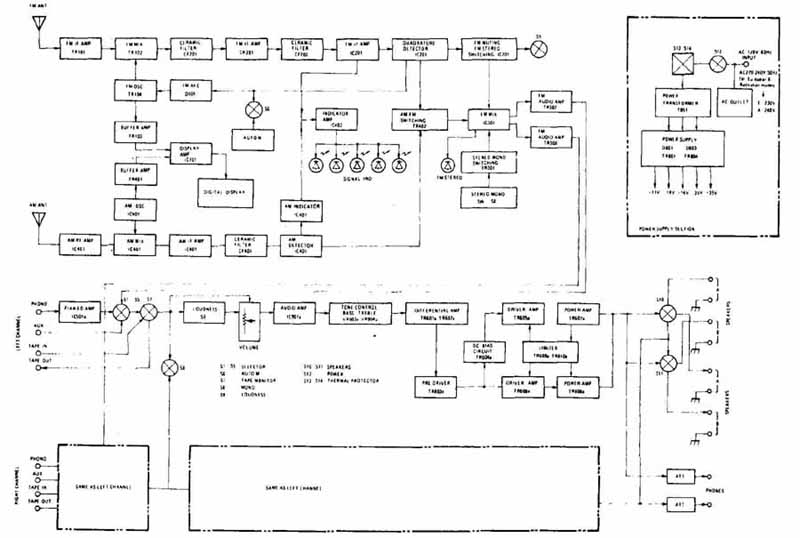
FIG. 10 Block diagram of multiplex stereo tuner—receiver. (Used with
permission from Radio Shack, a division of Tandy Corporation, Fort Worth,
TX 76102)
Block diagrams are drawn with the course of the flow circuit following the most direct path. Blocks should be aligned horizontally and vertically. The number and shape of different blocks should be limited.
After the engineer sketches the block diagram, the drafter lays out the total number of blocks, determines the proper block sizes and configuration, and provides sufficient space between blocks for flow lines. (Suggested specifications for block diagram layout are provided later in the Section.) The drafter may need to re-sketch the diagram a number of times to try various layouts. Grid-lined paper or a grid-pattern underlay are excellent tools for this stage in the process. Counting the total number of flow lines and the required block series will help determine the paper size requirements for the diagram. Some trial and error is normal in this process.
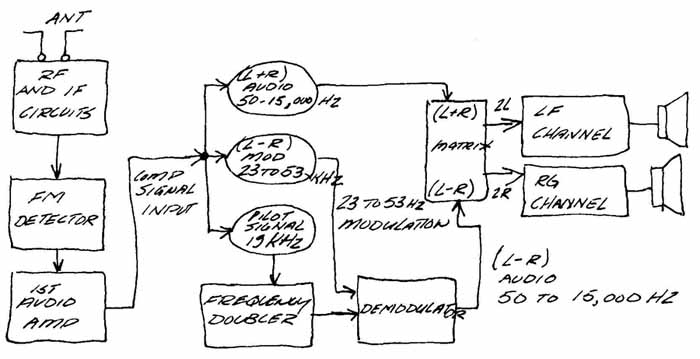
FIG. 11 Trial layout sketch of the FM stereo receiver block diagram
shown in FIG. 12.
FIG. 11 shows a drafter’s trial sketch. This layout sketch was drawn on grid-lined paper. Note that the original engineer’s sketch would be much rougher and labels would be mostly abbreviations. The trial sketch is essential to determine the size of blocks, space needs, and lettering requirements. The drafter’s finished drawing is shown in FIG. 12. When a block diagram is drawn with a CAD system, blocks and symbols may be entered in the drafting library and recalled for placement on the diagram. This process eliminates the need to redraw each repetitious block and symbol.
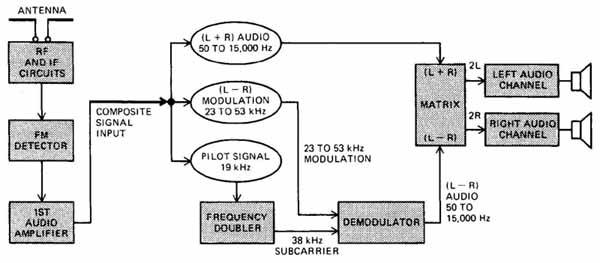
FIG. 12 Completed block diagram of FM stereo receiver. (See sketch in FIG. 11.)
In FIG. 13 (A) a schematic sketch of a simple radio receiver is shown. The schematic has been broken into functional units as a block diagram sketch in FIG. 13 (B) and as a finished drawing in FIG. 13 (C).
The shaded area defines the limits of each unit. In (C) the antenna is incorporated into the first block.
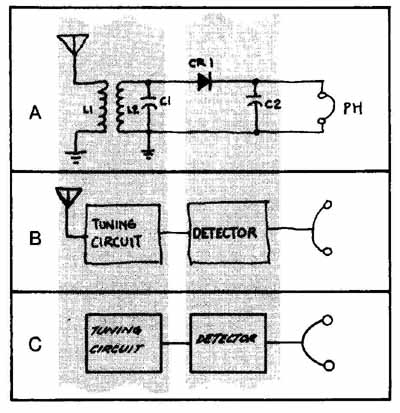
FIG. 13 Simple radio receiver: (A) schematic diagram sketch; (B) block diagram
sketch; (C) simplified block diagram.
CONSTRUCTION OF THE BLOCK DIAGRAM
Block diagrams are made of four major parts: blocks, symbols, flow lines, and lettering. This section highlights each of these areas.
A variety of simple geometric shapes is used for block diagrams, although rectangular forms are the most common, as shown in FIG. 14. Diamond, tubular, circular, elliptical, and triangular forms are used throughout the electronics and computer industry, as illustrated in FIG. 15. Computer flow diagrams make use of a wider range of forms than electronic diagrams, which stress square and rectangular shapes. Special electronic symbols are also used for electronic block diagrams.
Typical block proportions are shown in FIG. 16. Blocks are normally constructed as squares with proportions of 1: 1 or rectangles with proportions of 2: 1, 2.5 : 1, and 3 :2. There is no rule governing the proportions of blocks used for diagrams. Blocks can be placed vertically or horizontally, depending on the needs of the diagram. Most blocks are drawn horizontally, as shown in Figs. 10 and 14. FIG. 12 has one of its blocks vertical.
The choice of size and proportion, as well as whether to use a single size of block throughout the entire diagram, depends on the length of the longest legend or title for the diagram. In some instances, abbreviations are used for legends and titles. Abbreviations are not used when the diagram is meant for nontechnical users. The full title and legend must be included in this case.
Rectangular blocks are sometimes placed with their long sides vertical to accommodate multiple inputs and outputs. The choice of block ratio may depend on the paper or underlay grid size. Grid patterns expedite the arrangement and layout of block diagrams.
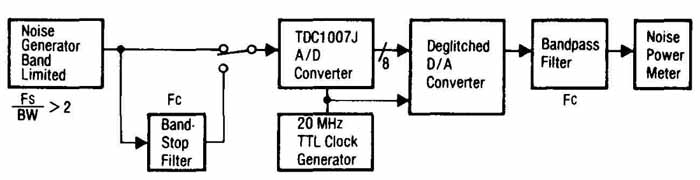
In general, a block diagram should contain as few different sizes of blocks as possible. Some books suggest only one size per drawing; others say that two sizes is the maximum. After reviewing this Section and the many block diagrams provided by industry, you must come to the conclusion that seldom if ever is this rule used in the real world. In FIG. 17, there are five different sizes of blocks out of a total of seven. The complicated block diagram in FIG. 14 uses seven sizes of blocks, although a majority are a single size.
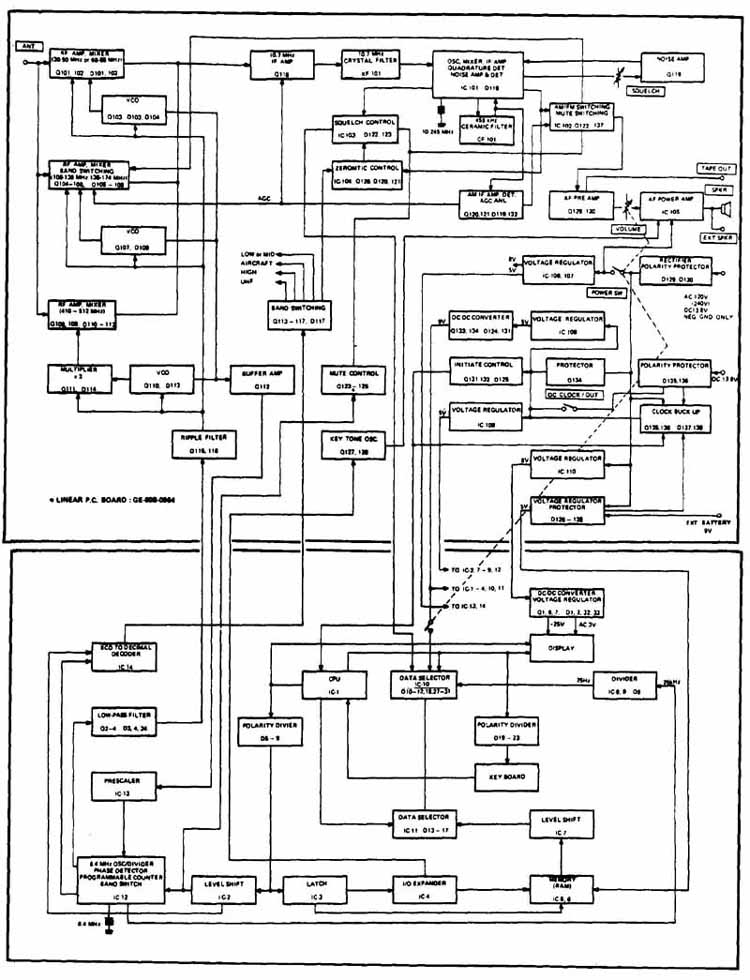
FIG. 14 Block diagram.
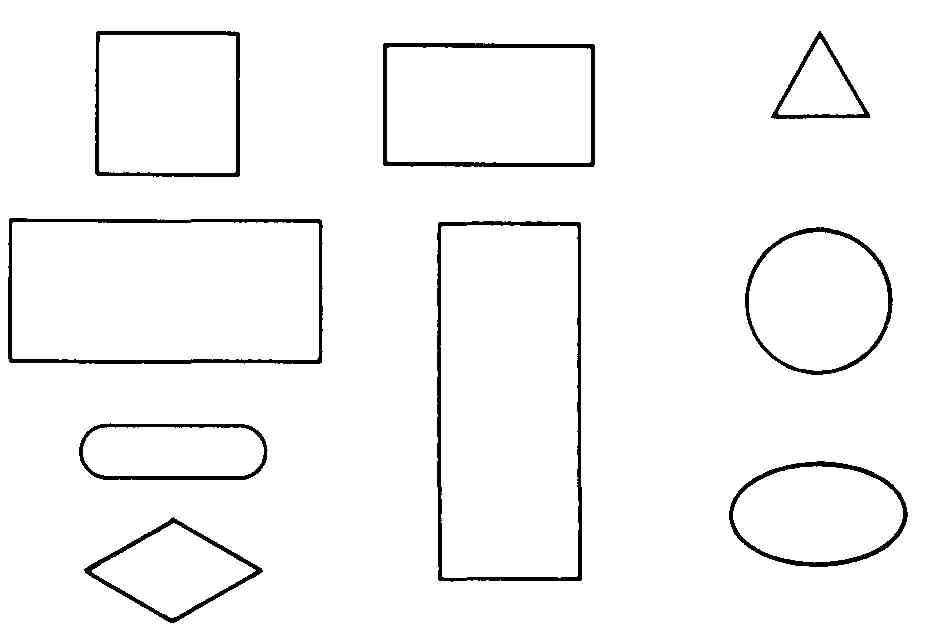
FIG. 15 Common flow diagram and block diagram geometric shapes.
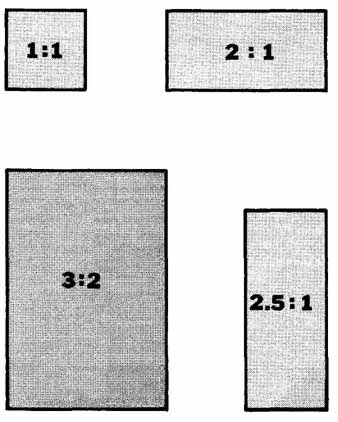 FIG. 16 Common block size ratios.
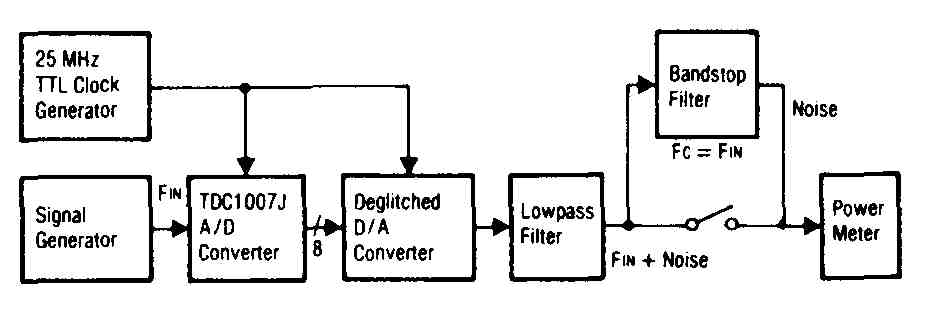
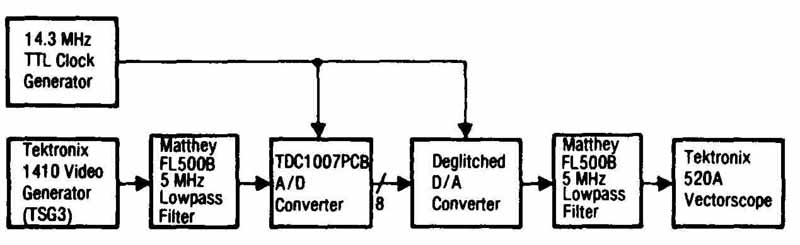
FIG. 17 Block diagram of signal-to-noise ratio (SNR) test setup. (Courtesy
TRW LSI Products)
Blocks are drawn with a medium line weight unless emphasis is required. Blocks drawn with dashed lines are auxiliary or future units. Symbols, blocks, and flow lines use the same alphabet of lines.
Symbols
A few common electronic and electrical symbols are used on block diagrams. They are usually functional units in their own right and are normally depicted with aspects of their real-life configuration. Antennae, ear phones, speakers, and switches are four such symbols. FIG. 18 shows eight typical block diagram symbols.
The tuned frequency receiver shown in FIG. 19 uses symbols and blocks in combination. Two grounds, one antenna, and a set of earphones are connected in sequence with the main units of the system. Note that symbols are usually of support or peripheral equipment. Terminal units, such as grounds, antennae, and speakers, are normally shown as symbols.
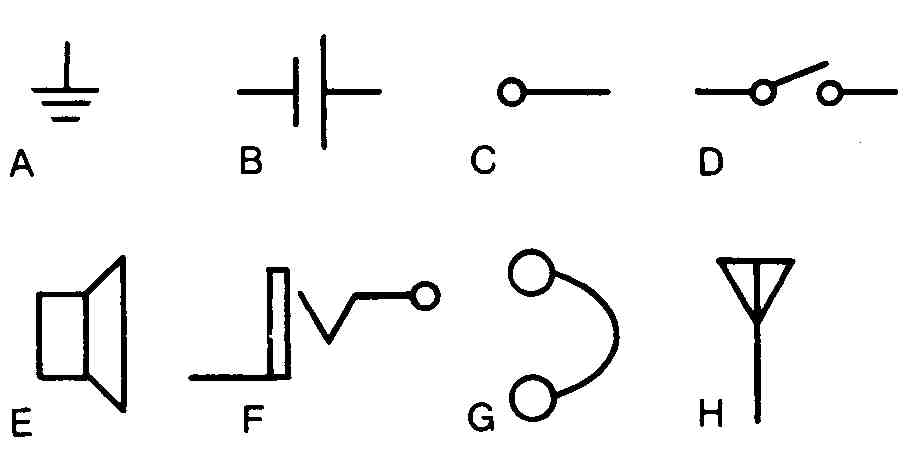
FIG. 18 Common symbols used on block diagrams: (A) ground; (B) single-cell
battery; (C) terminal; (D) switch; (E) speaker; (F) two-conductor jack;
(G) earphones; (H) antenna.
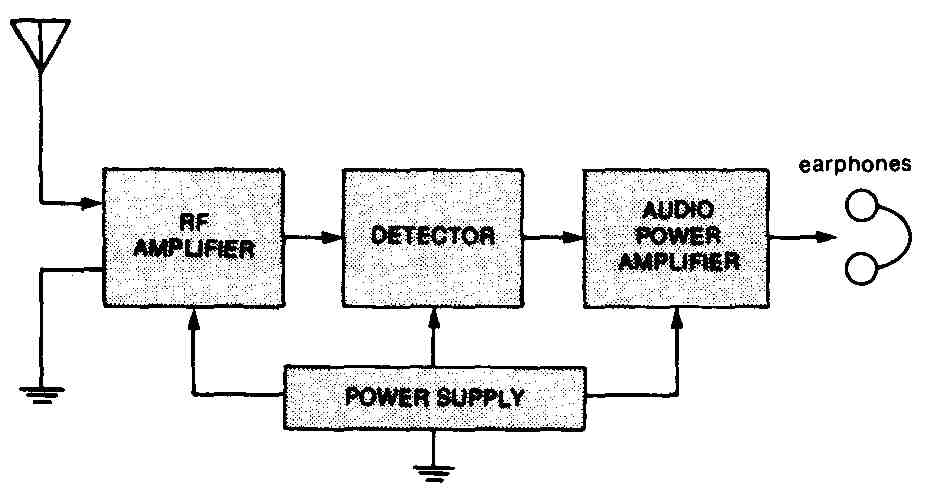
FIG. 19 Tuned frequency receiver.
Flow Lines
Blocks and symbols are connected by flow lines ac cording to the functional sequence of the system. In FIG. 19 the signal depicted by the flow line goes from the power supply into each of the three units. The standard left-to-right flow sequence connects the antenna to the RF amp to the detector to the audio power amp. Flow lines are drawn as solid, medium-weight lines (see Section 3). Dashed lines are used for future or auxiliary lines. Note that dashed lines also represent a mechanism connection or linkage between units. The thickness of the lines should be the same as that used for the blocks. Heavy lineweights are used for lines and blocks where emphasis is needed. Normally, the lineweight is the same for all lines on the diagram.
Diagrams should be constructed to minimize flow line crossovers. All flow lines are drawn with horizontal and vertical lines and make sharp 90-degree corners. Do not use diagonal lines or rounded corners unless this is a company standard.
Crossovers and connections must be clearly presented for the drawing to be properly understood, as shown in FIG. 20. Connecting lines are drawn with as minimum a number of changes in direction as possible. An attempt should be made in the layout stage to limit the amount of corners and crossovers to the absolute minimum. In FIG. 20 (A) a crossover is shown. In (B) an acceptable method of drawing a multiple connection is shown, although (C) and (D) are the preferred method for showing this form of connection or junction.
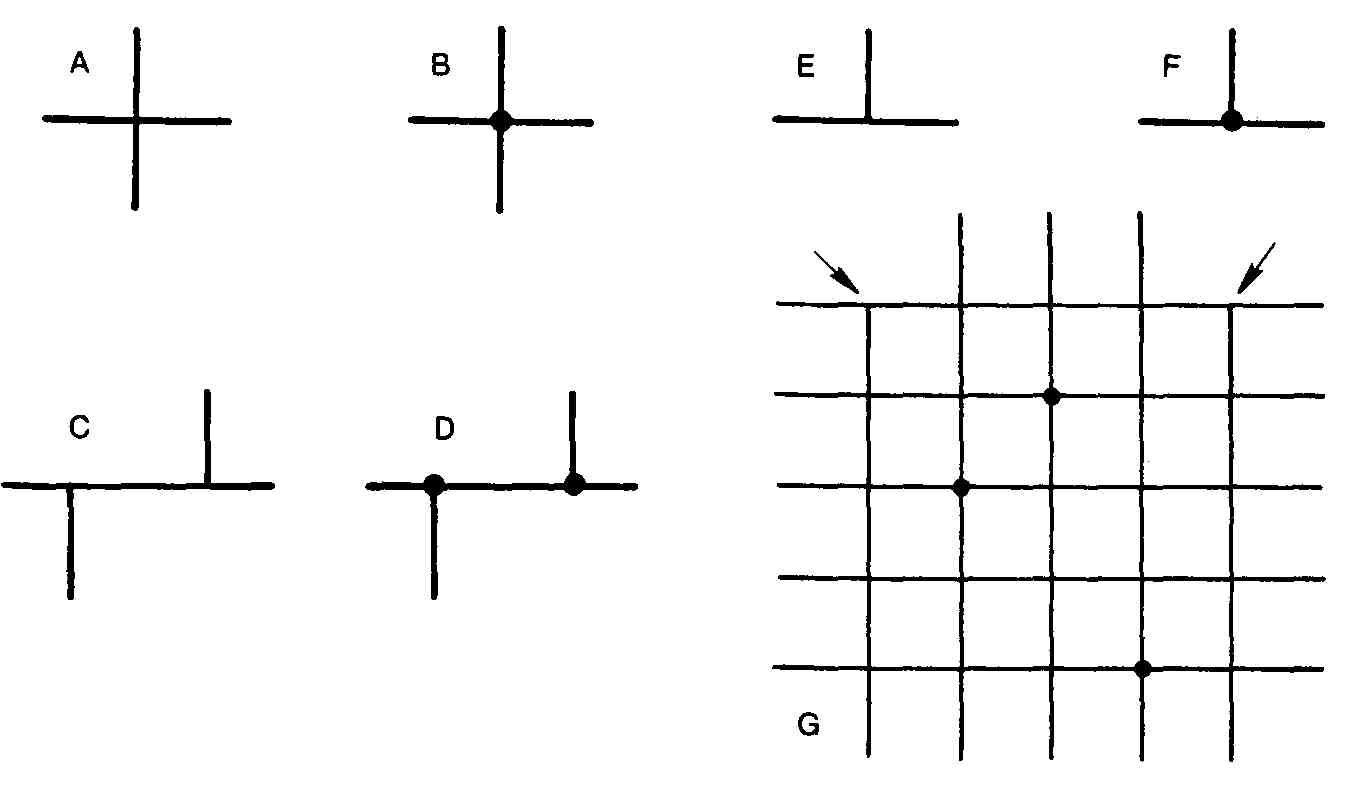
FIG. 20 Crossovers and connections: (A) crossover; (B) multiple connection
(dot method); (C) preferred multiple connection (no dot); (D) preferred
multiple connection (dot method); (E) single connection (no dot); (F)
single connection (dot method); (G) using dots for array of lines (note
that single connections require no dots).
You can designate a connection by placing a dark solid dot about three line widths in diameter at the connecting point, as shown in (F). When a line terminates at another line, it is unnecessary to use the dot, (E). When an array or bank of parallel and perpendicular lines requires connection points, the dot method is used for multiple junctions, as in (G). When a line terminates at a perpendicular line in a single connection, the dot may be eliminated, (G).
These specifications for connections and crossovers can be applied to the layout and construction of schematic, logic, wiring, and other types of electrical and electronic diagrams.
FIG. 21 shows an example of a crossover. The dashed lines for the one block mean that the block is an auxiliary or future unit.
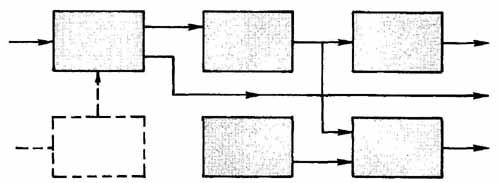
FIG. 21 Crossovers and dashed lines.
Spacing Flow Lines
Spacing of parallel flow lines must take into account the ultimate reduction size of the drawing. Flow lines are arranged in groupings of two and three by the functional relationship of the lines. FIG. 22 shows the suggested spacing for flow lines. Individual lines should be .40 in. (10 mm) apart, and .50 in. (13 mm) between groups of lines will provide sufficient reduction compatibility. The American Society of Mechanical Engineers (ASME) suggests a minimum of .06 in. (1.5 mm) spacing on the drawing’s smallest reduction.
Multiple parallel lines should be spaced according to the same dimensions, as shown in FIG. 23. Parallel lines are to be grouped in twos and threes when four or more parallel lines are together.
The placement of flow-direction arrows on multiple parallel flow lines should be done to eliminate confusion ( FIG. 22). In general, flow arrows may be positioned in a geometric or staggered pattern for more than two parallel lines. Arrows can be aligned for two lines ( FIG. 22).
Arrowheads for lines terminating at blocks are normally placed against the left side of the block (Figs. 21 and 23). Some companies place the arrow head halfway between two units. When a flow line is long, it should have a series of evenly placed flow arrows along its length ( FIG. 21).
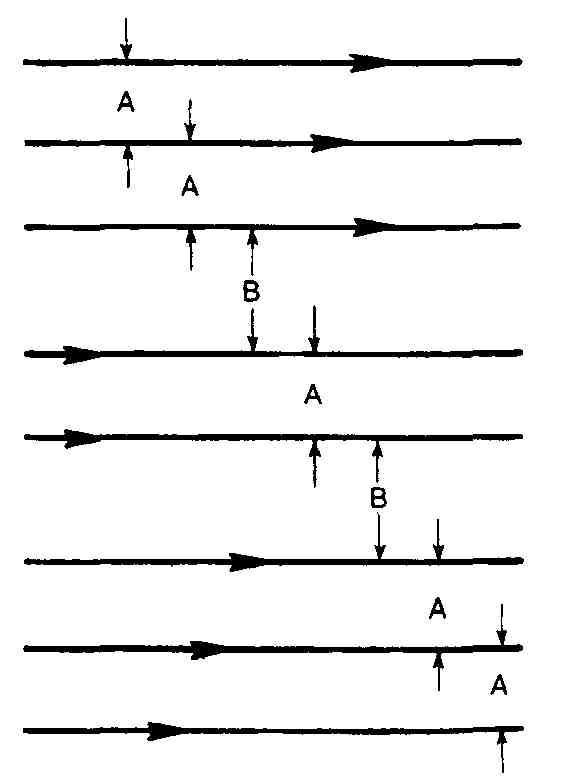
FIG. 22 Layout of multiple (parallel) lines and variations in arrowhead
placement: (A) .40 in. (10 mm) between parallel lines, minimum of .06
in. (1.5 mm) after reduction; (B) .50 in. (13 mm) between groups of lines.
Some suggested spacing dimensions are shown in FIG. 24. Note that a variety of in-house standards are used by individual companies. The suggested spacing of flow lines presented here is provided as a general guideline for diagram construction. There are no standardized construction or layout specifications for the drawing of electronic diagrams. The preceding suggested specifications for flow lines may be applied to logic, schematic, and wiring diagram layouts.
Block Layout
Most block diagrams are laid out so that the flow direction is from the left toward the right. In FIG. 25. the input originates on the left, and the output is on the right. Auxiliary (AUX) units can be placed above or below the unit block to which they have input. Note that the three main units in FIG. 25 are drawn in a row and are evenly spaced.
Blocks are aligned vertically and horizontally for most diagrams. The following simplified specifications can be used to set up a block diagram:
- Vertically align blocks regardless of flow direction, as in FIG. 26.
- Align blocks in rows and columns, as in FIG. 27.
- Maintain the vertical and horizontal alignment when blocks are offset, as in FIG. 28.
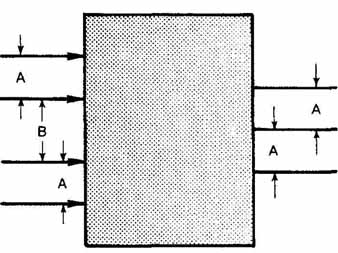
FIG. 23 Line spacing in groups: (A) .40 in. (10 mm) between lines,
minimum of .06 in. (1.5 mm) after reduction; (B) .50 in. (13 mm) between
groups of lines.
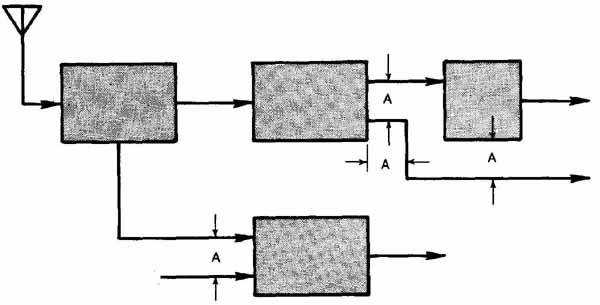
FIG. 24 Line spacing; A = .40 in. (10 mm)
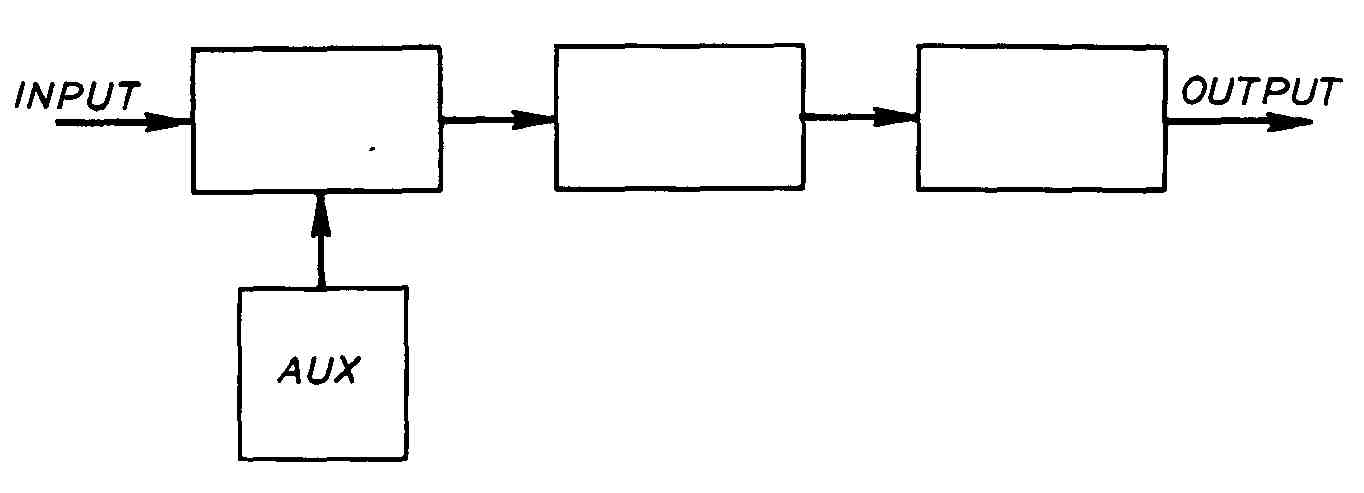
FIG. 25 Flow direction: left to right—input to output.
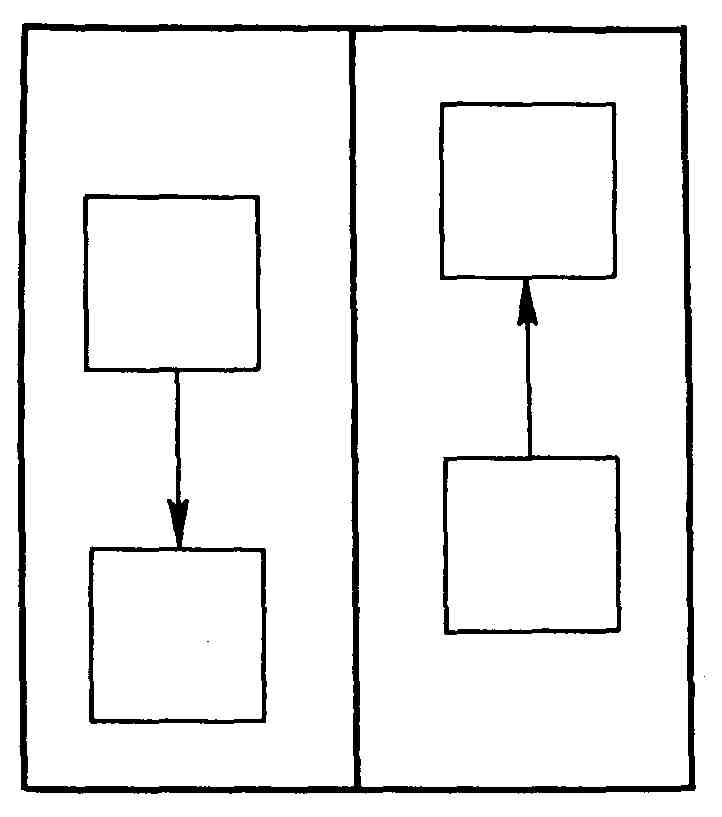
FIG. 26 Vertical alignment of blocks.
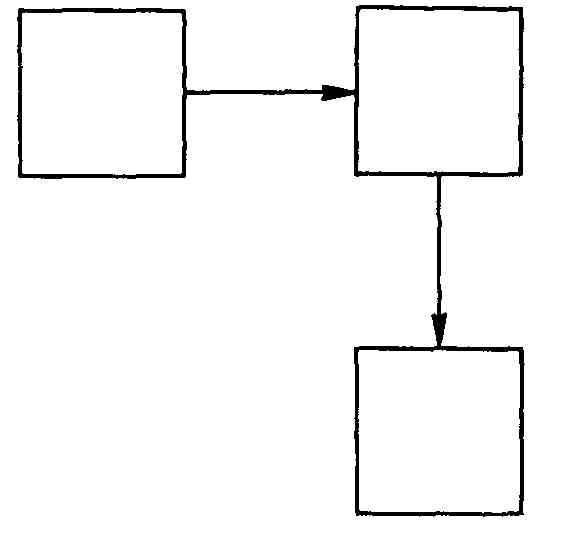
FIG. 27 Vertical and horizontal block alignment.
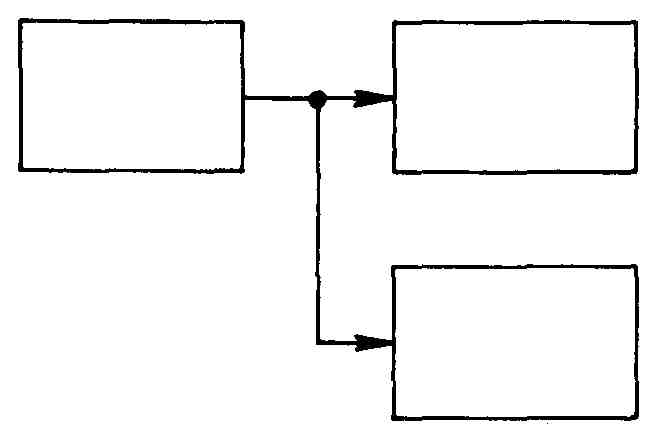
FIG. 28 Offset blocks.
When the total length of the diagram is too long because of numerous sequential units, the scanning sequence method shown in FIG. 29 should be used. The last block in the first row is connected to the first block in the second row. The square blocks of FIG. 29 are positioned in vertical columns and horizontal rows. Obviously, it is easier to use the vertical and horizontal method if all the blocks are the same size.
The first step in laying out a typical block diagram is the positioning of blocks on grid paper. The space between the blocks should be kept as even as possible, as in FIG. 30. The best method is to allow one full- block space between units when the blocks are squares. Half-block spacing can be used for rectangular blocks.
Sufficient space must be provided for flow lines connecting blocks and for flow lines between rows and columns of blocks, as in FIG. 31. FIG. 32 shows a typical instrument block diagram. As can be seen, there are many shapes and sizes of blocks; not all blocks are evenly spaced or aligned according to the preceding guidelines. However, the diagram is pleasing to the eye, easily interpreted, and fairly well balanced.
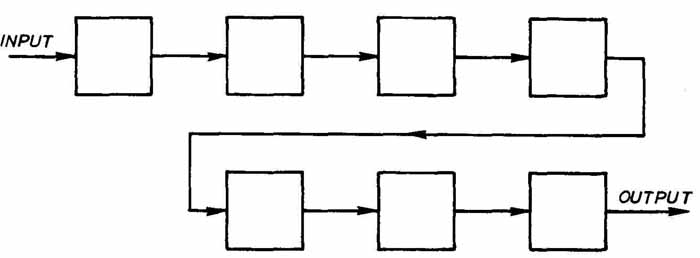
FIG. 29 Scanning sequence used for long and complex diagrams.
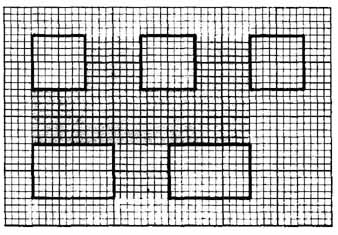
FIG. 30 Block spacing: full- and half-block spaces.
Lettering
Lettering is the last step in the completion of a block diagram. Lettering within blocks and other geometric shapes should conform to specifications presented in Section 2, and in ANSI Y14.2M. The height of the lettering is determined by the eventual reduction size. Most lettering is symmetrical and centered, as in Figs. 32 and 33. Left-justified lettering is shown in FIG. 34, but centered lettering is very easy to execute when using a computer to generate the drawings.
Block diagrams are seldom hand lettered since they are used for printed manuals and sales literature. Most block diagrams are phototypeset. Freehand lettering is necessary for the original sketch and the layout sketch. Regardless of the type or form of lettering, it should be of a consistent size and style. The height of the lettering is normally the same throughout the drawing. When using any particular form of lettering—regular, compressed or expanded— use only one style throughout the drawing. In FIG. 34, two styles of lettering were mixed; this is a poor practice and should be avoided.
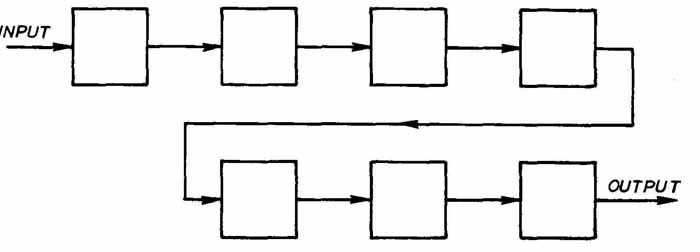
FIG. 31 Line and block spacing, corners, and connection points.
FIG. 32 Block diagram for oscilloscope. (Courtesy Simpson Electric
Co.)
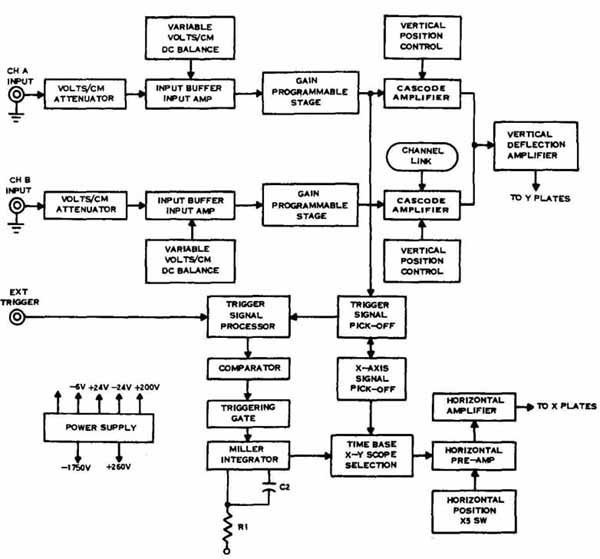
FIG. 33 Block diagram for microcomputer support system. (Courtesy of
Motorola, Inc., Semiconductor Products Sector)
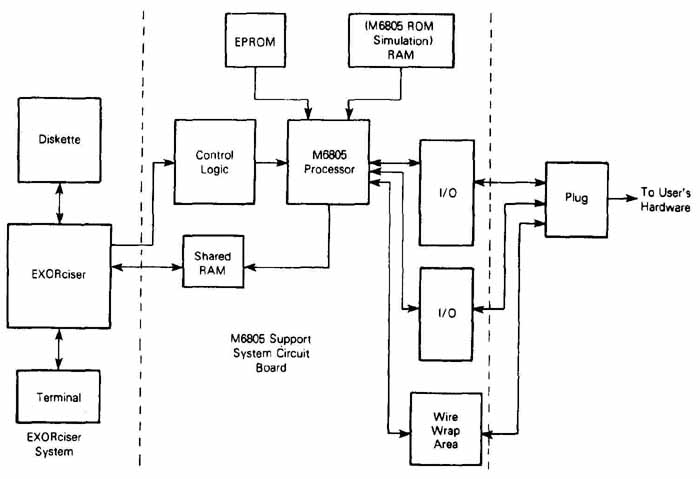
FIG. 34 Block diagram of FM RF, IF, and MPX alignment connection. (Used
with permission from Radio Shack, a division of Tandy Corporation, Forth
Worth, TX 76102)
REVIEW QUESTIONS
1 Describe one method of determining the size of a block to be used throughout a diagram.
2 What are the differences between flow diagrams and block diagrams?
3 Name three uses for block and flow diagrams.
4 How should arrowheads be placed on multiple parallel lines?
5 Blocks should be placed in vertical ( ) and horizontal ( ).
6 What is a block diagram?
7 Name five important aspects and considerations in the layout of a block diagram.
8 What is the suggested spacing between parallel flow lines on a block diagram?
9 Describe the typical specifications for block diagram lettering. What standard governs lettering?
10 Why would a line or block be drawn thicker than other parts of a diagram?
11 What does a dashed line represent? What does a phantom line represent?
12 What is a flow path?
13 Name five typical symbols used on block diagrams.
14 Describe the sequence of steps used to construct a block diagram.
15 Name six common geometric shapes used for diagrams.
16 Give four typical proportions for blocks.
17 Name two ways of showing line junctions or connections.
18 What is a crossover?
19 How are multiple connections shown?
20 What is a title of legend and how is it normally placed?
PROBLEMS
1 Redesign the block diagram shown in FIG. 12. Use only block shapes and standard symbols. Align the blocks in rows and columns.
2 Redraw FIG. 17. Draw the diagram pictorially using oblique pictorial blocks.
3 Redraw the diagram shown in FIG. 3, FIG. 5, or 12—6.
4 Redraw the block diagram in FIG. 17 using a consistent block size and even spacing.
5 Redesign the diagram shown in FIG. 32. Use only one block size and shape.
6 Draw a block diagram of a simple radio: antenna, receiver, amplifier, detector, speaker.
7 Draw a block diagram of a stereo system: inputs from AM tuner, FM tuner, tape deck, and turntable. Each input is channeled into the preamp, which is connected to the power amp and output into a speaker and earphones.
8 Redraw the computer diagram in FIG. 7.
9 Draw FIG. 2 as a simple block diagram.
10 Redraw the following block diagram using one consistent block size and equal spacing. Use symmetrical lettering.
PROBLEM 10 Block diagram. (Courtesy TRW LSI Products)
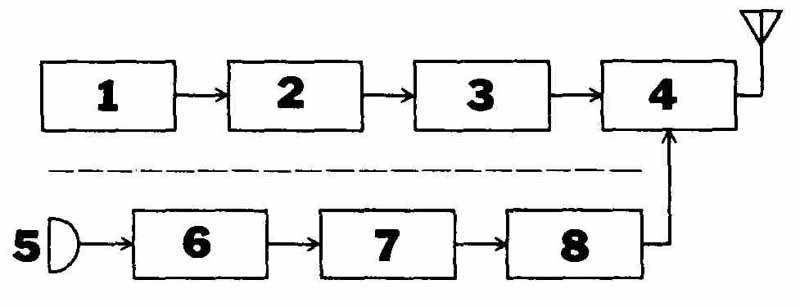
11 Draw from scratch a block diagram of a transmitter RF section starting from number 1 and ending with number 8. Use a consistent block size, and letter the title using vertical, centered lettering. The diagram must read from left to right and is connected in sequence: (1) oscillator, (2) buffer 1, (3) buffer 2, (4) pre-driver, (5) driver, (6) power amplifier, (7) antenna, and (8) power supply.
12 Using the specifications from PROBLEM 11, draw a block diagram of a super-hetero dyne receiver. Using the following sequence, construct the diagram: antenna, RF amp, mixer, IF amp, detector, AF amp, speaker. Place a filter below the detector. A signal goes from the detector to the filter. The filter is fed back into the IF amp, mixer, and RF amp.
13 Draw the interactive graphics system using the following titles for their corresponding blocks: (1) MC6809 MPU and RAM (stack and user), (2) display RAM 6K of MCM2214s, (3) MC6847 VDG, (4) MCM2716 EPROM, (5) MC1372 color TV modulator.
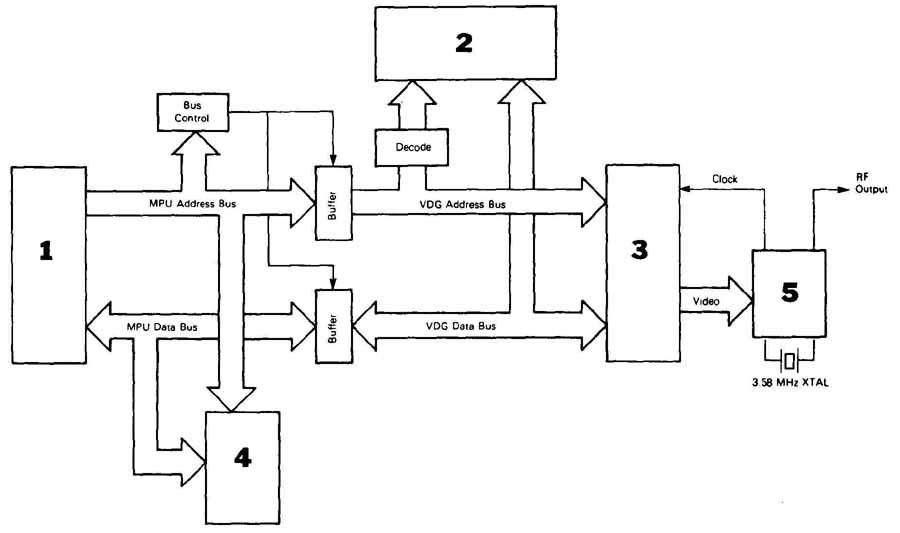
PROBLEM 13 Computer diagram.
14 Draw the AM transmitter using the following titles: (1) oscillator, (2) buffer RF amp, (3) intermediate RF power amp, (4) final RF power amp, (5) microphone (place outside of symbol), (6) audio amp, (7) compressor amp, (8) audio power amp.
PROBLEM 14 Block diagram.
15 Redraw the following block diagram using uppercase, centered, and symmetrically placed lettering. Use one consistent block size with equal spacing.
PROBLEM 15 Block diagram. ( TRW LSI Products)
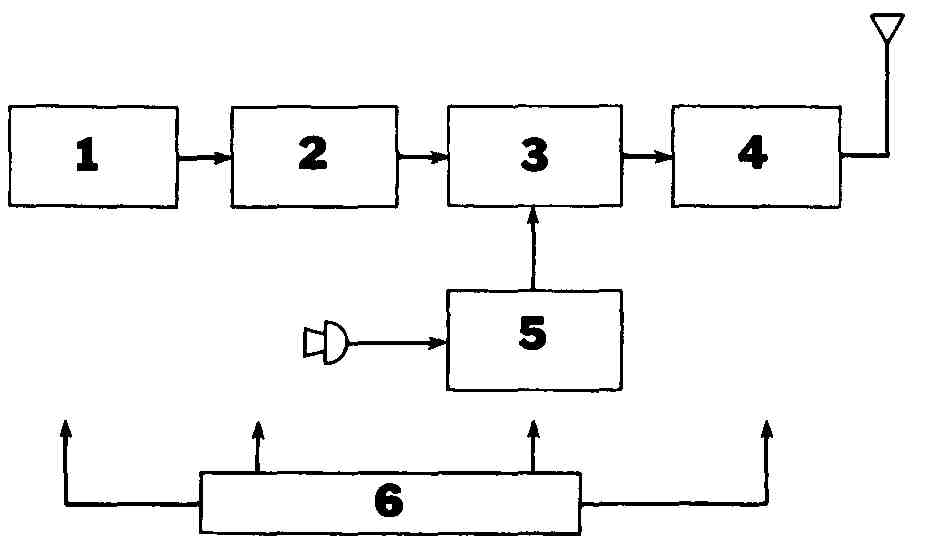
16 Draw the diagram of the radio-telephone telecommunication circuit. This circuit converts the voice frequency (input) into electrical impulses that modulate the output of a radio frequency oscillator (carrier) and transmits the information through the air to a receiving station. The following titles correspond to the blocks: (1) RF crystal oscillator, (2) RF buffer amp, (3) modulator, (4) RF power amp, (5) AF amp, (6) power supply. Add the speaker and earphones. Connect the power supply to all units.
PROBLEM 16 Block diagram.
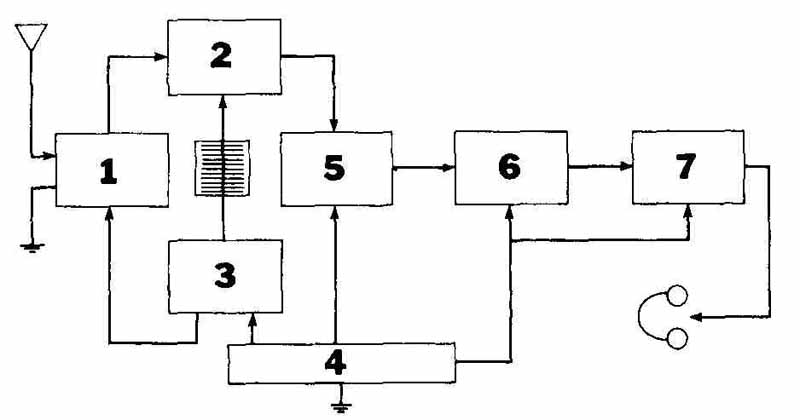
17 Draw the superheterodyne receiver with the following titles: (1) RF amp, (2) mixer stage, (3) local oscillator, (4) power supply, (5) IF amp, (6) detector, (7) AF amp.
PROBLEM 17 Block diagram.
18 Redraw the following pictorial diagram as a simple block diagram.
PROBLEM 18 Pictorial diagram. (Courtesy Intel Corporation)
19 through 27 Draw each diagram using proper line weights and with high-quality lettering.
PROBLEM 19 Flow diagram.
PROBLEM 20 Computer flow diagram
PROBLEM 21 Flow diagram.
PROBLEM 22 Computer flow diagram.
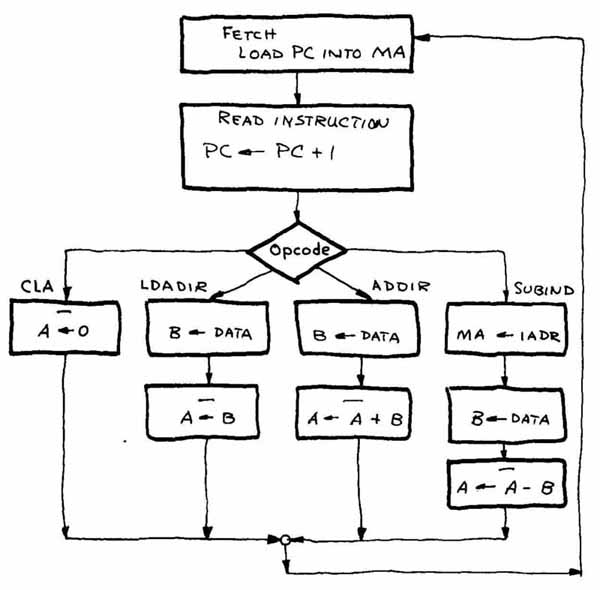
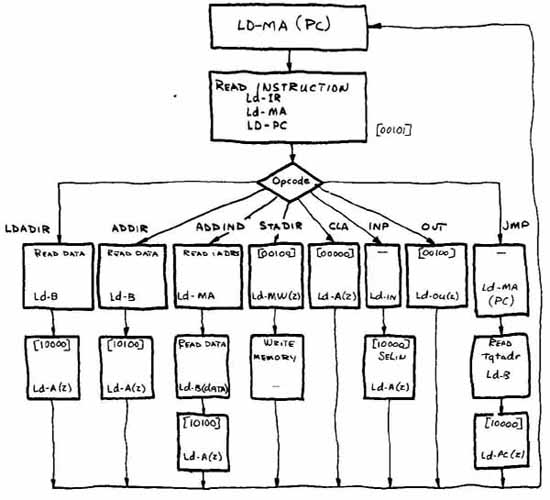
PROBLEM 23 Memory subsystem flow diagram.
PROBLEM 24 Memory subsystem flow diagram.
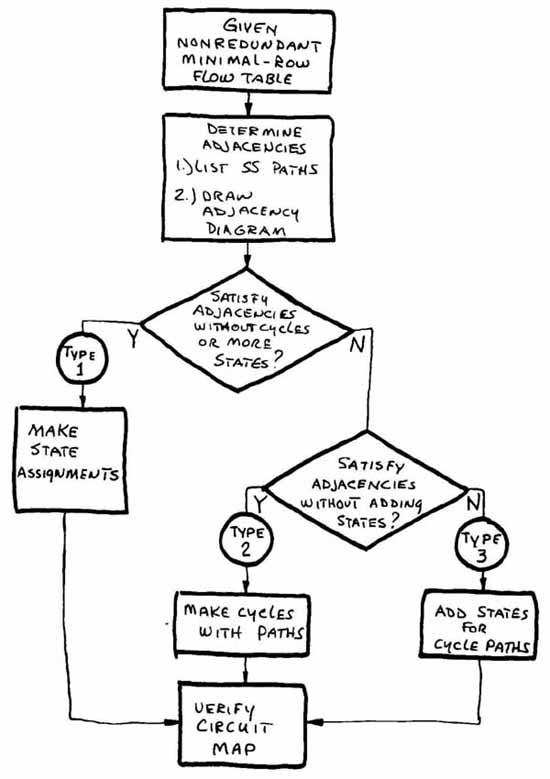
PROBLEM 25 Flow diagram.
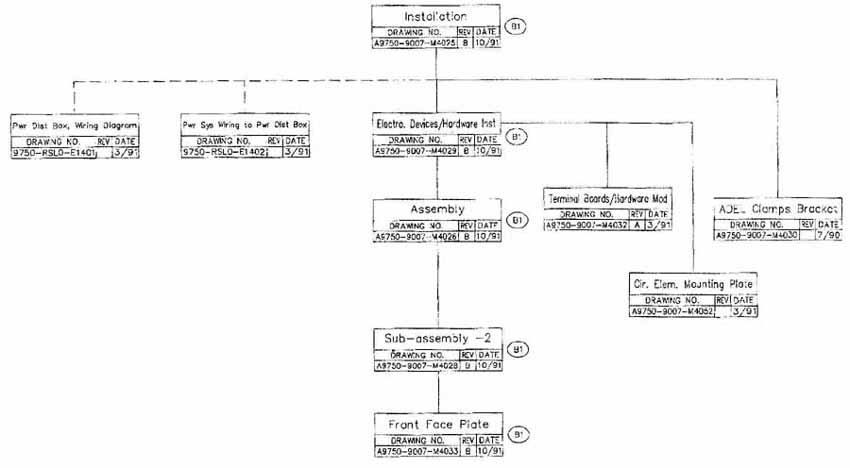
PROBLEM 26 Drawing tree block diagram.
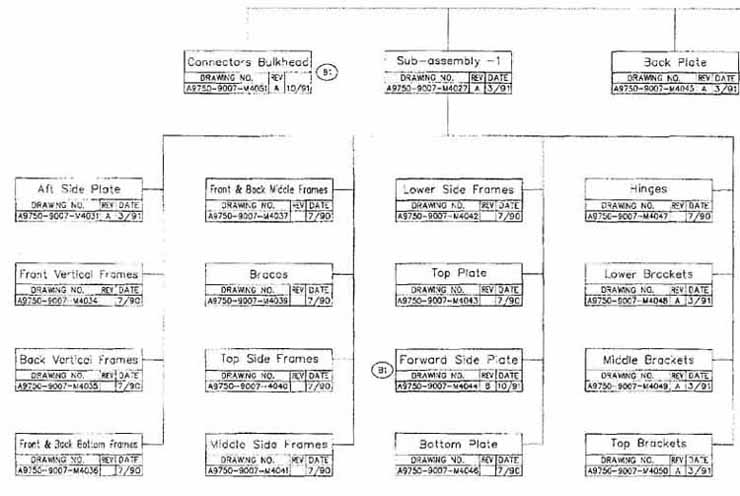
PROBLEM 27 Power distribution box, drawing tree block diagram.