(source: Electronics World, Aug. 1964)
By BOB FERROUS
Variation of the microwave slotted-line measurement technique permits determination of v.s.w.r., R, C, L, and "Q" at TV frequencies using ordinary equipment.
WHEN making R, C, L, and "Q" measurements on some common electrical components, the results sometimes cause raised eyebrows. For example, a resistor having a d.c. resistance of 70 ohms may have a considerably different value at 55 mc. In one case, such a 1/2-watt resistor had a value of almost 270 ohms when measured at 55 mc. This particular resistor happened to be a wirewound device having an inductance of 0.3 uH. and a "Q" in excess of 0.3. The higher value of resistance can be accounted for by recalling that the higher the frequency, the closer the current flow is pushed to the surface of the conductor. This is called "skin effect." A second resistor, a 400-ohm, 10-watt wirewound unit, measured 400 ohms at d.c. but at 55 inc. had a resistance of 5000 ohms and a capacitance of 13 pf. In this case, the capacitance value stems from the fact that the resistor, being inductive, is operated at a frequency higher than its resonant frequency. On checking this, it was found that the resonant frequency was 25 mc.
The measurement technique to be described can be used to measure R, C, L, v.s.w.r., and "Q" and can be used on TV tuners, field-strength meters, FM receivers, antennas and their matching harnesses, attenuators, r.f. amplifiers, signal splitters, coaxial traps and stubs, and mane more r.f. devices operating at high frequencies.
The technique that is used is based on the microwave system of slotted-line r.f. measurements. In this case, however, the slotted line is replaced by a coaxial cable, and instead of moving the r.f. probe along the line to locate the maximum and minimum voltages at a certain frequency, the frequency is varied and the reflected signal beats produce maximum and minimum voltages at the detector.
This measurement technique allows the technician with a sweep frequency generator and oscilloscope to measure resistance, capacitance, inductance, v.s.w.r., and "Q" of any device at TV frequencies, using ordinary 70- to 75-ohm coaxial cable.
The sweep generator, scope, and coaxial cable are connected as shown in Fig. 1A. If the generator does not have an internal detector, then one similar to Fig. 1B and Fi;,. should be constructed. The coaxial cable used in this test set must not have been physically abused in any way and should be free from indentations that might change cable impedance.
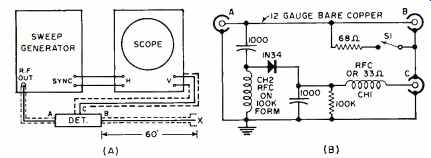
Fig. 1. (A) Test setup for making the various measurements described
in the text. (B) Circuit of detector to be used.
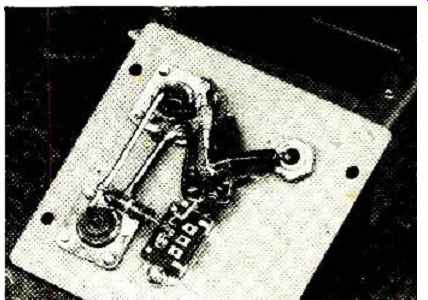
Fig. 2. The construction of the detector is clean and simple.
The 12-gauge copper wire mounted between connectors A and B should be kept at least 1/3" above the metal panel surface.
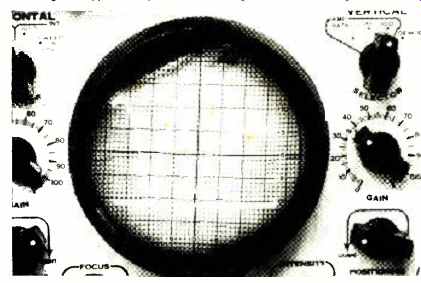
Fig. 3. Typical scope trace showing internal blanking action.
Detector
The detector, shown in Fig. 1B, has an amplitude change of 1 db over the frequency range between 50 and 220 mc. and a v.s.w.r. of 1.25:1 over the same frequency range. 12 gauge copper wire, spaced ,'_ inch from the chassis surface, is used for the jumper between connectors A and B. This wire and its spacing determines the v.s.w.r. of the finished detector. Switch S1 is incorporated so that the detector can be used for alignment purposes and is not required for any of the tests described in this article. Choke CH1 is not critical and can be replaced with a 33-ohm, 1/2-watt resistor if desired.
Choke CH2 is moderately critical and consists of 20 turns of #24 gauge enameled wire wound on a 100,000-ohm, 1/2-watt resistor body, 1/4-inch in diameter. For this winding, the resistor body ends are notched with a file to allow the wire to be wound rigidly on the form. If this technique is not followed, then the wire will slip around the form as the winding progresses.
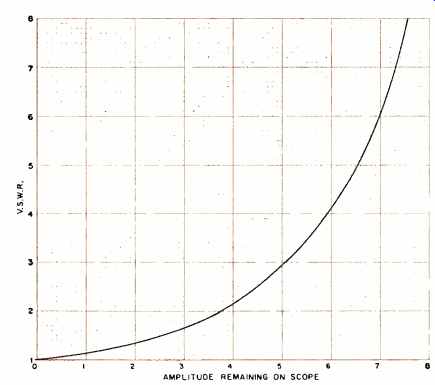
Fig. 4. By measuring the ripple amplitude remaining on the scope, the
v.s.w.r. value as the ratio to 1 can be found.
If a suitable detector circuit is incorporated in the sweep generator that is employed, it may be used in place of the detector just described.
Many technicians cringe at the thought of v.s.w.r. measurements but, in reality, this need be no more complicated than the measurement of resistance. Consider for the moment the case for resistance. It is not necessary to be able to define an ohm, or to be able to design an ohmmeter, to be capable of using an ohmmeter. The same line of reasoning holds for v.s.w.r. It is not necessary to know, or to be able to use any formula, to make such measurements.
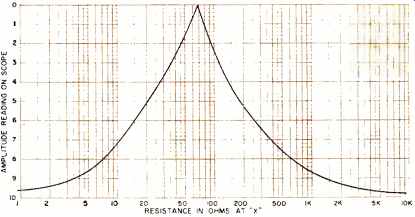
Fig. 5. Ripple amplitude determines the circuit resistance.
Sweep Generator
The generator must be used at a frequency where only the swept oscillator produces an output, or where a filter is used to eliminate (or at least attenuate) the undesired beats produced by the beat-frequency type of generator. This is necessary in order to be certain of the frequencies at which measurements will be made. The generator should be capable of sweeping 6 mc. or more in bandwidth with the center frequency being the frequency of interest.
Oscilloscope
The scope can be almost any type since the highest frequency it must handle will be in the order of 600 cycles. It should be provided with a graph-like calibration scale and have a sensitivity of 20 or 30 mv. per inch or better in order to obtain a large enough amplitude pattern.
Coaxial Cable
The coaxial cable is ordinary RG-59 /U or other coaxial cable of 70- to 75-ohm impedance. It should be fitted with coaxial connectors at each end and long enough to present several cycles on the scope trace. Then using a sweep width of 12 mc. at television frequencies, this length will be approximately 60 feet. The length is not critical, and in fact, 60 feet can generally be used for any TV channel from 2 to 13. For other frequencies, the general rule is to double the length of cable when using half the sweep width indicated above.
Small-diameter cables usually have the better impedance tolerance and are preferred for this reason.
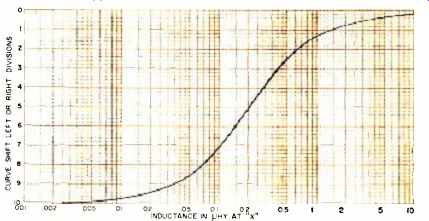
Fig. 6. Ripple curve shift is used to determine inductance.
Scope Pattern
The pattern shown on the face of the scope will depend somewhat on the characteristics of the sweep generator. If the generator blanks the return trace, then the pattern will appear as shown in Fig. 3. If the return trace is not blanked, the wavy part of the pattern will appear twice and will tend to be confusing during some of the measurements. If the return trace is not blanked in the sweep generator, it may be blanked by applying the generator synchronizing signal to the scope Z-axis as well as to the horizontal terminals, or by phasing the power line and applying this to the Z-axis.
V.S.W.R. Measurement
Measurement of v.s.w.r. depends only on the amplitude of the ripple shown in Fig. 3. This ripple is produced at the detector by virtue of the reflection from the open or shorted end of the coaxial cable.
The basis for this measurement is the fact that a signal sent down a length of coaxial cable is either dissipated in the termination or reflected back to the source. The reflected wave passing the detector produces the interference pattern which is displayed on the scope as shown in Fig. 3. By leaving the end of the cable open and adjusting the generator output and scope vertical gain, the amplitude of the pattern can be adjusted to allow the pattern peak-to-peak amplitude to be set at 10 calibration scale divisions. A perfect match when applied to point X of Fig. 1A will produce a perfectly straight line. Any departure from perfect match will allow some ripple to remain on the screen. The amplitude of this remaining ripple can be converted into v.s.w.r. by Fig. 4. To use Fig. 4, first set the scope pattern to 10 calibration scale divisions each time a measurement is to be made. Connect the desired load to point X ( Fig. 1A) and measure the amplitude of the ripple now showing on the scope. Locate this value on Fig. 4 curve. The v.s.w.r. value is the ratio to 1. Thus 1.5 represents a v.s.w.r. of 1.5:1.
V.S.W.R. of 300-ohm Devices
The v.s.w.r. of 75-ohm devices is found as just described.
To find v.s.w.r. of 300-ohm balanced devices such as TV tuners, an impedance-converting device must be used. This may take the form of a coaxial balun for the frequency required, or possibly a 75to 300-ohm transformer. The balun method is the surest way of the two, but requires one for each channel at which measurements are to be made. Other impedances may be used, but they also require impedance-matching sections. The matching sections are connected at point X of Fig 1A, and the load to be measured is connected to the other end of the impedance-transforming section.
Resistance Measurement
Measurement of resistance is accomplished in the same manner as v.s.w.r. except that the curve of Fig. 5 is used.
Note that for each value of scope ripple, there are two values of resistance that satisfy the problem. This ambiguity can be removed by paralleling the load at point X with a second value of resistance that is known to be well up on the high side of the curve. For example, assume an unknown load producing 3 divisions of ripple amplitude. This means a resistance of either 38 ohms or 110 ohms. By paralleling the load with a 200-ohm resistor, the resulting combination would reduce the ripple amplitude if the value of load were 110 ohms, but would produce a slightly larger amplitude for the load value of :38 ohms. This is because the parallel resistance is 32 ohms in one case and 71 ohms in the second case.
Referring these values to the curve of Fig. 5 will show that the amplitude of the ripple does change as described.
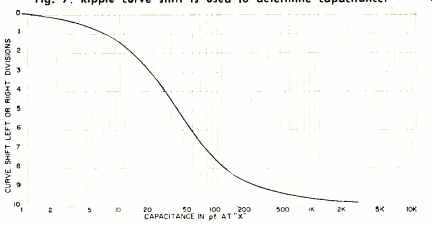
Fig. 7. Ripple curve shift is used to determine capacitance.
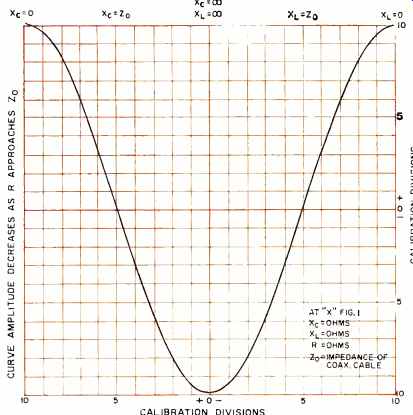
Fig. 8. Scope trace ripple will move horizontally either way depending
on the type of reactance in circuit being tested.
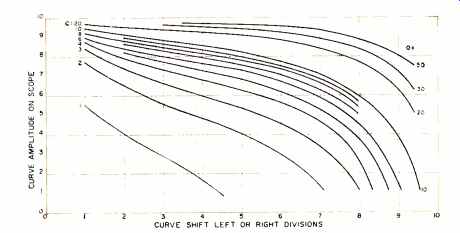
Fig. 9. Ripple curve shifts right or left, and change in amplitude is
used to determine "Q" of circuit tested.
Inductance Measurements
This measurement depends on the changing of the interfering pattern at the detector with the phase of the wave being reflected from the open end of the coaxial at point X of Fig. 1A. Note the pattern on the scope with the end of the coaxial cable open-circuited, then with the end of the coaxial cable shorted. Note that where there was a crest on the open-circuited condition, there is a valley in the shorted condition.
In other words, the pattern on the scope has changed through 180 degrees. In the open-circuited condition, there is no load on the end of the cable. If an inductance is assumed to be connected, it must have infinite reactance. In the shorted condition, the load consists only of the inductance of the short length of wire used to short the cable. This inductance must be very small and must have zero, or nearly zero, reactance. By taking a value of inductance that has a reactance equal to the cable impedance, the scope curve shifts halfway between the two extremes of shorted and open lines. To make use of this in measurements, the open-circuited condition is used to put the peak of one of the ripples of the curve on the vertical center line of the scope calibration scale. The line is then shorted and the adjacent peak is brought to the plus 10 mark on the scope calibration scale. This is done by juggling both the horizontal gain control and the horizontal positioning control. The direction the scope curve moves can be easily found by connecting a two- or three-turn loop to the end of the cable and inserting a brass plug into the coil, thus reducing the inductance and hence the reactance across the cable.
By noting the direction the curve moves, and counting the curve displacement in this direction, we can chart a curve for inductance, as shown in Fig. 6.
Capacitance Measurement
This is similar to the method used to measure inductance.
The theory behind this is developed the same way, except that a capacitor is attached to the cable in the open and shorted condition. Another viewpoint consists of considering the results of adding capacitance and inductance to the ends of the coaxial cable. The capacitance has the effect of lengthening the measurement cable, while inductance has the effect of shortening the cable. To make capacitance measurements, put one of the ripple peaks on the scope calibration scale center line and the adjacent peak on the minus 10 scope calibration scale mark. Juggle the horizontal gain and horizontal positioning controls to obtain this condition. By connecting a small-value capacitor to the end of the cable, thus increasing capacitance and lowering reactance, the pattern will move in the opposite direction from the curve of smaller inductance. Thus, by counting the divisions the curve is displaced, and referring to Fig. 7, capacitance may be measured.
The curve of Fig. 8 may help clarify the explanation. Using the center peak at 0 and the peaks as shown to plus 10 or minus 10 (depending on What you are going to measure), when the load is connected to point X of Fig. 1A, count the number of divisions that the scope trace, or center peak has moved. The directions shown in Fig 8 are those for the author's scope and generator. For other scopes and generators, the reverse directions may be the ones to use. This can be determined by noting the direction for the coil and brass plug is described under inductance measurements.
“Q” Measurement
Since resistance, capacitance, and inductance can be measured, "Q” can also be measured. There are, however, several problems encountered when this is attempted. 13v connecting a small capacitor at point X of the test setup, the curve on the scope screen shifts left or right. Paralleling this capacitor with several resistors will cause the curve amplitude to change. However, as 70 ohms is approached-the ripple reduces and disappears. The second problem occurs when we continue to lower the resistance value placed across the capacitor. In this case--the amplitude of the ripple increases in value. Thus, for each ripple shift and amplitude measured, there are two possible values of "Q." The first problem cannot be skirted and must therefore be lived with. The second problem disappears when the O values represented by these measurements are found. The highest “Q" that any measurement here could represent is a “Q" of 2, and the lowest is about 0.03. This refers of course to those "Q” values represented by the parallel resistors below 70 ohms These values are so low that von may encounter some confusion if yon are measuring coils made with resistance wire or coils wound on low-value resistors. but such low values should not present any difficulty in normal measurements. Similarly, low values of "Q”, for a capacitor would occur only if high-value resistors are in series with, or low values in parallel with, the capacitor. The ordinary coil or capacitor that may be encountered does not fall into this range. For this reason, the "Q" chart shown in Fig. 9 appears adequate considering the measurement range available. One check that can he made is to parallel any unknown "Q" at point X with a short-lead composition resistor of about 200 ohms. If the ripple size decreases, von can be stare that Fig. 9 applies to the unknown; if the ripple size increases in amplitude--the unknown has a "Q" of some value less than 2.
For v.s.w.r., resistance, and "Q," the charts are correct for any applied frequency, while for capacitance and inductance, the charts are for 55 mc. or TV channel 2 only. Other capacitance and inductance ranges could be used by converting these to their reactance at 55 me. and charting the amplitude obtained. This new chart would then show reactance vs. amplitude and could be used at any frequency. The drawback to this method is that a reactance frequency chart would then be required to convert these values back to capacitance or inductance values.
Variations of this method of using conventional TV test equipment to determine the characteristics of circuits and components at v.h.f. (TV) frequencies are used by many companies producing TV equipment as well as by many service companies that are responsible for the proper operation of community antenna systems.