(source: Electronics World, Aug. 1964)
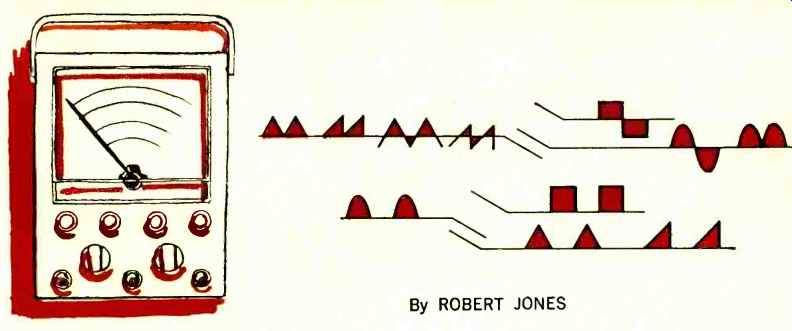
By ROBERT JONES
CONVERSION of meter readings for different wave-forms aids in checking equipment against a diagram's reference voltages when limited test equipment is available. There are many meter types ranging from the hot-wire ammeter to the vacuum-tube voltmeter. Each of these instruments may have a slightly different reading when used on waveforms which are not pure sine waves. The problem becomes more bewildering when some meters respond to one value of a waveform (for example, the average) and the scale supplied with the instrument reads another value ( for example, the r.m.s.) . In this case the calibration is always performed on a sine wave, but the scale reading will be correct only for this particular waveform.
The picture becomes more complicated when a square wave is applied to this same instrument, as it will now be found to be reading high by 1.15 times the true r.m.s. value of the wave. To further complicate matters, the reading error changes with each change of waveform from sine waves to isoceles waves, sawtooth waves, square waves, and pulses.
Average-Responding Meters
Meters responding to the true average value of a waveform are quite common. A typical example is the pocket type of meter or the a.c. reading v.o.m.'s. In fact, any meter using copper oxide, magnesium copper sulphide, selenium, silicon, or a crystal diode as a rectifier, either as a half-wave or full-wave rectifier and without a capacitor across the output of the rectifier, responds to true average values for any waveform. The scale provided with common commercial instruments reads in r.m.s. values. This means the true average value can be found by multiplying the meter scale by 0.903 in order to obtain the correct average value for any other waveform that we might be interested in.
R.M.S.-Responding Meters
These meters include the moving iron-vane meters, thermocouple meters, hot-wire meters, electrodynamometer meters, and electrostatic meters. For this group of meters the meter scale, if r.m.s., matches the meter movement and the instrument will read true r.m.s. values for any waveform.
Peak-Responding Meters
Peak-responding instruments include the slide-back vacuum-tube voltmeter, cathode-ray oscilloscopes, rectifier-type instruments with a capacitor across the output of the rectifier, and some types of v.t.v.m.'s. The response of these meters is true peak for any waveform and most will have scales calibrated in peak values. These meters give correct readings for any waveform except for pulses of short duration compared to the repetition frequency.
If the meter scale is calibrated to read r.m.s., then the true value can be found by multiplying the scale value by 1.414. If, however, the scale is calibrated to read average values, then the scale reading must be multiplied by 1.571 to give true peak value of the waveform being measured.
Vacuum-Tube Voltmeters
The determining factor in this type of meter is the bias supplied to the tube or transistor which does the detecting or rectifying. The bias sets the operating point and by this means the conventional v.t.v.m. becomes peak, average, or r.m.s. responding. Hence, the common v.t.v.m. without a special input circuit cannot usually be relied upon to read true values when anything but a true sine wave is applied.
Consider the waveform as applied to the meter from the detector. The amplitude is dependent on the amplification provided by the tube and on the bias supplied to the control grid, while the waveshape or distortion at the cut-off end of the tube characteristic curve is dependent only on the bias setting. Since tubes of the same type vary from tube to tube and with usage, any given bias setting cannot be relied upon to make the conventional meter read the true value of peak, average, or r.m.s. This does not reduce the usefulness of the v.t.v.m.--being calibrated on sine waves and reading sine-wave values-but it does make it difficult to correct for other waveforms that we must measure.
True Values & Corrections
Once the true values of a voltage or current are known, be it average, root-mean-square, or peak, the remaining two values can be computed provided the waveshape is known. For example, if we have a sine wave and know the r.m.s. value, then we can find both the average and peak values by simply applying appropriate correction factors.
This same approach can be applied to many waveforms, but of course the correction factor changes with each different waveshape.
The ratio r.m.s. to average values is generally called the form factor of a wave. This ratio is different for each wave-shape, being 1.11 for sine waves and 1.00 for square waves.
Another ratio, peak to average, is known as field form factor and is 1.57 for a sine wave and 1.00 for a square wave.
The peak to r.m.s. ratio, known as the peak or crest factor, is 1.414 for a sine wave and 1.00 for a square wave.
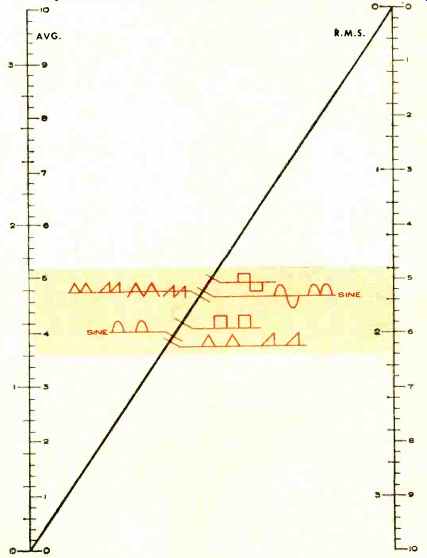
Fig. 1. Relation between average and r.m.s. voltage values.
Fig. 1 shows the relationships between average and r.m.s. values for various waveshapes. Fig. 2 relates r.m.s. and peak values for various waveforms. Fig. 3 relates average and peak values. In all cases the peak, r.m.s., and average values are measured true values.
These charts are used by placing a ruler or straightedge from the known value in one column through the known waveform to the required answer in the second column. In using the charts, be sure that you read values on the same sides of the various voltage scales. Also, all scales can be extended by dividing or multiplying by 10, 100, 1000, etc.
The technician without a particular type of test instrument called for in a service diagram, can forecast the value that would be measured by the proper meter. This, of course, requires that the diagram show the waveform or that the technician be able to forecast the probable wave--shape at the point of measurement. If a scope is the measuring instrument, then both waveform and true peak values are available and the charts can provide conversion.
Charts permit the conversion of peak r.m.s., and average meter readings so that existing meters can be used to check a variety of applied waveforms.
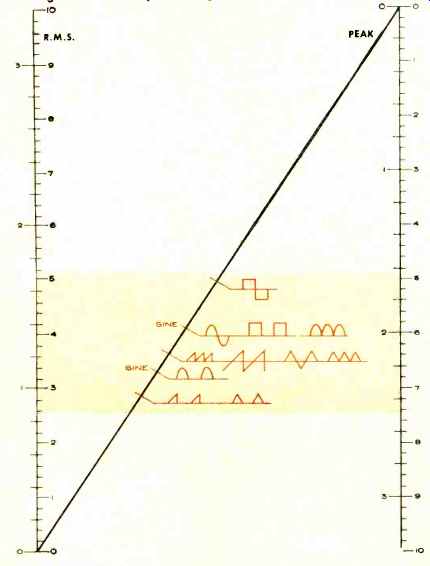
Fig. 2. R.m.s. and peak voltage values for various waveforms.
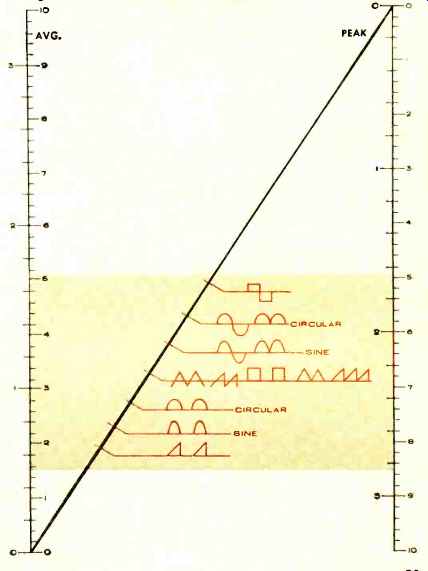
Fig. 3. The relation between average and peak voltage values.