By JULIAN D. HIRSCH / Hirsch-Houck Laboratories
This potentially lucrative servicing market requires special knowledge and attention to quality of equipment performance. Here are the actual test procedures required, along with hints on avoiding some common testing errors.
Simplified techniques, with minimum of test equipment, are included.
ANY service shop specializing in hi-fi components or doing a substantial business in that field should be equipped to test and verify performance of the components which they have repaired or aligned. It is reassuring, both to the customer and the service technician, to know that a repaired unit meets the manufacturer's original performance specifications. Last month we discussed the test instruments required, pointing out how they differ from conventional radio and TV service instruments. We listed some specific makes and models of test equipment that we have found suitable.
This month the specific procedures and test setups will be described. Wherever possible, they conform to Institute of High Fidelity (IHF) or other recognized standards but, in some cases, the techniques are those we have found to be useful and practical in our testing of hi-fi components.
FM Tuners
The basic test setup for FM tuner sensitivity and distortion measurements is shown in Fig. 1. These measurements are made with a standard modulating frequency of 400 Hz, which is built into most FM signal generators. If the generator lacks this feature, or if other modulation signals are required (as in stereo channel separation tests), external modulation is applied as shown by the dashed line in Fig. 1.
A dummy-antenna network is required to terminate the 50-ohm signal-generator output and provide a 300-ohm source impedance for the tuner antenna input. Different dummy-antenna configurations are used for unbalanced and balanced inputs, as shown. Most tuners use a balanced input, but there are enough with unbalanced inputs to warrant making up both types of network. They can be packaged in small cans or plastic boxes. Shielding is not important but the lead lengths between the generator's 50-ohm termination and the tuner antenna terminals should be kept to a minimum.
Both dummy-antenna configurations have a 6-dB insertion loss, so that the generator output must be set to twice the desired value. In other words, if the tuner measurement is to be made with 1000-µV input, the generator output is set to 2000 V. For sensitivity, mono distortion, and signal-to-noise ratio measurements, either channel output of the tuner can be used. If possible, disable the tuner's multiplex circuits by switching to mono. The tuner audio output (or the Tape Output of an integrated receiver) goes to an a.c. v.t.v.m. (or transistor voltmeter) and a distortion analyzer. A scope should also be used, initially to view tuner output and later residual distortion and noise from the distortion analyzer.
The IHF usable-sensitivity test is made with a carrier deviated ±75 kHz at a 400-Hz rate. It is usually sufficient to measure sensitivity at mid-band, between 98 and 100 MHz, although it may vary slightly across the FM band. A rough check at 90 MHz and 106 MHz can also be made as a test of front-end tracking. Since you will not be operating in a screened room, tune the receiver to a frequency where no broadcast signal is received. The scope should show only "grass" or random noise with no visible modulating signals.
Set the signal-generator output moderately high (50 to 100 µV) and tune it for maximum output from the tuner.
Reduce the generator level until some noise or distortion appears on the output waveform. With the distortion analyzer, null out the 400-Hz fundamental, reading the residual as a percentage of the fully modulated output. If it is less than 3.2 %, reduce the generator output and repeat the measurement; if it is more than 3.2 %, increase the generator output and repeat the measurement. With each change of output, a slight readjustment of the generator frequency may be necessary to minimize distortion. If the retuning is sufficient to materially affect the receiver's tuning-meter reading, this indicates incorrect i.f. or discriminator alignment.
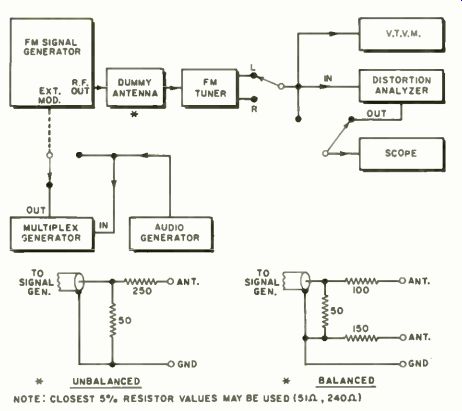
Fig. 1. Set-up for FM tuner sensitivity, distortion checks.
The signal input, in microvolts, which results in 3.2% distortion (-30 dB) is the IHF usable sensitivity. Remember, this input is half the output setting of the signal generator.
Set the generator output to 2000 IN (1000 µV at the tuner input) and measure the distortion in the tuner output. Re-tune the generator frequency slightly for minimum distortion. The scope, connected to the distortion-analyzer output, will identify the distortion as second or third harmonic, or as power-supply hum. Even laboratory-grade signal generators cannot be relied upon for accurate distortion measurements below 0.5 %. An FM tuner with a measured distortion of 1% or less can be considered satisfactory. If it is much more than 1 %, the i.f. and /or detector circuits are probably misaligned or there may be other faults in the tuner.
The image response of an FM tuner will normally occur at a frequency higher than the signal by twice the i.f. frequency. With the tuner set at 98 MHz, the image response is at 119.4 MHz. The initial output reading, at 98 MHz, should be with the signal generator output set at the IHF usable-sensitivity level, using 75-kHz deviation at 400 Hz.
Then, tune the generator to 119.4 MHz, using its maximum output, and locate the point of maximum output from the tuner. Reduce the signal-generator level until the audio-output voltage from the tuner equals that measured in the usable-sensitivity test. Record the generator output at this point.
Image response is the ratio of generator outputs at image and signal frequencies, for equal tuner output, and is expressed in decibels:
Image Ratio = 20 log E;,,,,,Ne /
Specified image ratios are usually between 60 and 90 dB. If the measured value is appreciably less than rated, it indicates a possible front-end misalignment.
The i.f. rejection is measured in the same manner, except that the test is made at the i.f. frequency of 10.7 MHz instead of the image frequency. Many FM signal generators do not cover this frequency but this test can usually be omitted, since only a gross misalignment would materially affect i.f. rejection and this would almost certainly be revealed by sensitivity and image-rejection tests.
For stereo channel separation measurements, the signal generator should be modulated by an external multiplex generator, unless a stereo test generator with an internal r.f. source is used. With the left channel modulated at 400 Hz (do not use more deviation than necessary-30 kHz should be adequate) and an r.f. level of 1000 µV to the tuner, measure its left-channel audio output. Then connect the v.t.v.m. to the right channel and read the crosstalk. Re-adjust the signal frequency slightly for minimum crosstalk.
The amount of re-tuning should not be sufficient to affect tuning-meter indication. Use the dB scales of the v.t.v.m. and its attenuator or range switch to determine the stereo separation-the difference between the two readings-in' decibels. Repeat this measurement with the right channel modulated, measuring crosstalk in the left channel. It is convenient to wire up a switch for connecting the meter to the desired channel without changing cables. Do not re-tune the signal generator if it has been optimized for the other channel. Commonly, the two crosstalk figures differ somewhat, but they can be averaged to obtain mid-band channel separation.
Channel separation or crosstalk should also be measured at a high audio frequency. Some loss of separation is normal at the high and low frequencies, but an excessive loss at the high end may indicate a serious misadjustment of the multiplex circuits. If possible, use a 10-kHz modulating frequency for this test. If a service-type stereo generator is used, maximum usable frequency may be only 5 kHz.
Although some FM tuners have rated mid-band stereo-separation figures of 40 dB or more, many signal generators are not that good. In general, if the measured separation is greater than 20 dB at 400 Hz and 10 to 15 dB at 10 kHz, the tuner may be considered satisfactory in this respect.
Once the separation exceeds about 10 to 15 dB, the ear perceives little change in the stereo "spread," other than a slight shift in apparent speaker spacing.
Dial calibration should be checked to verify the receiver's local-oscillator tracking. Signal-generator frequency calibration, usually good to 1%, is not adequate for this purpose. Use FM-broadcast signals of known frequency. If there are insufficient signals available, or they are not at suitable frequencies, a crystal-controlled marker generator may be used (this facility is built into some low-cost stereo multiplex signal generators). If you wish to verify the frequency response (mainly the accuracy of the tuner's de-emphasis curve), it is only necessary to check a few frequencies. Modulate the signal generator at 400 Hz, with about 22-kHz deviation, and measure the output of either channel. Repeat the measurement with 50 Hz and 10 kHz modulation, maintaining the same deviation. With an ideal deemphasis characteristic, the 50-Hz and 400-Hz levels should be identical, while the 10-kHz output should be down 13.8 dB. A tolerance of ±2 dB about the ideal response curve is satisfactory.
Amplifiers
The test setup for amplifier measurements is shown in Fig. 2. The frequency-response measurements, made on the preamplifier section of an amplifier or receiver, are performed at a low level. In most cases, a reference output of about 1 volt across 8-ohm speaker loads, or about 0.1 volt across a high-impedance load connected to the preamplifier or tape-output jacks, is satisfactory. The reference frequency for all amplifier measurements is 1000 Hz.
IHF standards call for all amplifier gain controls to be at their maximum settings. We have found that some amplifiers become unstable when the tone and volume controls are all at their maximum settings (which is an abnormal operating condition in practice). Before measuring tone-control characteristics check the amplifier under these conditions, using the scope to show any ultrasonic or sub-sonic instability. If it occurs, reduce the volume-control setting until the amplifier becomes stable. Be sure that any loudness-compensation circuit is disabled. On some receivers, the loudness compensation (bass boost) is always operative; in this case, the volume control must be at maximum for frequency-response measurements.
Phono-preamplifier equalization should be measured, if possible, at the tape outputs of the amplifier. Set the audio-generator level to deliver a 0-dB reference output at 1000 Hz. Most audio v.t.v.m.'s are calibrated for 0 dB at 0.78 volt (actually 0 dBm), which is suitable for this purpose. Maintaining a constant input level, measure the outputs at 3 kHz, 5 kHz, 10 kHz, and 15 kHz. They should be down from the 1000-Hz level by 4.8 dB, 8.2 dB, 13.8 dB, and 17.1 dB, respectively, if the amplifier is correctly equalized for the RIAA characteristic. Return to 1000 Hz and reduce the input level by 20 dB. Measure the output at 300 Hz, 100 Hz, and 50 Hz. It should be higher than the 1000-Hz level by 5.5 dB, 13.1 dB, and 16.9 dB, respectively. Deviations of ±2 dB from the ideal response are acceptable. Normally only one channel need be checked fully, but spot checks can be made on the other to check their similarity.
Since the tone controls and filters usually follow the tape-monitoring outputs, their characteristics must be checked across the speaker leads. It is not necessary to plot the full response curve of the amplifier, unless it has some unusual characteristics. Tone-control measurements at 100 Hz, 1000 Hz, and 10 kHz are usually adequate.
With the tone controls set to their mid-positions, supply a 1000-Hz signal to the Aux or other high-level input and adjust for an output of 0 dB (0.78 volt) across the 8-ohm load resistors. Set both controls (bass and treble) to their maximum and minimum positions and note the variation in output. It should be no more than ±3 dB with well-designed tone controls. Return controls to center positions.
Change input to 100 Hz and to 10 kHz at same level. Note output, with the controls centered and at their extremes.
The amount of variation should be compared to the manufacturer's specifications. Values from ±10 dB to ±20 dB are typical (they need not be symmetrical about the center response level). At maximum boost, be sure that the output waveform, as seen on the scope, is not clipped. Some low-powered amplifiers may distort at the suggested levels with full boost. If this occurs, reduce the input level as required.
Rumble and scratch filters can be checked the same way.
From a 0-dB reference level at 1000 Hz, the drop in output at a low or a high frequency is measured when the filters are switched in. The choice of frequencies depends on the manufacturer's specifications, since there is no standardization of filter cut-off frequencies or slopes.
The IHF standard (IHF-A-201) procedure for hum and noise measurement is unnecessarily complex for our purposes. At H-H Labs, we have established standardized gain and power-level references for all amplifiers. The gain is set so that an output of 10 watts (8.94 volts across 8 ohms) is obtained when 1 volt at 1000 Hz is applied to a high-level input. In the case of a preamplifier, the reference output is 1 volt (unity voltage gain). For the phono input, the reference input is 10 millivolts.
With gains standardized, the signal is removed and the input is terminated with a resistor of about 2000 ohms. The output voltage is measured across the speaker load (or across an unloaded preamplifier output). The input termination is not critical; however, the open-and short-circuited conditions of the IHF procedure are unrealistic in terms of normal operating conditions. We feel that a finite resistance typical of a phono cartridge or emitter-follower output is more meaningful.
The hum and noise output is expressed in decibels below 10 watts (or below 1 volt, for a preamplifier). For example, 3 millivolts of hum and noise corresponds to about -70 dB, a completely inaudible level. Hum and noise levels of -60 dB or lower are usually satisfactory; on phono inputs -45 to -50 dB may be acceptable if the noise is largely sub-sonic "bounce" (which may be readily identified with the scope). When testing a basic power amplifier, without controls, there is no standardized gain setting. Otherwise the procedure is the same, with the output noise referred to 10 watts.
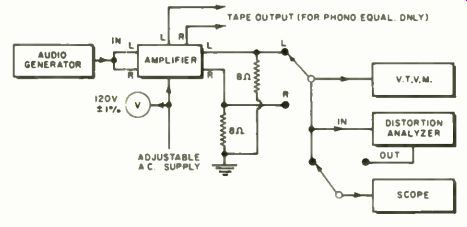
Fig. 2. Test set-up for making amplifier measurements.
The use of a fixed reference power, independent of the amplifier rating, makes it possible to compare amplifiers of different power ratings, with respect to the audible hum they might contribute to a system. To correlate these noise figures with the manufacturer's rating, which is usually referred to his maximum power output, add
10 log P r.,,tod/
decibels to the figure that has been previously measured.
Crosstalk between inputs of the amplifier is most easily detected and evaluated subjectively, by listening. It is most likely to be disturbing when the tuner output feeds through to the phono inputs while records are being played. With volume set somewhat higher than normal, and the pickup arm on its rest, switch to phono and listen for the tuner program in the background. In a receiver, the tuner is normally switched off in other modes and nothing will be heard, but with separate tuner and amplifier combinations crosstalk is not uncommon. If it exists, there is usually little that can be done by the service technician to correct a design fault. The same problem often occurs when the tape-monitor switch is set to listen to a prerecorded tape while the tuner is operating. In either case, the cure is simple-turn off the tuner if it is a separate component, or switch the receiver to another input which is not energized.
Amplifier power and distortion measurements should be made with both channels driven, although it may be desirable to drive only one channel to verify a manufacturer's specification, which is often based on only one channel operating. Dynamic, or music-power, ratings cannot be checked without a rather complex test setup, and in our view are less indicative of an amplifier's performance than a continuous-power measurement.
Drive both channels through a high-level input at 1000 Hz. We prefer to use an external "Y" connector for this, leaving the amplifier in its stereo mode. Alternatively, one input may be driven, with the amplifier set to mono to internally parallel the two inputs. Sometimes this can affect the distortion characteristics of the amplifier, but in most cases there is little difference between the two connections.
Adjust the balance control for equal output from both channels, with the volume control at maximum and tone controls centered. No amplifier control is to be disturbed during the tests.
While observing the output waveform of one channel on the scope, increase the drive level until the waveform clips.
Sometimes the clipped portion contains hum components, and sometimes the clipping is clean. Both positive and negative peaks of the sine wave may or may not clip simultaneously. If the waveform distorts gradually rather than clips suddenly, or exhibits kinks at points other than at its peaks, the amplifier negative feedback is not very effective. This is typical of some low-priced "packaged" units, but is rare in hi-fi components of good quality.
Watch for bursts of oscillation, anywhere on the output waveform, as the level is increased to the clipping point and beyond. Repeat this with a capacitor of about 0.01 uF across the 8-ohm load. An amplifier should be stable with reasonable capacitive loads. Remove capacitor for other tests.
To check the maximum power output, monitor the line voltage and maintain it at 120 volts. Read the amplifier output voltage as the waveform just begins to clip. The power is E218 watts per channel. This measurement should be repeated ;tt the extremes of 20 Hz and 20 kHz where most amplifiers deliver less power than at 1000 Hz.
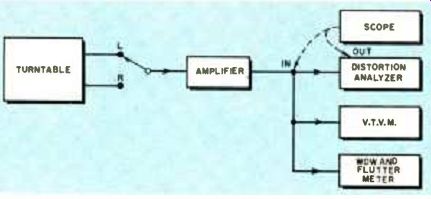
Fig. 3. Turntable and phono pickup measurement set-up.
Distortion should be measured at low power, medium power, and maximum rated power. All distortion analyzers operate satisfactorily at a 1-watt level (2.83 volts across 8 ohms), and this is suitable for low-power measurements.
Distortion should also be measured at 10 watts (8.94 volts) and at the maximum rated power of the amplifier. When measuring distortion, connect the scope to the analyzer output to display the residual signal waveform. Often, at low outputs, the distortion is masked by hum or random noise.
If the tested channel appears to be normal, a full test need not be made on the other channel. A simple check of clipping power output at 1000 Hz should be sufficient.
Record Players
Turntable and pickup measurements are made with the test setup of Fig. 3.
For wow and flutter measurements, the 3-kHz test bands of the STEREO REVIEW SR-12 or CBS Labs STR150 records may be used. The amplifier can be any preamplifier or integrated amplifier, with its output going to the wow and flutter meter. An appreciable fluctuation in meter reading can be expected, especially when measuring wow, which requires operator judgment in determining the true reading.
The meter manufacturer's instructions should be followed carefully. Wow and flutter may be measured independently by appropriate settings of the test instrument, or a single combined figure may be obtained. Either method is satisfactory. The combined wow and flutter of the better-grade turntables is under 0.1 %, most good turntables fall between 0.1 and 0.2 %, and low-priced units may go as high as 0.3 %. Rumble measurements, according to NAB standards, require playback equalization not found in standard hi-fi amplifiers. However, a reasonable approximation is possible with a good RIAA-equalized preamplifier. The response should be as accurate as possible at low frequencies, where errors can have a great effect on rumble measurements.
Rumble is referred to a reference level of 1.4 cm /s (stylus velocity) at 100 Hz. The CBS Labs BTR150 and STR100 test records have lateral bands recorded at 5 cm / s (1000 Hz). If either of these records is used to establish a reference level, add 2.1 dB to the measured rumble to obtain the correct figure. The STEREO REVIEW SR-12 record has four bands, recorded at 1000 Hz with different levels. If the highest level band is used (4.67 cm /s), add 2.8 dB to the measured rumble.
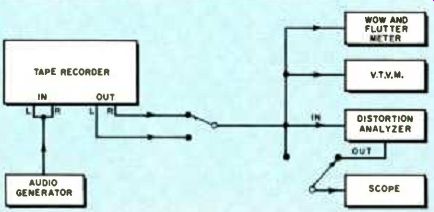
Fig. 4. Set-up that is used for tape-recorder measurements.
The procedure is simple. Play the reference-level bands and adjust the amplifier gain so that the v.t.v.m. reads 0 dB (or any other convenient level). Then play the silent groove bands of the BTR150 and SR-12 records and observe the meter reading. It will probably fluctuate considerably, requiring visual averaging over some period of time. The average reading is noted, as "X" dB below the reference level. Add the correction factor of 2.1 dB or 2.8 dB, and you have an approximate unweighted rumble figure.
It is approximate because of uncertainties in amplifier equalization and the meter-response characteristics, but is sufficiently accurate for our purposes. The rumble measured in this manner includes both vertical and lateral components. By paralleling the two channels of the cartridge, the vertical components are canceled, and the remaining rumble is essentially horizontal. There is usually a drop of 3 or 4 dB in the meter reading when this is done. The less the change in reading, the less vertical rumble is present (a desirable condition). Typical rumble figures for low-priced turntables are -25 to -30 dB. Good component-quality automatic turntables usually have rumble between -30 and -35 dB (which is the NAB broadcast standard), while the best turntables measure from -35 to -40 dB or lower. These are unweighted figures, which cannot be compared to most manufacturers' specifications, but which are valid for appraising the quality of a turntable.
Phono Pickups
The same setup is used for pickup and arm testing as for turntables. It is usually advisable to install the cartridge with the manufacturer's recommended tracking force, using an accurate gauge. Do not try to operate at the minimum recommended force. Practically all cartridges give their best performance when operated in the middle or upper part of the range of recommended forces.
Anti-skating should be set initially as recommended by the arm manufacturer. As a check, play the special bands of the STEREO REVIEW SR-12 test record. Often a higher anti-skating force than recommended gives better results, and this record provides an accurate means of making the adjustment without instruments.
The most widely used frequency-response test record is the CBS Labs STR100. If an unequalized (flat) preamplifier input is available, it should be used when playing this record. Be sure to connect a 47k-ohm resistor across the cartridge if a regular phono input is not used (sometimes a high-gain microphone input is available). If you use a good-quality mono preamplifier for all your cartridge testing, you may be able to remove the RIAA deemphasis in the preamplifier for this purpose.
The test record has voice announcements of the spot frequency bands, from 20 kHz down to 20 Hz. An ideal pickup will have flat frequency response from 20 kHz to 500 Hz.
The portion below 500 Hz can be ignored, since it is more likely to reflect the preamplifier equalization and record characteristics rather than the cartridge itself. If the preamplifier has RIAA equalization, the CBS Labs record is supplied with information for interpreting the response readings.
Record the output readings of the preamplifier from the v.t.v.m. for each test frequency, while playing the left-channel side of the record. Then turn the record over (right side) and repeat the test. This gives both the frequency response and crosstalk for the left channel. Repeat the process for the other channel. When the data is plotted, there will usually be some differences between the two channels.
Moderate differences are normal and are due to a combination of record and cartridge characteristics.
Channel separation is usually 25 dB or better at mid-frequencies (500 Hz to several kHz), but may reduce to 10 dB or less at the highest frequencies.
There are sometimes rather large irregularities in the crosstalk curve, compared to the frequency-response curve. This is not serious, unless the separation goes to less than 15 dB at mid-frequencies, which indicates a defective or improperly installed cartridge.
Caution: Do not play your test records with cartridges requiring more than 3 to 4 grams tracking force. The high-frequency bands can be seriously damaged by a single playing with a low-quality cartridge. In time, this will occur even when good cartridges are used. It is good practice to keep a fresh pressing of the record on hand as a check on the condition of your regular records.
The output level of a cartridge is measured by connecting one channel at a time to the v.t.v.m. (with a 47k-ohm terminating resistor) and playing the 5 cm /s band of the CBS Labs STR100 record. Most cartridges have an output between 3 and 10 millivolts, which can be read directly on inexpensive v.t.v.m.'s.
Tape Recorders
The tape recorder test setup is shown in Fig. 4. The recorder's playback equalization is first tested with a standard alignment tape. The high-frequency portion of this tape is also used for head-azimuth alignment, which is assumed to have been adjusted, together with any required bias and equalization adjustments, prior to testing.
The test frequencies on the tape are preceded by voice announcements. An amplifier and speaker (or headphones) may be used to monitor the tape during playback. If the recorder has its own playback amplifiers and speakers, these may also be used for this purpose.
However, all measurements should be made at the line outputs. Record the V.t.v.m. reading for each frequency. By subtracting the meter reading for the reference level (usually at 1000 Hz or 500 Hz) from each reading, the net frequency response can be determined.
For the over-all record /playback response measurement, load the recorder with the manufacturer's recommended tape. Some machines are adjusted for the so-called "standard" tapes, such as 3M#111, while others are optimized for low-noise tapes, such as 3M #201 or #203. Supply a test signal at 1000 Hz, at a 0-dB level as indicated on the recorder's meters, and reduce the audio generator output by 20 dB. Record a series of test tones at this level, at frequencies from 20 Hz to 20 kHz. A reasonably complete test can be made with tones spaced in a 1, 2, 3, 5, . . . progression (e.g., 20 Hz, 30 Hz, 50 Hz, 100 Hz, etc.). Make a record of the frequencies used or, preferably, identify each one with a voice announcement on the tape.
Rewind the tape and play it into the test instruments. Record the v.t.v.m. reading for each frequency. Repeat the playback for the other channel. The data, when plotted, is the record/ playback characteristic of the recorder.
If the recorder has several speeds, this test should be made at each speed.
For signal-to-noise ratio measurements, record a 1000-Hz signal at 0-dB level for about 30 seconds. Remove the signal and turn the recording gain to minimum, while continuing to record.
When the tape is played back, note the v.t.v.m. reading from the 1000-Hz tone, and on the "quiet" portion of the tape which follows its removal. The change in meter reading is the unweighted signal-to-noise ratio of the machine. The scope will show whether the "noise" is random hiss or if it contains hum or sub-sonic "bounce." Rewind to the beginning of the 1000-Hz tone and play it into the distortion analyzer. Measure the distortion level. If it is appreciably less than 3 %, as it often is, make several additional recordings at higher levels, in steps of 1 or 2 dB and measure the distortion. This is necessary because most recorder manufacturers specify the S / N ratios of their machines relative to the recording level which produces 3% distortion on playback. This is usually somewhat higher than the maximum recommended recording level shown on their meters. As an example, if the S/N ratio is 45 dB relative to the 0-dB recording level, but a +8-dB level is needed to produce 3% distortion during playback, the S/N ratio of the machine is 53 dB. To measure wow and flutter, use a standard flutter test tape with 3000 Hz recorded with very low flutter (usually less than 0.02 %) and connect the flutter meter to the recorder output.
Most home tape recorders have an unweighted S/N ratio between 40 and 50 dB, with the best approaching 60 dB. Wow and flutter are similar in magnitude to that of good turntables, but in recorders the flutter is usually much greater than the wow, while the reverse is true of turntables.
If a standard flutter test cassette is not available, the wow and flutter of cassette machines can be measured by recording a 3000-Hz tone from the audio generator and playing it back into the flutter meter. This gives somewhat unreliable readings, usually higher than the true flutter of the recorder.
The best cassette decks may measure as low as 0.15% flutter when tested in this manner, but 0.3% to 0.4% is more common.
Also see: Testing Hi-fi Equipment--Part 1--Test Equipment Required