By CHESTER W. YOUNG
Four design charts that can be used to simplify selection of components for a solid-state voltage-regulator circuit.
Editor's Note: Although some of the nomograms shown in the following article are used to solve some fairly simple calculations, they do serve to demonstrate the use of nomograms in design work. In most cases, nomograms serve to speed up tedious, time-consuming calculations simply by the user placing a straightedge over the scales of the chart.
THE silicon zener diode is the workhorse of solid-state voltage regulators and simple circuits like that of Fig. 1 are easy to design. Although the regulating action is similar to that of the VR tube, zeners are quite temperature-sensitive so additional calculations are necessary. Four design nomograms have been developed that will help make regulator design fairly routine.
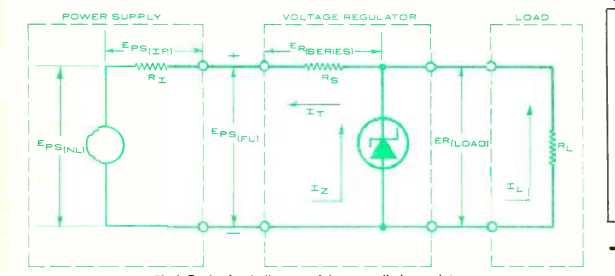
Fig. 1. Basic circuit diagram of the zener-diode regulator.
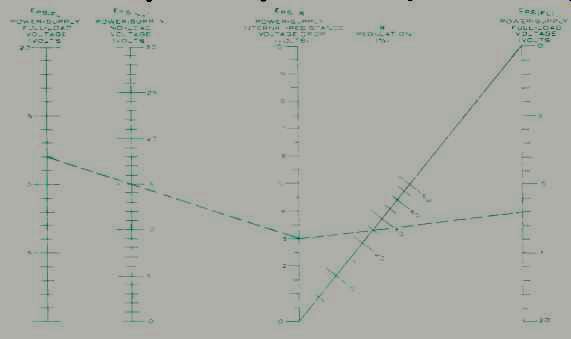
Fig. 2. This voltage-regulator design nomogram is used to determine
percentage regulation of zener supply voltage.
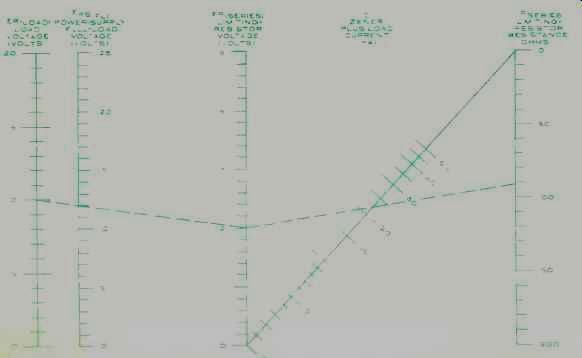
Fig. 3. The second voltage-regulator design nomogram is used to determine
the parameters of the series limiting resistor.
Any voltage-regulator design begins with the load requirements and determination of the voltage variations to be supplied to the regulator from the basic power supply. The nomogram of Fig. 2 shows how the regulation of the supply can be determined. First the no-load voltage is determined analytically or measured. Then a dummy load can be placed across it equal to the full load and the new voltage measured.
Regulation is determined by the internal resistance drop and can be expressed by the equation:
R-EPS(NL)-EPS(FL) x 100 EPS(FL)
where: R is percentage regulation, EPS(NL) is output voltage of power supply with no load, EPS(FL) is output voltage of power supply with full load, and:
EPS(NL)-EPS(FL) = EPS(IR)
where: Eps(IR) is voltage drop across the internal resistance of the power supply. These three voltage are shown in Fig. 1 to the left.
The first three scales on the left of Fig. 2 determine the numerator of the first equation and the "Z" scales on the right use the numerator to calculate the regulation.
For example, if an unregulated supply furnishes 15 volts under no-load condition and 12 volts under full dummy load, we have a 3-volt internal resistance drop. If we draw a line between the 3-volt point to the right to a 12-volt point on the fifth scale, we cross the Regulation scale at 25 %.
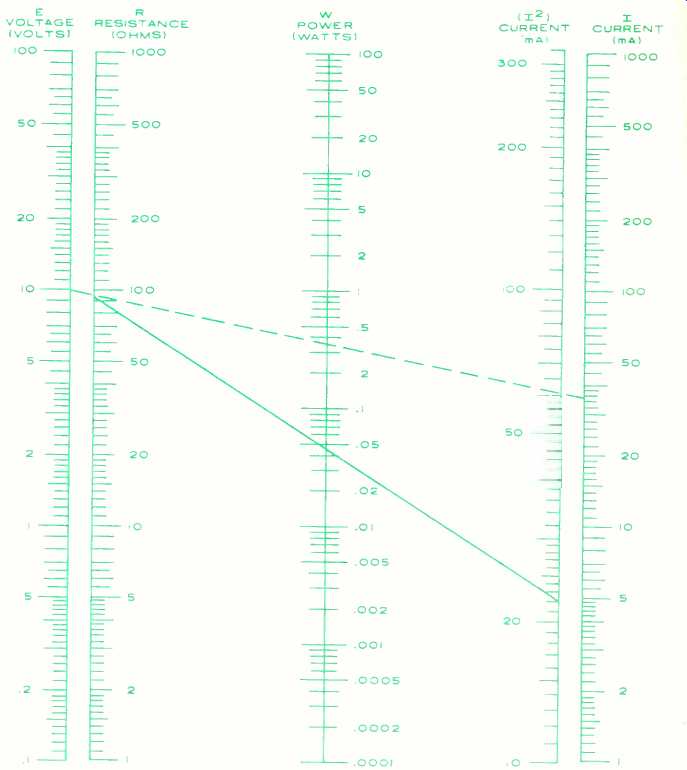
Fig. 4. The third design nomogram is employed to find the power requirements
of the series resistor and zener diode.
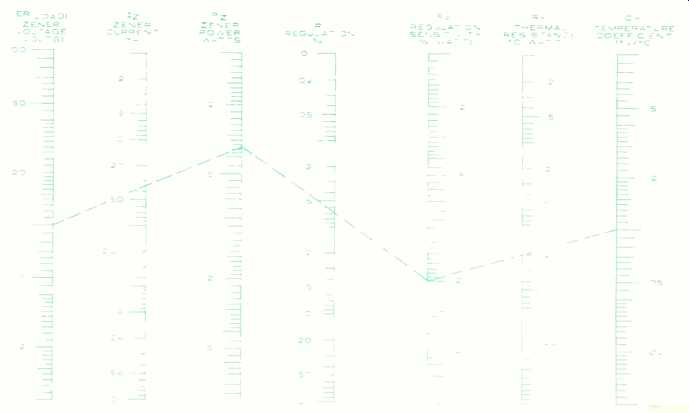
Fig. 5. This fourth nomogram is used to relate the various zener-diode
parameters in order to provide circuit trade-offs. Four design charts
that can be used to simplify selection of components for solid-state
voltage-regulator circuit.
----------------
The second nomogram (Fig. 3) takes the next step and starts with the power-supply full-load voltage. This is combined with the current requirements of the load and the zener to determine the series limiting resistor value. The three scales to the left determine the voltage drop involved and the "Z" scales on the right determine the required resistance. Two equations are:
ER(series) = EPS(FL)-ER (load)
where: ER(series). is voltage across series-dropping resistor, EPS(FL) is voltage output of the power supply under full load, ER(load)is voltage to be maintained across the load by zener diode and:
R_series = ER(series) / I
where: R_series is required resistance of the series-dropping resistor and I is the total current to be drawn under regulating conditions.
For example, if we assume that we have been designing for a load that requires 10 volts at 20 milliamperes, we enter the nomogram on the second scale at 12 volts (our power supply full-load voltage) and connect a line to the first scale at the required 10-volt point.
Extending this line to the third scale on our right we determine the voltage drop across the resistor to be 2 volts.
The "Z" chart on the right helps determine the resistance value if the load current (20 mA) and the zener current (usually 10% of required load current, 2 mA) are known. In this case the total would be 22 mA drawn through the dropping resistor. A line extending from the 2-volt point (3rd scale) to the far-right scale passing through the 22-mA point of the middle "Z" scale would intersect at 91 ohms. This solves the fraction 2/0.022.
The selection of the series resistor is determined by the resistance value just calculated and the maximum current to be drawn through it. The nomogram in Fig. 4 determines the power (center scale) from either of the formulas: W= EI or W= PR, where W is power (in watts) dissipated in either resistor or zener diode, E is volts across resistor or zener, and I is current through resistor or zener.
For example, we have just determined the series-resistor value to be 91 ohms so we enter this on the second scale from the left. We also know the total load and zener current is 22 mA. This value is entered on the second scale from the right (P) at 22 mA. Joining these two points with the solid line, we cross the center (W) scale at 0.044 watt. A half-watt resistor would be more than adequate.
Since we have a 10-volt zener, we enter this value on the first scale on the left. Since the zener will hold the voltage on one side of the series-dropping resistor at 10 volts, then the 15-volt no-load voltage of our power supply will drop 5 volts across the series resistor.
This can produce a 55-mA current through the resistor of which 20 mA will be required in the load, leaving 35 mA through the zener. Entering the far-right scale at 35 mA and joining the far-right and far-left scales with a dashed line, we find the zener power to be 0.35 watt. If we assume that it is possible for the load to be disconnected, the latter two numbers could be 55 mA for the zener and 0.55-watt dissipation. Hence, in either case a 1-watt zener would probably provide an adequate safety factor.
The fourth nomogram, Fig. 5, can provide trade-offs to determine the regulation to be expected or can help to determine the parameters necessary to select a zener for a given performance. The first three scales on the left are power-calculation scales using the familiar:
Pz = ER(load) Iz
where: Pz is zener power consumption, ER(load) is zener and load voltage, and I. is zener current.
The three scales on the right make use of the manufacturer's data on the zener temperature sensitivity. The two scales on either side of the center (R) scale, Pz and Rp, are used to determine the final regulation to be expected from our system. These three scales are used with the equation:
RP= CrRT
where: Re is regulation sensitivity in percent per watt, CT is temperature coefficient in percent per °C, and RT is thermal resistance in °C per watt.
For example, repeating the zener power calculations of the last nomogram using E =10 volts on the left scale, I =35 mA on the second scale, we reach P =0.35 watt on the third scale.
Then if the manufacturer gives the temperature coefficient as 0.10 % / °C for the zener we are considering, this value is entered on the far-right scale.
If this particular zener also has a thermal resistance of 20 °C /watt, this is entered on the RT scale. A line joining these points and extending to the left will intersect the RP scale at 2.0% / watt. Now a line joining this point with 0.35 watt on the Pz scale crosses the R scale at 0.7% which is the overall expected regulation.
(adapted from: Electronics World magazine; Jul. 1975)
================