EQUALIZATION rivals in importance any other single function of the tape amplifier. Not only is it vital as a means of achieving frequency response that is reasonably flat (consistent with tape speed), but it is also related to the distortion and signal-to-noise characteristics of the tape recorder.
The subject of equalization is divided into two sections. The present one explains why equalization is needed and how it is achieved in terms of equalization curves and location of the necessary circuits. The next section is concerned with circuitry, examining the principal types of networks employed for bass or treble compensation and discussing their relative merits.
Recording without equalization
What happens if only the amplification, bias and erase requirements of the tape recorder are satisfied, but no equalization is provided? Fig. 601 contains the answer. The solid line shows the response characteristic at a speed of 7.5 ips; the dash line at 15 ips. Data are for a high-quality record-playback head operated at a practical bias level.
Fig. 601 obviously indicates the need for both bass and treble boost, the need for treble boost being greater at 7.5 ips. It shows that the amount of equalization required in the treble range varies inversely with tape speed and frequency.
Because of the 2-to-1 ratio between the speeds represented in Fig. 601, each point on the 15-ips curve bears an octave (2:1) relationship to a corresponding point on the 7.5-ips curve. Thus, the point of maximum response is 6,000 hz on the 15-ips curve and 3,000 hz on the 7.5-ips curve. To illustrate further, at 15 ips the response at 10,000 hz is about 8 db higher than at 1,000 hz; at 7.5 ips, the response at 5,000 hz is about 8 db higher than at 500 hz. The 15-ips curve may be derived from the 7.5-ips one essentially as follows. Each point on the 7.5-ips curve, representing a given wavelength, is shifted one octave to the right because at twice the speed a given recorded wavelength represents twice as high a frequency. These shifted points are then raised 6 db because doubling the frequency in playback means that the head produces twice as much output.

Fig. 601. Unequalized record-playback response of a high quality head
operating at 7.5 and 15 ips. Constant current used in recording. Bias
in normal range.
Although equalization is largely concerned with wavelength effects, it is less cumbersome and facilitates understanding to keep the discussion in terms of frequency. To do so means that it is necessary to assume a given tape speed. Therefore the discussion is in terms of effects observed at 7.5 ips, the speed most commonly used at present by home recordists interested in high fidelity.
However, unless specifically stated otherwise, the effects under discussion vary inversely with wavelength.
----------------------
To a relatively minor degree there are losses that vary purely with frequency, not with wavelength, and to this extent the octave relationship between curves I and 2 is not exact.
------------------------
Record and playback losses
The earlier analysis of head characteristics, tape characteristics and bias current has already indicated the various factors responsible for the bass and treble losses shown in Fig. 601. The need remains, however, to assemble these various factors into one composite picture so that the reader may have an integrated view as to why equalization is required.
Record losses affect the treble range and are for the most part due to demagnetization and bias erase. Demagnetization refers to the fact that high frequencies recorded on the tape correspond to short bar magnets and the shorter the distance between the north and south poles of a magnet, the more these poles tend to cancel each other, thus reducing the magnetic flux on the tape. Bias erase refers to the fact that increases in bias current tend to reduce the amount of signal recorded on the tape, much more so at high frequencies than at low.
Demagnetization and bias erase are effects that vary with recorded wavelength. But there are other record treble losses that vary purely with frequency, regardless of the speed at which the tape recorder is operated. These so-called "head losses" are of three kinds: (1) those due to capacitance between turns of the head winding; (2) those due to eddy currents circulating in the core of the head; (3) those due to hysteresis of the core. Losses caused by eddy currents and hysteresis are referred to as "iron losses." When a high-quality head is used, these losses are kept to a minimum within the audio range, sometimes in the order of only 1 db.
In playback, both bass and treble losses are significant. The principal reason for bass loss is the "constant-velocity" characteristic of the playback head. As previously explained the output of the head tends to be proportional to the rate at which the magnetic flux of the tape changes polarity. The lower the frequency, the slower the rate of change and hence the less the output. A minor reason for bass loss at the very low end (largely below 50 hz) is the wrap effect; that is, the material of the head may adversely affect magnetic coupling between the tape and the playback head gap when the magnetic flux extends an appreciable distance from the tape. This is the case at very low frequencies.
Treble losses in playback are essentially those due to the gap.
The narrower the gap, the better its ability to reproduce high frequencies. Shortly above the frequency where the recorded wave length becomes so small that it is only twice the width of the gap, the response drops very abruptly. All heads presently used in audio tape recorders have some losses due to gap width, but the top-quality heads have gaps narrow enough to insure that the drop in response at 15,000 hz (at 7.5 ips) is no more than about 5 db.
The other treble losses that occur in playback are due to winding capacitance and the so-called iron losses. Winding capacitance loss is more likely to occur in a head designed expressly for play back than in one designed also for recording. The reason is that such a playback head has a large winding to maximize output whereas in the record/playback head the winding must be limited so that the bias current is not excessively attenuated.
The principal factors responsible for the losses that occur in the tape recording and reproduction processes are portrayed in Fig. 602. The data are based on a high-quality record-playback head, bias current within the normal range and the tape operating at 7.5 ips. Starting with the theoretical 6-db-per-octave rising characteristic throughout the audio range a loss-free playback head would produce if the tape contained the same magnetic flux at all frequencies, high-frequency response is successively reduced by record loss due to bias erase and demagnetization, by playback loss due to gap width, and by other record and playback head losses (winding capacitance and iron losses). The final result is the unequalized record-playback response curve of Fig. 601.
The only loss not specifically represented in Fig. 602 is the so-called wrap loss at the low end in playback. This can differ substantially from one head to another and in a well-designed head can be brought below the audio range. Moreover, the con tour effect may offset wrap loss, possibly to an extent where there is a slight rise in response at the low end relative to the 6-db-per octave rising playback characteristic.
It is assumed that the tape amplifier does not contribute to bass and treble losses, but is essentially flat-apart from the equalization circuits-over the audio range.
Location of equalization circuits
It is apparent from Fig. 602 that substantial amounts of bass and treble equalization are required in the tape-recorder amplifier to achieve a reasonably flat response. This compensation may be provided either in record or in playback or partly in each. The course followed can make a substantial difference in signal-to-noise ratio and distortion. The ideal is to put as much signal as feasible on the tape at all frequencies. Accordingly, the location of equalization circuits should be governed by the following general principles, which bring out a vital distinction between bass and treble boost.
Bass-boost location
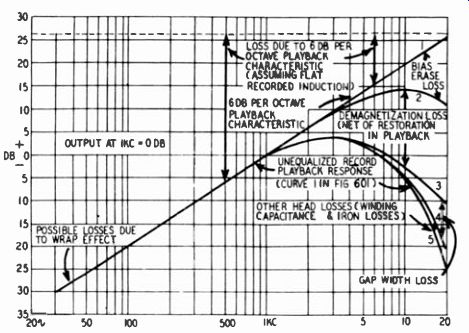
Fig. 602. Principal factors responsible for 7.5-ips record playback
response shown in Fig. 601.
Fig. 601 shows that over 30 db of bass emphasis is required.
Taking into consideration that there is a drop-off in audio energy at the low-frequency end, some bass equalization during record is feasible, but record bass boost on the order of 30 db would result in tremendous low-frequency distortion on the tape. True, the record level could be reduced to avoid this distortion, but then the signal-to-noise ratio would suffer by the same amount.
Consequently, bass equalization must take place primarily in the playback amplifier for high-quality results.
Playback bass boost limitations
On the other hand, it is not desirable to continue playback bass boost to an inordinately low frequency, partly because of low-frequency noise and hum and partly because it is expensive in terms of amplification stages to carry equalization to an extreme point. Therefore, playback bass boost should level out around 50 hz instead of continuing at the rate of 6 db per octave to a much lower frequency. If it is desired to maintain record-play back response reasonably flat to 30 hz or lower, it becomes necessary to incorporate bass boost for the range below 50 hz in the record amplifier. A few db of bass boost in record will do no harm with respect to distortion.
Treble-boost location
To the extent that treble boost takes place in playback, it not only raises the level of high-frequency audio signals but also emphasizes tape hiss and noise in the early stages of the playback amplifier. Therefore, playback treble boost results in deterioration of the signal-to-noise ratio. For this reason and because the distribution of energy in the audio spectrum makes it feasible, treble boost should take place primarily in record. Typical audio sources exhibit a considerable drop-off in energy above the middle of the audio range. To the extent that treble boost is offset by declining audio energy, more or less the same amount of magnetic flux is applied to the tape over the upper range, thus avoiding an in crease in distortion. Moreover, as the frequency increases, the strength of the magnetic field that can be applied to the tape for a given level of distortion goes up somewhat.
However, there is a limit to the magnetic flux which can be applied to the tape and thus there is a limit to the treble boost that can satisfactorily be employed in recording. Accordingly, depending upon tape speed, it may be necessary to settle for a frequency response which does not span the entire treble range.
Otherwise, distortion may rise and/or signal-to-noise ratio may fall in order to preserve full treble response.
A limited amount of treble boost may be used in playback.
The extent of this boost should correspond at the most to treble losses due to gap width, winding capacitance and iron losses of the playback head as well as to cable and input tube capacitances.
However, this does not mean that satisfactory performance can be had by using a head with relatively large losses and compensating for such losses by a large amount of playback treble boost.
This, of course, would result in a poor signal-to-noise ratio. For high-quality results, treble boost in playback should be limited so that it does not exceed roughly 6 db at 15,000 hz.
A valid reason for permitting some treble boost in playback is that head losses vary from one head to another. If a tape recorded on one machine is to be played back on another, ordinarily one cannot anticipate the head losses of the playback unit. Therefore, it is logical that treble losses due to the playback head should be compensated in the playback amplifier rather than the record amplifier.
While this approach to the location of bass and treble-boost circuits will insure optimum results, it is not followed by all recorders. As a rule, today's professional and semiprofessional machines adhere to these principles by virtue of the fact that they basically conform to the NARTB standard which embodies them. But many (if not most) home tape recorders deviate from the NARTB standard because of the cost factor. They use the same, or almost the same, equalization in record and playback; that is, half the required equalization is provided in record and the other half in playback, for bass and treble alike. Although the results thus obtained can be satisfactory, they are not as good as those obtained by confining bass boost primarily to playback and treble boost primarily to record. The greater amount of bass boost in record threatens distortion, unless the record level is reduced, thereby decreasing the signal-to-noise ratio. And the greater amount of treble boost in playback augments tape hiss and amplifier noise, further reducing the signal-to-noise ratio.
Basic equalization pattern
Before discussing the problem of equalization in terms of specific curves and frequencies, it is desirable to consider the subject in basic, generalized terms. Such an approach will help make clear a vital point: the turnover frequency (3-db rise) at which--bass boost begins in playback serves to determine the amount of treble boost needed in record.
The lower the playback turnover frequency, the less the record treble boost required. In other words, equalization may be effected either by using a large amount of playback bass boost together with a large amount of record treble boost, or by using a small amount of each. However, reduced equalization, while mitigating problems of low-frequency noise and of distortion due to excessive record treble boost, at the same time results in an inferior signal to-noise ratio. This is so because less signal is recorded on the tape.
Figure 603 represents the basic pattern of equalization in a high-quality recorder. Line A-B covers the range over which flat response is feasible (although in practice the response is allowed to drop slightly at each end of the range). f 1 is the lowest frequency in this range and f 3 the highest. t 2 is the turnover frequency, the point at which the various curves shown have either risen or declined 3 db from a previously flat course.
Line C-D is the response of an ideal playback head, one with out losses or aberrations of any sort, rising 6 db per octave throughout the range. This response assumes that the amount of magnetic flux recorded on the tape is the same at all frequencies; in other words, the record amplifier has compensated all record losses by means of treble boost. The slope of line C-D is illustrated in Fig. 603.
Line C-D may be viewed as either bass droop or treble rise, depending upon the location of turnover frequency 12. The portion above 12 may be viewed as a rise in response. It may be seen, therefore, that the rising characteristic of the playback head in effect supplies treble boost above 19.
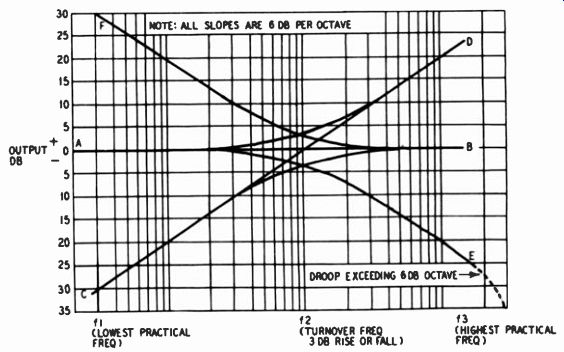
Fig. 603. Baste pattern of equalization in a tape recorder. AB: range
of flat response; CD: response of an ideal head to flat recorded flux;
AE: actual recorded flux; CB: response of an ideal head to actual recorded
flux; FB: bass boost requited to flatten curie CB.
This treble boost due to the playback head is needed to compensate for the fact that magnetic flux recorded on the tape is not flat, as previously assumed, but drops off at the high end.
Curve A-E is the actual frequency characteristic recorded on the tape. Because of the large magnitude of record losses, it is impractical to record flat at the lower tape speeds (15 ips and less).
This would necessitate tremendous treble boost, leading to excessive distortion or else a vast reduction in recorded signal level and hence in signal-to-noise ratio. Consequently, the recorded flux is permitted to decline at the treble end. 12 defines the frequency at which recorded flux is 3 db down. Record treble boost has to be such that curve A-E declines at a rate approaching 6 db per octave.
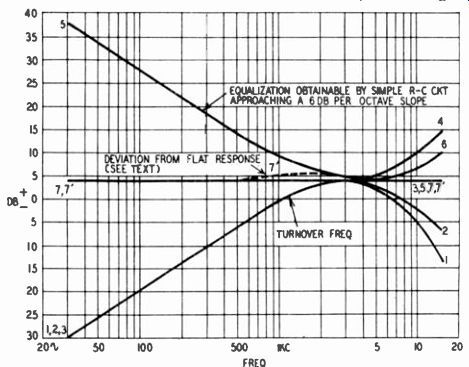
Fig. 604. Equalization of 7.5-ips record-playback response in Fig. 601.
Minimum equalization. A slight deviation from flat response occurs between
600 and 5,000 hz because curve 5 conforms to a 6-db-per-octave characteristic
and therefore does not exactly complement curve 3. 1: unequalized record
playback response (Fig. 601); 2: unequalized record-playback response
without playback-head losses; 3: desired playback response for flat treble
response; 4: required record boost for flat treble response (3-2); 5:
required playback boost for approximately flat bass response (7'-3);
6: required playback boost for fiat treble response (2-1); 7: equalized
(flat) response.
The rising response characteristic of the playback head above 1 2 compensates for the declining portion of A-E above f 2. The combined result of curves C-D and A-E is curve C-B, namely playback response before bass boost. This should essentially be supplied in playback (although the less expensive recorders often supply a substantial portion in record). To achieve flat response, curve F-B compensates curve C-B. F-B in a high-quality recorder is essentially playback bass boost.
Since playback equalization (F-B) is determined by playback response before such equalization (C-B) and since the latter in turn is determined by recorded flux (A-E), it is apparent that playback equalization and recorded flux are directly related to each other. Given one, the other is defined (assuming flat overall response). Thus the equalization of a tape recording system can be stated either in terms of the magnetic flux recorded on the tape or in terms of the bass-boost characteristic of the playback amplifier.
It is much easier and more practical to supply the definition in terms of playback bass boost.
If the turnover frequency f 2 were reduced (shifted to the left), less bass boost (F-B) would be required. At the same time, this would shift the recorded flux (A-E) to the left. In other words, recorded flux would begin to decline at a lower frequency. There- fore less record treble boost would be needed to provide the stipulated flux characteristic. The greater drop in recorded flux at any given treble frequency would be compensated by the fact that the rising characteristic of the playback head (above f 2) would begin at a lower frequency, resulting in greater treble boost.
Thus one can realize the important fact that smaller amounts of bass boost in playback go hand in hand with smaller amounts of treble boost in record, and vice versa.
Specific equalization patterns
In the following discussion, all references to Fig. 601 pertain to the unequalized record-playback response at 7.5 ips.
Fig. 604 shows theoretically how this unequalized response, redrawn as curve 1, can be equalized with a minimum of treble and bass boost. As a matter of fact, an approach of this sort is taken by many moderate-price recorders inasmuch as the less the equalization, the less the problem of providing enough gain to overcome the insertion losses due to equalization. Also, reduced playback bass boost minimizes hum problems.
Fig. 604 is idealized in the sense that it shows equalization such as to produce a response flat from 30 to 15,000 hz. In practice, even the best recorders do not attempt to maintain flat response over this range at 7.5 ips. Instead, they permit a few db droop at both ends. This reduces problems of low-frequency noise, of providing sufficient gain, of possible distortion due to excessive treble boost, of decreasing the signal-to-noise ratio due to high-frequency boost in playback, etc.-all at a cost of so slight a deviation from flat response that it is nearly or completely unnoticeable. For ease of presentation, however, it is easiest to show full equalization from 30 to 15,000 hz, especially since recorders vary substantially as to the amount of droop at each end. "Flat" equalization will also be shown in the remaining figures in this section, unless specifically noted otherwise.
Curve 3 in Fig. 604, corresponding to C-B in Fig. 603, represents flat treble response in playback, with bass still remaining to be compensated. The difference between curves 1 and 3 is due to two factors: record treble losses and playback-head treble losses.
As previously stated, record treble losses should be compensated in the record amplifier and playback-head treble losses should be compensated in playback. Accordingly, record losses are compensated by curve 4, which equals the difference between curves 2 and 3. Curve 2 is the unequalized record-playback response without playback-head losses. Playback-head losses, which equal the difference between curves 1 and 2, are compensated by curve 6.
It remains to compensate curve 3 by bass boost to achieve over all flat response, depicted by curve 7. Thus the amount of play back bass boost needed is the difference between curves 7 and 3.
It is general practice to use a simple R-C circuit, approaching a 6-db-per-octave slope, to achieve bass boost for playback purposes.
Curve 5, corresponding to F-B in Fig. 603, is of this type, and its turnover point (3-db rise) is selected so that curve 5 complements curve 3 over as much of the required range as possible. Consequently, curve 7 actually is not flat, as shown by its dashed portion 7'. However, the deviation from flat response is relatively minor being 1.5 db at most.
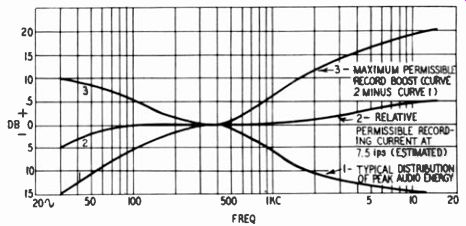
Fig. 605. Approximation of maximum permissible treble and bass boost
in recording.
Although the scheme of equalization in Fig. 604 is quite feasible and demands only 10.5-db record treble boost, it fails in a very important respect. It does not produce as much signal-to-noise ratio as practicable. To maximize this ratio, it is necessary to put on the tape as much signal as possible without incurring excessive distortion. This Fig. 604 does not do.
Music, speech and other audio material most commonly re corded on tape have substantially less energy at the high frequencies than in mid-range. Energy also drops off at the low end.
The approximate nature of the distribution of audio energy is shown in curve 1 of Fig. 605. It must be stressed that this curve is not definitive but represents only a smoothed version of a typical situation, in this particular case an orchestra. On the other hand, curve 1 is representative enough to be useful for the present discussion. Curve 1 shows the relative distribution not of average, but of peak levels. It is these peak levels that are of concern with respect to the tape's ability to handle signals without excessive distortion.
To the extent that high frequencies have a relatively small peak amplitude, it is possible to boost them in the record amplifier without overloading the tape. Furthermore, for a given amount of distortion, the tape can be exposed to somewhat larger magnetic fields at high frequencies, as indicated roughly in curve 2 of Fig. 605. Therefore, the amount of record treble boost which can be safely employed is represented by curve 3, obtained by taking the difference between curves 2 and 1 (or by adding the absolute differences between each curve and the 0-db line).
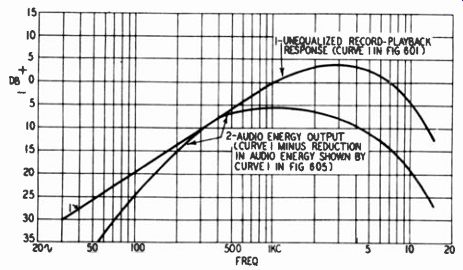
Fig. 606. Approximate audio energy out put of record playback head in
Fig. 601.
The unequalized record-playback response in Fig. 601 (curve 1) is predicated on constant current in recording; in other words, it assumes the same level of signal input at all frequencies. Realistically, however, when dealing with a typical audio source, the unequalized audio output is similar to that depicted by curve 2 in Fig. 606. This equals curve 1 in Fig. 601 less the reduction in audio energy at various frequencies shown by curve 1 in Fig. 605. The difference in Fig. 606 between curves 1 and 2 in the treble region indicates to a substantial extent how much the signal-to noise ratio can be improved by treble boost in record.
Looking at Fig. 604, the maximum of 10.5-db record treble boost (at 15,000 hz) is considerably short of the maximum of 20-db boost which can safely be used according to Fig. 605.
Fig. 607 shows the equalization which might be used to maximize the signal-to-noise ratio, assuming a maximum permissible record boost of 20 db at 15,000 hz per curve 3 of Fig. 605.
Curves 1 and 2 are the same as in Fig. 604, showing unequalized record-playback response with and without playback-head losses.
Curve 3, representing flat treble response in playback, is chosen on the following two bases: (1) to achieve overall flat response it can be matched by a playback bass-boost curve having a 6-db-per octave slope produced by an R-C circuit; (2) the amount of record boost required for flat treble response will reach a maxi mum of 20 db at 15,000 hz. Put differently, at 15,000 hz the difference between curves 3 and 2 is 20 db.
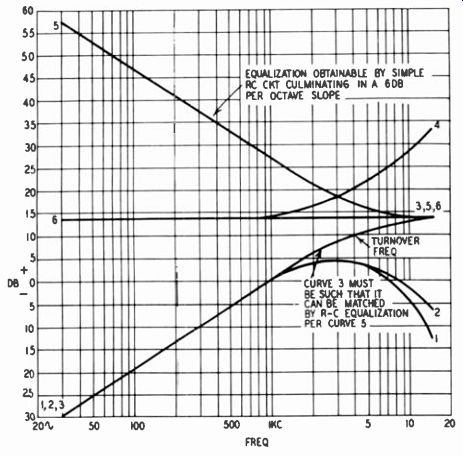
Fig. 607. Equalization of 7.5-ips record-playback response in Fig. 601.
Maximum signal-to-noise ratio. 1: unequalized record-playback response;
2: unequalized record-playback response without playback-head losses;
3: desired playback response for flat treble response; 4: required record
boost for flat treble response (3-2); 5: required playback boost for
flat bass response (6-3); 6: equalized (flat) response.
Comparing Figs. 607 and 604, curve 3, which in each case is the desired playback response for a flat treble characteristic, has considerably more amplitude in Fig. 607. This difference in amplitude corresponds to the difference between the treble-boost curves (curve 4) in the two figures. In other words, a tape re corded according to Fig. 607 has considerably more treble signal on it and therefore a higher signal-to-noise ratio in playback.
To achieve a flat response out to 15,000 hz, it would be necessary to use playback treble boost equal to the difference between curves 2 and 1, representing playback-head losses. This boost is not shown in Fig. 607, being the same as curve 6 in Fig. 604.
Given a playback response such as that of curve 3, obtained by proper treble boost in record and playback, it remains only to supply the playback bass boost of curve 5 to achieve overall flat response. Curve 5 equals the difference between curve 6, which denotes flat response, and curve 3.
NARTB standard equalization
At this writing, the only official tape equalization standard is that established in June, 1953, by the National Association of Radio & Television Broadcasters for 15 ips. However, owing to improvements in tapes, heads and tape amplifiers, this standard has also been considered suitable for 7.5 ips recording. Therefore, NARTB equalization or a close approximation to it is, in reality, a standard for 7.5-ips, followed principally by manufacturers of quality recorders and manufacturers of prerecorded tape. A leader in utilizing NARTB equalization (a close approximation) at 7.5 ips has been Ampex Corp., whose tape recorders figure most prominently in making original and duplicate commercial tapes.
Accordingly, the terms "NARTB equalization" and "Ampex equalization" are nearly synonymous at 7.5 ips. In addition, there is an Ampex characteristic for 3.75 ips, widely followed in the commercial field.
NARTB equalization is essentially stated in terms of a specific bass-boost characteristic in playback. Losses due to the playback head require compensation by the playback amplifier. The record amplifier is required to have equalization that will then produce playback response meeting NARTB standards. This standard provides for ± 1-db deviation between 100 and 7,500 hz. Below and above these frequencies the response may gradually deviate more widely. The upper limit remains at 1 db; the lower deviation limit declines at the rate of 3 db per octave so that it is-2 db at 80 hz,-3 db at about 60 hz and-4 db at 50 hz. The upper deviation limit also declines at 3 db per octave so that it is-2 db at 9,500 hz,-3 db at 12,000 hz and-4 db at 15,000 hz. In brief, response may be 4 db down at 50 and 15,000 hz.
Curve 1 in Fig. 608 represents the NARTB playback bass-boost characteristic. Formed by R-C circuits, it consists of a 6-db per-octave slope which begins at 3,180 hz (3-db rise) and levels off at 50 hz (3 db below maximum boost). Inasmuch as the playback boost levels off at the low end, a flat response requires a corresponding bass boost in record, as shown by curve 2.
Omission of this relatively small amount of record boost might not appear to violate the NARTB standard in view of the fact that response is permitted to be down 4 db at 50 hz, whereas the boost of curve 2' is only 3 db at 50 hz. However, omission of record bass boost presumes that the playback head can maintain flat response down to 50 hz. Since this may not be true, it is proper to consider curve 2' as part of the NARTB recording standard.
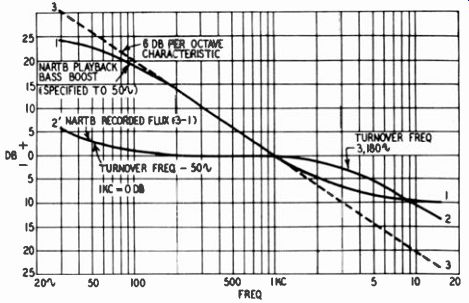
Fig. 608 NARTB equalization.
Here the reader may well ask: Should not standard equalization, refer to a specific record characteristic? The answer is that the NARTB standard, although expressed in terms of playback bass boost, does inferentially denote a specific amount of relative recorded flux at various frequencies, as shown by curve 2'-2. The playback curve and the recorded flux bear a fixed relationship to each other, so that one defines the other. It is more convenient, however, to express the standard in terms of playback bass boost, which can easily be measured by relatively simple means, principally with the aid of an audio oscillator and a vacuum-tube voltmeter. Measuring the recorded flux, on the other hand is an involved process requiring expensive laboratory equipment.
NARTB playback bass compensation, in essence, does two things: (1) it compensates for the playback head's 6-db-per-octave rising characteristic (disregarding head losses, which are compensated by a separate treble-boost curve); (2) it compensates for the variation of recorded flux with frequency, according to the NARTB standard. Consequently, by removing the 6-db-per-octave slope from the NARTB bass-boost curve, NARTB recorded flux is revealed. This is done in Fig. 608. Curve 3 is a 6-db-per-octave slope. Subtracting curve 1 from curve 3 produces curve 2'-2, namely NARTB standard recorded flux.
As can be seen in Fig. 608, the NARTB record characteristic has a turnover frequency (3 db down) of 3,180 hz. In other words, recorded flux does not drop significantly until 3,180 hz.
The reasons for choice of the 3,180-cycle turnover frequency at a speed of 15 ips are concerned with the relative distribution of energy over the audio spectrum, the permissible record current which can be employed at various frequencies and the unequalized record-playback response of a typical head at 15 ips.2 Al though the standard was adopted in June, 1953, work leading to its formulation began several years earlier when tapes and heads had not reached their present state of development so far as high-frequency response is concerned. Consequently, a standard which at the time of formulation was considered suitable only at 15 ips (or higher) was subsequently found also suitable for 7.5 ips. In other words, the recorded flux shown in Fig. 608 can be attained at 7.5 ips with record treble boost that is admittedly high but within practical bounds, and playback heads can come within a few db of flat response at 15,000 hz.
In this connection, Fig. 607 shows that a turnover frequency as high as 4,500 hz is possible at 7.5 ips; that is, even a greater amount of flux could be put on the tape at 7.5 ips than is required by the NARTB characteristic. However, it must be remembered that the turnover frequency shown in Fig. 607 is based on the original unequalized record-playback response curve before play back-head losses (curve 2 in Fig. 607). In turn, curve 2 is deter mined by the amount of bias current used. Although bias current is in the normal range, as originally indicated in Fig. 601, it is still below the amount which would produce minimum distortion.
Higher bias would cause curve 2 to drop more sharply at the high end, thus reducing the feasible amount of flux that could be put on the tape. Since low distortion is as important an objective of quality recording as high signal-to-noise ratio, it must be realized that a turnover frequency lower than 4,500 hz would probably permit better overall results. Thus, a turnover frequency of 3,180 hz is consistent with higher bias and somewhat less signal-to noise ratio.
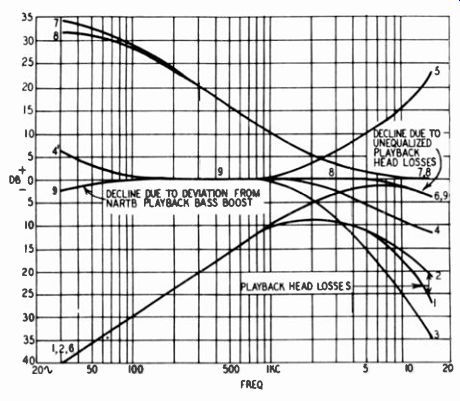
Fig. 609. Equalization of a high-quality tape recorder operating at
7.5 ips.
1: unequalized record-playback response; 2: unequalized record-playback response without playback head losses; 3: treble record losses; 4'-4: required recorded flux (approximately NARTB);-1': required record bass boost; 5: required record treble boost (4-3); 6: equalized treble response (1 and 5); 7: required NARTB playback bass boost; 8: Ampex playback bass boost; 9: equalized bass and treble response (6 + 4' + 8).
-----------------
2 W. E. Stewart, "Why the NARTB Curve for Magnetic Tape," Radio / Television News, June, 1955. Mr. Stewart was a member of the NARTB Subcommittee on Magnetic Recording Standards.
----------------------
In fact, it is argued that 3,180 hz is still too high a turnover frequency for 7.5 ips and that a lower turnover frequency would require less record treble boost, resulting in less distortion, or that for the same amount of treble boost, higher bias current could be employed, serving to reduce distortion. On the other hand, the proof of the pudding is in the eating, and today excellent results are being obtained by high-quality tape recorders operating at 7.5 ips and using NARTB equalization (or very close to it).
Fig. 609 shows the complete pattern of equalization in a high-quality tape recorder using Ampex 7.5-ips equalization, which essentially conforms to the NARTB standard. Curves 1 and 2 are similar to those in Figs. 604 and 607, being the unequalized record-playback response with and without playback-head losses.
Such losses (difference between curves 1 and 2) are small enough (about 5 or 6 db at 15,000 hz) so that the NARTB frequency standard (2 db down at 10,000 hz and 4 db down at 15,000 hz) can be nearly met without compensating for them by play back treble boost. Instead, 1 or 2 db additional treble boost are used in record so that recorded flux (curve 4'-4) represents a slight departure from the NARTB standard.
Curve 3 shows the treble losses encountered in recording, while curve 4 is the Ampex recorded flux characteristic at the treble end. The difference between curves 3 and 4 dictates the required treble boost, represented by curve 5. Curve 6 shows the playback response when record treble boost is supplied but record and playback bass boost are omitted. Curve 4' shows NARTB record bass boost. Curve 7 shows the necessary playback bass boost to achieve perfectly flat bass response. However, the amount actually supplied is slightly less, as shown by curve 8. The resulting over all response is the sum of curves 6, 4' and 8, which results in about 1.5-db loss at 40 hz and 2.5-db loss at 30 hz, which is well within the NARTB frequency response requirements.
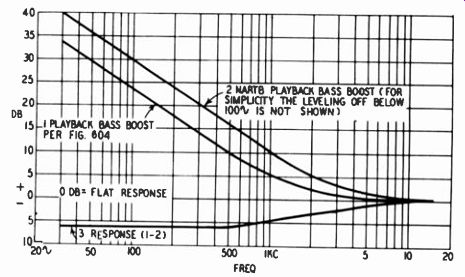
Fig. 610. Response of a tape recorder with playback bass boost per Fig.
604 to a recorded tape requiring NARTB playback bass boost.
Although NARTB equalization is feasible at 7.5 ips, it is not yet in universal use at this speed. Many or most moderate-price recorders use equalization such as in Fig. 604, where the turnover frequency is in the range of 1,000 to 1,500 hz. What happens if tape recorded according to the NARTB standard is played back on such a machine, as often happens today when commercially prerecorded tape is used? The result is shown in Fig. 610.
Curve 1 shows the bass boost that might be supplied by a moderate-price unit (curve 5 in Fig. 604), while the required NARTB bass boost is shown in curve 2. The difference between actual and required bass boost results in the response characteristic of curve 3. This response may be viewed as being either deficient in bass or having exaggerated treble. To an extent, a cut in treble by means of a tone control would flatten curve 3. However, it is un-likely that the characteristics of the tone control would exactly match the slow, long treble rise of curve 3. Consequently, there would still be some unevenness of response.
The 3.75-ips speed is very popular for home use because it doubles the playing time of a reel of tape and at the same time affords a frequency response to approximately 7,500 hz, quite acceptable in many circumstances. As a result, some commercial prerecorded tapes are being offered at 3.75 ips. Although there is no unofficial or official NARTB standard at this speed, Ampex equalization is generally used by manufacturers of prerecorded tape as well as by some manufacturers of tape recorders. Ampex 3.75-ips equalization basically parallels the NARTB standard, except that the turnover frequency is reduced two octaves, al though there is only a 1-to-2 ratio between the 3.75-and 7.5-ips speeds.3 Therefore the 3.75-ips turnover frequency is 795 hz.
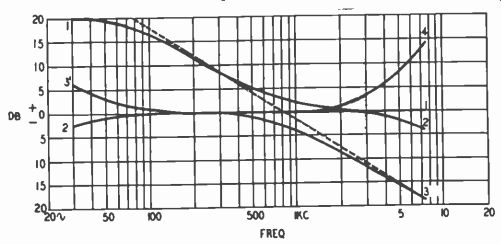
Fig. 611. Ampex equalization of a tape recorder operating at 3.75 ips.
/: Ampex bass boost; 2-2: equalized response; r-3. required record characteristic;
4: required treble boost to compensate treble record losses.
Ampex equalization of a tape recorder operating at 3.75 ips is depicted in Fig. 611. Curve 2-2 represents the equalized overall response, which is 2.5 db down at 30 hz as in the case of 7.5 ips, but 4 db down at 7,500 hz. Curve 1 is Ampex playback bass boost and curve 3'-3 the corresponding recorded flux characteristic. The required record treble boost is shown by curve 4.
----------
This tends to support those who feel that 3,180 hz is too high a turnover frequency at 7.5 ips. They claim that 15-ips NARTB equalization should be scaled down one octave whenever tape speed is cut in half. Thus, it is held, 7.5-ips equalization should have a turnover frequency at 1,590 hz and 3.75-ips equalization at 795 hz.
----------
Although the record losses compensated by curve 4 are not shown, these can be derived by subtracting curve 4 from curve 3.
It will be remembered from Fig. 609 that record treble boost rep-resents the difference between the required recorded flux and record losses. Finally, owing to the limited extent of playback-head losses over the audio range involved, no playback treble boost is incorporated.
Some recordings are still being made at 30 ips, and in this case the playback bass boost is sometimes a 6-db-per-octave slope throughout the audio range, except for a leveling off at the very low end. In other words, the turnover frequency for recorded flux may be outside the audio range at 30 ips. As for the 1.875-ips speed, which is sometimes used for reproduction of speech or music of limited quality, equalization patterns vary, but they may be assumed to resemble that of Fig. 611, but with still lower turnover frequencies.