In a world of limitless storage capacity and infinite bandwidth, digital signals could be coded without regard to file size, or the number of bits needed for transmission.
While such a world may some day be approximated, today there is a cost for storage and bandwidth. Thus, for many applications, it is either advantageous or mandated that audio signals be coded as bit-efficient as possible.
Accomplishing this task while preserving audio fidelity is the domain of low bit-rate coding. Two approaches are available. One approach uses perceptual coding to reduce file size while avoiding significant audible loss and degradation. The art and science of lossy coding combines the perceptual qualities of the human ear with the engineering realities of signal processing. A second approach uses lossless coding in which file size is compressed, but upon playback the original uncompressed file is restored. Because the restored file is bit-for-bit identical to the original, there is no change in audio fidelity.
However, lossless compression cannot achieve the same amount of data reduction as lossy methods. Both approaches can offer distinct advantages over traditional PCM coding.
This Section examines the theory of perceptual (lossy) coding, as well as the theory of lossless data compression.
In addition, ways to evaluate the audible quality of perceptual codecs are presented. Section 11 more fully explores the details of particular codecs, both lossy and lossless. The more specialized nature of speech coding is described in Section 12.
Perceptual Coding
Edison cylinders, like all analog formats, store acoustical waveforms with a mimicking pattern-an analog-of the original sonic waveform. Some digital media, such as the Compact Disc, do essentially the same thing, but replace the continuous mechanical pattern with a discrete series of numbers that represents the waveform's sampled amplitude. In both cases, the goal is to reconstruct a waveform that is physically identical to the original within the audio band. With perceptual (lossy) coding, physical identity is waived in favor of perceptual identity. Using a psychoacoustic model of the human auditory system, the codec (encoder-decoder) identifies imperceptible signal content (to remove irrelevancy) as bits are allocated. The signal is then coded efficiently (to avoid redundancy) in the final bitstream. These steps reduce the quantity of data needed to represent an audio signal but also increase quantization noise. However, much of the quantization noise can be shaped and hidden below signal-dependent thresholds of hearing. The method of lossy coding asks the conceptual question-how much noise can be introduced to the signal without becoming audible? Through psychoacoustics, we can understand how the ear perceives auditory information. A perceptual coding system strives to deliver all of perceived information, but no more. A perceptual coding system recognizes that sounds that are reproduced have the human ear as the intended receiver. A perceptual codec thus strives to match the sound to the receiver. Logically, the first step in designing such a codec is to understand how the human ear works.
Psychoacoustics
When you hear a plucked string, can you distinguish the fifth harmonic from the fundamental? How about the seventh harmonic? Can you tell the difference between a 1000-Hz and a 1002-Hz tone? You are probably adept at detecting this 0.2% difference. Have you ever heard "low pitch" in which complex tones seem to have a slightly lower subjective pitch than pure tones of the same frequency? All this and more is the realm of psychoacoustics, the study of human auditory perception, ranging from the biological design of the ear to the psychological interpretation of aural information. Sound is only an academic concept without our perception of it. Psychoacoustics explains the subjective response to everything we hear. It is the ultimate arbitrator in acoustic concerns because it is only our response to sound that fundamentally matters. Psychoacoustics seeks to reconcile acoustic stimuli and all the scientific, objective, and physical properties that surround them, with the physiological and psychological responses evoked by them.
The ear and its associated nervous system is an enormously complex, interactive system with incredible powers of perception. At the same time, even given its complexity, it has real limitations. The ear is astonishingly acute in its ability to detect a nuance or defect in a signal, but it is also surprisingly casual with some aspects of the signal. Thus the accuracy of many aspects of a coded signal can be very low, but the allowed degree of diminished accuracy is very frequency- and time dependent.
Arguably, our hearing is our most highly developed sense; in contrast, for example, the eye can only perceive frequencies over one octave. As with every sense, the ear is useful only when coupled to the interpretative powers of the brain. Those mental judgments form the basis for everything we experience from sound and music. The left and right ears do not differ physiologically in their capacity for detecting sound, but their respective right- and left-brain halves do. The two halves loosely divide the brain's functions. There is some overlap, but the primary connections from the ears to the brain halves are crossed; the right ear is wired to the left-brain half and the left ear to the right-brain half. The left cerebral hemisphere processes most speech (verbal) information. Thus, theoretically the right ear is perceptually superior for spoken words. On the other hand, it is mainly the right temporal lobe that processes melodic (nonverbal) information. Therefore, we may be better at perceiving melodies heard by the left ear.
Engineers are familiar with the physical measurements of an audio event, but psychoacoustics must also consider the perceptual measurements. Intensity is an objective physical measurement of magnitude. Loudness, first introduced by physicist Georg Heinrich Barkhausen, is the perceptual description of magnitude that depends on both intensity and frequency. Loudness cannot be empirically measured and instead is determined by listeners' judgments. Loudness can be expressed in loudness levels called phons. A phon is the intensity of an equally loud 1 kHz tone, expressed in dB SPL. Loudness can also be expressed in sones, which describe loudness ratios. One sone corresponds to the loudness of a 40 dB SPL sine tone at 1 kHz. A loudness of 2 sones corresponds to 50 dB SPL. Similarly, any doubling of loudness in sones results in a 10-dB increase in SPL. For example, a loudness ratio of 64 sones corresponds to 100 dB SPL.
The ear can accommodate a very wide dynamic range.
The threshold of feeling at 120 dB SPL has a sound intensity that is 1,000,000,000,000 times greater than that of the threshold of hearing at 0 dB SPL. The ear's sensitivity is remarkable; at 3 kHz, a threshold sound displaces the eardrum by a distance that is about one-tenth the diameter of a hydrogen atom. For convenience of expression, it is clear why the logarithmic decibel is used when dealing with the ear's extreme dynamic range. The ear is also fast; within 500 ms of hearing a maximum loudness sound, the ear is sensitive to a threshold sound.
Thus, whereas the eye only slowly adjusts its gain for different lighting levels and operates over a limited range at any time, the ear operates almost instantaneously over its full range. Moreover, whereas the eye can perceive an interruption to light that is 1/60 second, the ear may detect an interruption of 1/500 second.
Although the ear's dynamic range is vast, its sensitivity is frequency-dependent. Maximum sensitivity occurs at 1 kHz to 5 kHz, with relative insensitivity at low and high frequencies. This is because of the pressure transfer function that is an intrinsic part of the design of the middle ear. Through testing, equal-loudness contours such as the Robinson-Dadson curves have been derived, as shown in FIG. 1. Each contour describes a range of frequencies that are perceived to be equally loud. The lowest contour describes the minimum audible field, the minimum sound pressure level across the audible frequency band that a person with normal hearing can perceive. For example, a barely audible 30-Hz tone would be 60 dB louder than a barely audible 4-kHz tone. The response varies with respect to level; the louder the sounds, the flatter our loudness response. The contours are rated in phons, measuring the SPL of a contour at 1 kHz.
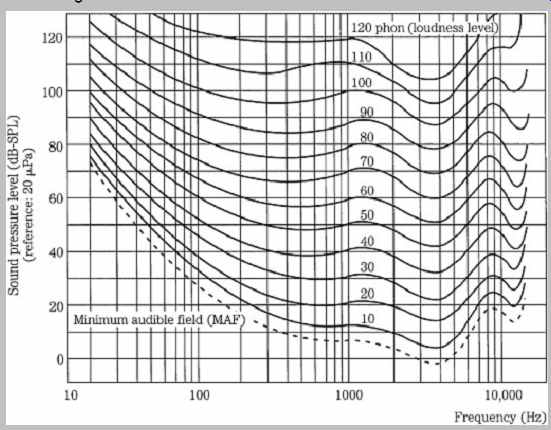
FIG. 1 The Robinson-Dadson equal-loudness contours show that the ear is nonlinear
with respect to frequency and level. These contours are based on psychoacoustic
studies, using sine tones. (Robinson and Dadson, 1956)
Frequency is a literal measurement. Pitch is a subjective, perceptual measure. Pitch is a complex characteristic based on frequency, as well as other physical quantities such as waveform and intensity. For example, if a 200-Hz sine wave is sounded at a soft then louder level, most listeners will agree that the louder sound has a lower pitch. In fact, a 10% increase in frequency might be necessary to maintain a listener's subjective evaluation of a constant pitch at low frequencies. On the other hand, in the ear's most sensitive region, 1 kHz to 5 kHz, there is almost no change in pitch with loudness. Also, with musical tones, the effect is much less. Looked at in another way, pitch, quite unlike frequency, is purely a musical characteristic that places sounds on a musical scale.
The ear's response to frequency is logarithmic; this can be demonstrated through its perception of musical intervals. For example, the interval between 100 Hz and 200 Hz is perceived as an octave, as is the interval between 1000 Hz and 2000 Hz. In linear terms, the second octave is much larger, yet the ear hears it as the same interval. For this reason, musical notation uses a logarithmic measuring scale. Each four and one-half spaces or lines on the musical staff represent an octave, which might be only a few tens of Hertz apart, or a few thousands, depending on the clef and ledger lines used.
Beat frequencies occur when two nearly equal frequencies are sounded together. The beat frequency is not present in the audio signal, but is an artifact of the ear's limited frequency resolution. When the difference in frequency between tones is itself an audible frequency, a difference tone can be heard. The effect is especially audible when the frequencies are high, the tones fairly loud, and separated by not much more than a fifth. Although debatable, some listeners claim to hear sum tones. An inter-tone can also occur, especially below 200 Hz where the ear's ability to discriminate between simultaneous tones diminishes. For example, simultaneous tones of 65 Hz and 98 Hz will be heard not as a perfect fifth, but as an 82-Hz tone. On the other hand, when tones below 500 Hz are heard one after the other, the ear can differentiate between pitches only 2 Hz apart.
The ear-brain is adept at determining the spatial location of sound sources, using a variety of techniques.
When sound originates from the side, the ear-brain uses cues such as intensity differences, waveform complexity, and time delays to determine the direction of origin. When equal sound is produced from two loudspeakers, instead of localizing sound from the left and right sources, the ear brain interprets sound coming from a space between the sources. Because each ear receives the same information, the sound is stubbornly decoded as coming from straight ahead. Similarly, stereo is nothing more than two different monaural channels. The rest is simply illusion.
There is probably no limit to the complexity of psychoacoustics. For example, consider the musical tones in FIG. 2A. A scale is played through headphones to the right and left ears. Most listeners hear the pattern in Fig. 2B, where the sequence of pitches is correct, but heard as two different melodies in contrary motion. The high tones appear to come from the right ear, and the lower tones from the left. When the headphones are reversed, the headphone formerly playing low tones now appears to play high tones, and vice versa. Other listeners might hear low tones to the right and high tones to the left, no matter which way the headphones are placed. Curiously, right-handed listeners tend to hear high tones on the right and lows on the left; not so with lefties. Still other listeners might perceive only high tones and little or nothing of the low tones. In this case, most right-handed listeners perceive all the tones, but only half of the lefties do so.
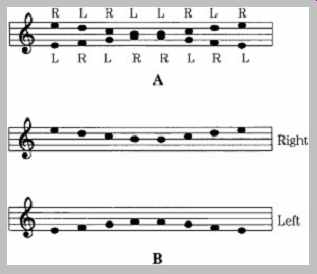
FIG. 2 When a sequence of two-channel tones is presented to a listener, perception
might depend on handedness. A. Tones presented to listener. B. Iusion most
commonly perceived. (Deutsch, 1983)
The ear perceives only a portion of the information in an audio signal; that perceived portion is the perceptual entropy-estimated to be as low as 1.5 bits/sample. Small entropy signals can be efficiently reduced; large entropy signals cannot. For this reason, a codec might output a variable bit rate that is low when information is poor, and high when information is rich. The output is variable because although the sampling rate of the signal is constant, the entropy in its waveform is not. Using psychoacoustics, irrelevant portions of a signal can be removed; this is known as data reduction. The original signal cannot be reconstructed exactly. A data reduction system reduces entropy; by modeling the perceptual entropy, only irrelevant information is removed, hence the reduction can be inaudible. A perceptual music codec does not attempt to model the music source (a difficult or impossible task for music coding); instead, the music signal is tailored according to the receiver, the human ear, using a psychoacoustic model to identify irrelevant and redundant content in the audio signal. In contrast, some speech codecs use a model of the source, the vocal tract, to estimate speech characteristics, as described in Section 12.
Traditionally, audio system designers have used objective parameters as their design goals-flat frequency response, minimal measured noise, and so on. Designers of perceptual codecs recognize that the final receiver is the human auditory system. Following the lead of psychoacoustics, they use the ear's own performance as the design criterion. After all, any musical experience- whether created, conveyed, and reproduced via analog or digital means-is purely subjective.
Physiology of the Human Ear and Critical Bands
The ear uses a complex combination of mechanical and neurological processes to accomplish its task. In particular, the ear performs the transformation from acoustical energy to mechanical energy and ultimately to the electrical impulses sent to the brain, where information contained in sound is perceived. A simplified look at the human ear's physiological design is shown in FIG. 3. The outer ear collects sound, and its intricate folds help us to assess directionality. The ear canal resonates at around 3 kHz to 4 kHz, providing extra sensitivity in the frequency range that is critical for speech intelligibility. The eardrum transduces acoustical energy into mechanical energy; it reaches maximum excursion at about 120-dB SPL, above which it begins to distort the waveform. The three bones in the middle ear, colloquially known as the hammer, anvil, and stirrup (the three smallest bones in the body) provide impedance matching to efficiently convey sounds in air to the fluid-filled inner ear. The vestibular canals do not affect hearing, but instead are part of a motion detection system providing a sense of balance. The coiled basilar membrane detects the amplitude and frequency of sound;
those vibrations are converted to electrical impulses and sent to the brain as neural information along a bundle of nerve fibers. The brain decodes the period of the stimulus and point of maximum stimulation along the basilar membrane to determine frequency; activity in local regions surrounding the stimulus is ignored.
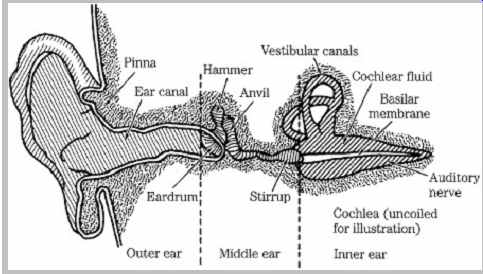
FIG. 3 A simplified look at the physiology of the human ear. The coiled cochlea
and basilar membrane are straightened for clarity of illustration.
Examination of the basilar membrane shows that the ear contains roughly 30,000 hair cells arranged in multiple rows along the basilar membrane, roughly 32 mm long; this is the Organ of Corti. The cells detect local vibrations of the basilar membrane and convey audio information to the brain via electrical impulses. The decomposition of complex sounds into constituent components is analogous to Fourier analysis and is known as tonotopicity. Frequency discrimination dictates that at low frequencies, tones a few Hertz apart can be distinguished; however, at high frequencies, tones must differ by hundreds of Hertz. In any case, hair cells respond to the strongest stimulation in their local region; this region is called a critical band, a concept introduced by Harvey Fletcher in 1940.
Fletcher's experiments showed that, for example, when noise masks a pure tone, only frequency components of the noise that are near the frequency of the tone are relevant in masking the tone. Energy outside the band is inconsequential. This frequency range of relevancy is the critical band. Critical bands are much narrower at low frequencies than at high frequencies; three-fourths of the critical bands are below 5 kHz; in terms of masking, the ear receives more information from low frequencies and less from high frequencies. When critical bandwidths are plotted with respect to critical-band center frequency, critical bandwidths are approximately constant from 0 Hz to 500 Hz, and then approximately proportional to frequency from about 500 Hz upward, as shown in FIG. 4. In other words, at higher frequencies, critical bandwidth increases approximately linearly as the center frequency increases logarithmically.
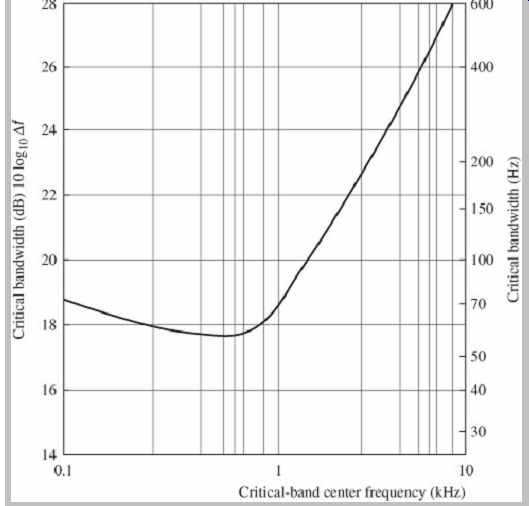
FIG. 4 A plot showing critical bandwidths for monaural listening. (Goldberg
and Riek, 2000)
Critical bands are approximately 100 Hz wide for frequencies from 20 Hz to 500 Hz and approximately 1.5 octaves in width for frequencies from 1 kHz to 7 kHz.
Alternatively, bands can be assumed to be 1.3 octaves wide for frequencies from 300 Hz to 20 kHz; an error of less than 1.5 dB will occur. Other research shows that critical bandwidth can be approximated with the equation:
Critical bandwidth = 25 + 75[1 + 1.4(f /1000) 2] 0.69 Hz
where f = center frequency in Hz.
The ear was modeled by Eberhard Zwicker with 24 arbitrary critical bands for frequencies below 15 kHz; a 25th band occupies the region from 15 kHz to 20 kHz. An example of critical band placement and width is listed in Table 10.1. Physiologically, each critical band occupies a length of about 1.3 mm, with 1300 primary hair cells. The critical band for a 1-kHz sine tone is about 160 Hz in width.
Thus, a noise or error signal that is 160 Hz wide and centered at 1 kHz is audible only if it is greater than the same level of a 1-kHz sine tone. Critical bands describe a filtering process in the ear; they describe a system that is analogous to a spectrum analyzer showing the response patterns of overlapping bandpass filters with variable center frequencies. Importantly, critical bands are not fixed; they are continuously variable in frequency, and any audible tone will create a critical band centered on it. The critical band concept is an empirical phenomenon. Looked at in another way, a critical band is the bandwidth at which subjective responses change. For example, if a band of noise is played at a constant sound-pressure level, its loudness will be constant as its bandwidth is increased. But as its bandwidth exceeds that of a critical band, the loudness increases.
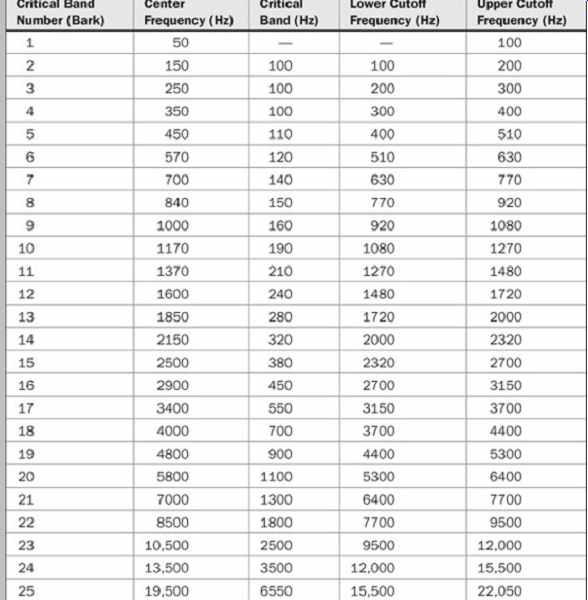
TABLE 10.1 An example of critical bands in the human hearing range showing
an increase in bandwidth with absolute frequency. A critical band will arise
at an audible sound at any frequency. (after Tobias, 1970)
Most perceptual codecs rely on amplitude masking within critical bands to reduce quantized word lengths.
Masking is the essential trick used to perceptually hide coding noise. Indeed, in the same way that Nyquist is honored for his famous sampling frequency relationship, modern perceptual codecs could be called "Fletcher codecs." Interestingly, critical bands have also been used to explain consonance and dissonance. Tone intervals with a frequency difference greater than a critical band are generally more consonant; intervals less than a critical band tend to be dissonant with intervals of about 0.2 critical bandwidth being most dissonant. Dissonance tends to increase at low frequencies; for example, musicians tend to avoid thirds at low frequencies. Psychoacousticians also note that critical bands play a role in the perception of pitch, loudness, phase, speech intelligibility, and other perceptual matters.
The Bark (named after Barkhausen) is a unit of perceptual frequency. Specifically, a Bark measures the critical-band rate. A critical band has a width of 1 Bark; 1/100 of a Bark equals 1 mel. The Bark scale relates absolute frequency (in Hertz) to perceptually measured frequencies such as pitch or critical bands (in Bark).
Conversion from frequency to Bark can be accomplished with:
z(f) = 13arctan(0.00076f) + 3.5arctan[(f/7500) 2] Bark where f = frequency in Hz.
Using a Bark scale, the physical spectrum can be converted to a psychological spectrum along the basilar membrane. In this way, a pure tone (a single spectral line) can be represented as a psychological-masking curve.
When critical bands are plotted using a Bark scale, they are relatively consistent with frequency, verifying that the Bark is a "natural" unit that presents the ear's response more accurately than linear or logarithmic plots. However, the shape of masking curves still varies with respect to level, showing more asymmetric slopes at louder levels.
Some researchers prefer to characterize auditory filter shapes in terms of an equivalent rectangular bandwidth (ERB) scale. The ERB represents the bandwidth of a rectangular function that conveys the same power as a critical band. The ERB scale portrays auditory filters somewhat differently than the critical bandwidth representation. For example, ERB argues that auditory filter bandwidths do not remain constant below 500 Hz, but instead decrease at lower frequencies; this would require greater low-frequency resolution in a codec. In one experiment, the ERB was modeled as:
ERB = 24.7[4.37(f/1000)+ 1] Hz
where f = center frequency in Hz.
The pitch place theory further explains the action of the basilar membrane in terms of a frequency-to-place transformation. Carried by the surrounding fluid, a sound wave travels the length of the membrane and creates peak vibration at particular places along the length of the membrane. The collective stimulation of the membrane is analyzed by the brain, and frequency content is perceived.
High frequencies cause peak response at the membrane near the middle ear, while low frequencies cause peak response at the far end. For example, a 500-Hz tone would create a peak response at about three-fourths of the distance along the membrane. Because hair cells tend to vibrate at the frequency of the strongest stimulation, they will convey that frequency in a critical band, ignoring lesser stimulation. This excitation curve is described by the cochlear spreading function, an asymmetrical contour. This explains, for example, why broadband measurements cannot describe threshold phenomena, which are based on local frequency conditions. There are about 620 degrees of differentiable frequencies equally distributed along the basilar membrane; thus, a resolution of 1.25 Bark is reasonable. Summarizing, critical bands are important in perceptual coding because they show that the ear discriminates between energy in the band, and energy outside the band. In particular, this promotes masking.
Threshold of Hearing and Masking
Two fundamental phenomena that govern human hearing are the minimum-hearing threshold and amplitude masking, as shown in FIG. 5. The threshold of hearing curve describes the minimum level (0 sone) at which the ear can detect a tone at a given frequency. The threshold is referenced to 0 dB at 1 kHz. The ear is most sensitive in the 1-kHz to 5-kHz range, where we can hear signals several decibels below the 0-dB reference. Generally, two tones of equal power and different frequency will not sound equally loud. Similarly, the audibility of noise and distortion varies according to frequency. Sensitivity decreases at high and low frequencies. For example, a 20-Hz tone would have to be approximately 70 dB louder than a 1-kHz tone to be barely audible. A perceptual codec compares the input signal to the minimum threshold, and discards signals that fall below the threshold; the signals are irrelevant because the ear cannot hear them. Likewise, a codec can safely place quantization noise under the threshold because it will not be heard. The absolute threshold of hearing is determined by human testing, and describes the energy in a pure tone needed for audibility in a noiseless environment. The contour can be approximated by the equation:
T(f) = 3.64(f/1000)-0.8 - 6.5e-0.6[(f/1000)-3.3] 2 + 10-3(f/1000) 4 dB SPL
where f = frequency in Hz.
This threshold is absolute, but a music recording can be played at loud or soft levels-a variable not known at the time of encoding. To account for this variation, many codecs conservatively equate the decoder's lowest output level to a 0-dB level or alternatively to the -4-dB minimum point of the threshold curve, near 4 kHz. In other words, the ideal (lowest) quantization error level is calibrated to the lowest audible level. Conversely, this corresponds to a maximum value of about 96 dB SPL for a 16-bit PCM signal. Some standards refer to the curve as the threshold of quiet.
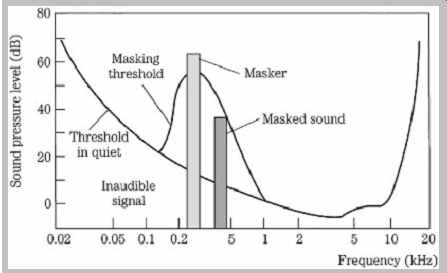
FIG. 5 The threshold of hearing describes the softest sounds audible across
the human hearing range. A masker tone or noise will raise the threshold of
hearing in a local region, creating a masking curve. Masked tones or noise,
perhaps otherwise audible, that fall below the masking curve during that time
will not be audible.
When tones are sounded simultaneously, amplitude masking occurs in which louder tones can completely obscure softer tones. For example, it is difficult to carry on a conversation in a nightclub; the loud music masks the sound of speech. More analytically, for example, a loud 800-Hz tone can mask softer tones of 700 Hz and 900 Hz.
Amplitude masking shifts the threshold curve upward in a frequency region surrounding the tone. The masking threshold describes the level where a tone is barely audible. In other words, the physical presence of sound certainly does not ensure audibility and conversely can ensure inaudibility of other sound. The strong sound is called the masker and the softer sound is called the maskee. Masking theory argues that the softer tone is just detectable when its energy equals the energy of the part of the louder masking signal in the critical band; this is a linear relationship with respect to amplitude. Generally, depending on relative amplitude, soft (but otherwise audible) audio tones are masked by louder tones at a similar frequency (within 100 Hz at low frequencies). A perceptual codec can take advantage of masking; the music signal to be coded can mask a relatively high level of quantization noise, provided that the noise falls within the same critical band as the masking music signal and occurs at the same time.
The mechanics of the basilar membrane explain the phenomenon of amplitude masking. A loud response at one place on the membrane will mask softer responses in the critical band around it. Unless the activity from another tone rises above the masking threshold, it will be swamped by the masker. FIG. 6A shows four masking curves (tones masked by narrow-band noise) at 60 dB SPL, on a logarithmic scale in Hertz. FIG. 6B shows seven masking curves on a Bark scale; using this natural scale, the consistency of the critical-band rate is apparent.
Moreover, this plot illustrates the position of critical bands along the basilar membrane.
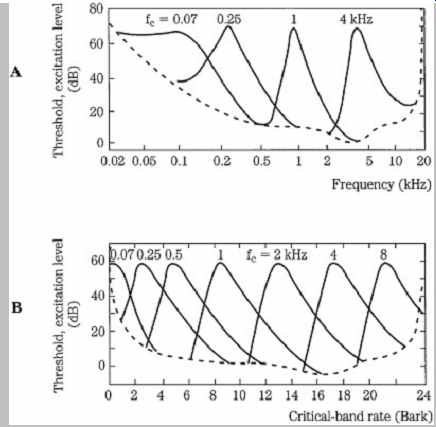
FIG. 6 Masking curves describe the threshold where a tone or noise is just
audible in the presence of a masker.
Threshold width varies with frequency when plotted logarithmically. When plotted on a Bark scale, the widths and slopes are similar, reflecting response along the basilar membrane. A. Masking thresholds plotted with logarithmic frequency. B. Masking thresholds plotted with critical-band rate. (Zwicker and Zwicker, 1991)
Masking thresholds are sometimes expressed as an excitation level; this is obtained by adding a 2-dB to 6-dB masking index to the sound pressure level of the just audible tone. Low frequencies can interfere with the perception of higher frequencies. Masking can overlap adjacent critical bands when a signal is loud, or contains harmonics; for example, a complex 1-kHz signal can mask a simple 2-kHz signal. Low amplitude signals provide little masking. Narrow-band tones such as sine tones also provide relatively little masking. Likewise, louder, more complex tones provide greater masking with masking curves that are broadened, and with a greater high frequency extension.
Amplitude-masking curves are asymmetrical. The slope of the threshold curve is less steep on the high-frequency side. Thus it is relatively easy for a low tone to mask a higher tone, but the reverse is more difficult. Specifically, in a simple approximation, the lower slope is about 27 dB/Bark; the upper slope varies from -20 dB/Bark to -5 dB/Bark depending on the amplitude of the masker. More detailed approximations use spreading functions as described in the discussion of psychoacoustic models below. Low-level maskers influence a relatively narrow band of masked frequencies. However, as the sound level of the masker increases, the threshold curve broadens, and in particular its upper slope decreases; its lower slope remains relatively unaffected. FIG. 7 shows a series of masking curves produced by a narrow band of noise centered at 1 kHz, sounded at different amplitudes. Clearly, the ear is most discriminating with low-amplitude signals.
Many masking curves have been derived from studies in which either single tones or narrow bands of noise are used as the masker stimulus. Generally, single-tone maskers produce dips in the masking curve near the tone due to beat interference between the masker and maskee tones. Narrow noise bands do not show this effect. In addition, tone maskers seem to extend high-frequency masking thresholds more readily than noise maskers. It is generally agreed that these differences are artifacts of the test itself. Tests with wideband noise show that only the frequency components of the masker that lie in the critical band of the maskee are effective at masking.
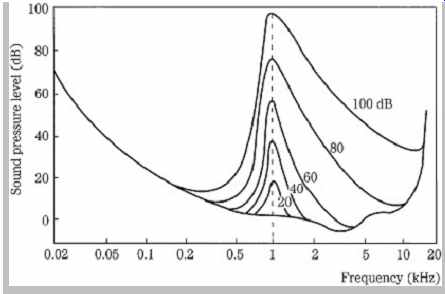
FIG. 7 Masking thresholds vary with respect to sound pressure level. This
test uses a narrow-band masker noise centered at 1 kHz. The lower slope remains
essentially unchanged.
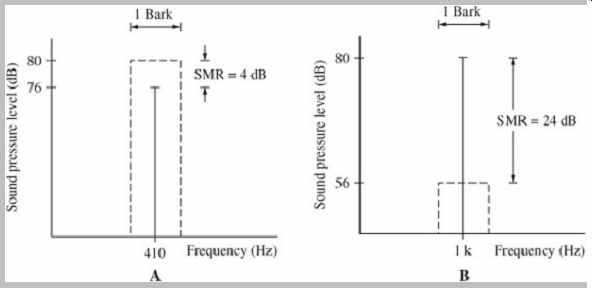
FIG. 8 Noise maskers have more masking power than tonal maskers. A. In NMT,
a noise masker can mask a centered tone with an SMR of only 4 dB. B. In TMN,
a tonal masker can mask centered noise with an SMR of 24 dB.
The SMR increases as the tone or noise moves off the center frequency. In each case, the width of the noise band is one critical bandwidth.
As noted, many masking studies use noise to mask a tone to study the condition called noise-masking-tone (NMT). In perceptual coding, we are often more concerned with quantization noise that must be masked by either a tonal or non-tonal (noise-like) audio signal. The conditions of tone-masking-noise (TMN) and noise-masking-noise (NMN) are thus more pertinent. Generally, in noise masking-tone studies, when the masker and maskee are centered, a tone is inaudible when it is about 4 dB below a 1/3-octave masking noise in a critical band. Conversely, in tone-masking-noise studies, when a 1/3-octave band of noise is masked by a pure tone, the noise must be 21 dB to 28 dB below the tone. This suggests that it is 17 dB to 24 dB harder to mask noise. The two cases are illustrated in FIG. 8. NMN generally follows TMN conditions; in one NMN study, the maskee was found to be about 26 dB below the masker. The difference between the level of the masking signal and the level of the masked signal is called the signal-to-mask ratio (SMR); for example, in NMT studies, the SMR is about 4 dB. Higher values for SMR denote less masking. SMR is discussed in more detail below.
Relatively little scientific study has been done with music as the masking stimulus. However, it is generally agreed that music can be considered as relatively tonal or nontonal (noise-like) and these characterizations are used in psychoacoustic models for music coding. The determination of tonal and nontonal components is important because, as noted above, the masking abilities are quite different and this greatly affects coding. In addition, sine-tone masking data is generally used in masking models because it provides the least (worst case) masking of noise; complex tones provide greater masking.
Clearly, one musical sound can mask another, but future work in the mechanics of music masking will result in better masking algorithms.
Temporal Masking
Amplitude masking assumes that tones are sounded simultaneously. Temporal masking occurs when tones are sounded close in time, but not simultaneously. A signal can be masked by a noise (or another signal) that occurs later.
This is pre-masking (sometimes called backward masking). In addition, a signal can be masked by a noise (or another signal) that ends before the signal begins. This is post-masking (sometimes called forward masking). In other words, a louder masker tone appearing just after (pre-masking), or before (post-masking) a softer tone overcomes the softer tone. Just as simultaneous amplitude masking increases as frequency differences are reduced, temporal masking increases as time differences are reduced. Given an 80-dB tone, there may be 40 dB of post masking within 20 ms and 0 dB of masking at 200 ms. Pre masking can provide 60 dB of masking for 1 ms and 0 dB at 25 ms. This is shown in FIG. 9. The duration of pre masking has not been shown to be affected by the duration of the masker. The envelope of post-masking decays more quickly as the duration of the masker decreases or as its intensity decreases. In addition, a tone is better post masked by an earlier tone when they are close in frequency or when the earlier tone is lower in frequency; post-masking is slight when the masker has a higher frequency. Logically, simultaneous amplitude masking is stronger than either temporal pre- or post-masking because the sounds occur at the same time.
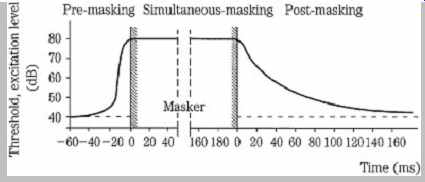
FIG. 9 Temporal masking occurs before and, in particular, after a masker
sounds; the threshold decreases with time. The dashed line indicates the threshold
for a test tone impulse without a masker signal.
Temporal masking suggests that the brain integrates the perception of sound over a period of time (perhaps 200 ms) and processes the information in bursts at the auditory cortex. Alternatively, perhaps the brain prioritizes loud sounds over soft sounds, or perhaps loud sounds require longer integration times. Whatever the mechanism, temporal masking is important in frequency domain coding.
These codecs have limited time resolution because they operate on blocks of samples, thus spreading quantization error over time. Temporal masking can help overcome audibility of the artifact (called pre-echo) caused by a transient signal that lasts a short time while the quantization noise may occupy an entire coding block. Ideally, filter banks should provide a time resolution of 2 ms to 4 ms.
Acting together, amplitude and temporal masking form a contour that can be mapped in the time-frequency domain, as shown in FIG. 10. Sounds falling under that contour will be masked. It is the obligation of perceptual codecs to identify this contour for changing signal conditions and code the signal appropriately.
Although a maskee signal exists acoustically, it does not exist perceptually. It might seem quite radical, but aural masking is as real as visual masking. Lay your hand over this page. Can you see the page through your hand? Aural masking is just as effective.
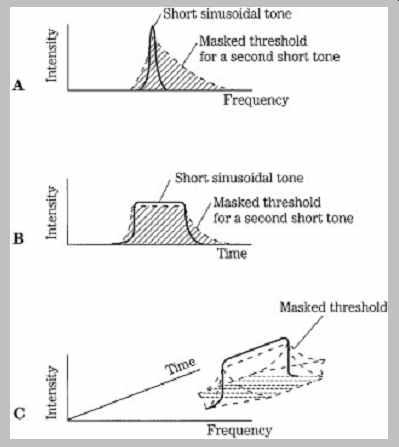
FIG. 10 When simultaneous and temporal masking are combined, a time-frequency
contour results. A perceptual codec must place quantization noise and other
artifacts within this contour to ensure inaudibility.
A. Simultaneous masking.
B. Temporal masking.
C. Combined masking effect in time and frequency.
Next>>