The introduction of the Compact Disc (CD) system was perhaps the most remarkable development in audio technology since the birth of audio recording technology in 1877 with Edison's invention of the tinfoil recorder. The Compact Disc system contains numerous technologies original to the audio field; when combined, these technologies formed a storage means that was unprecedented at its invention.
A Compact Disc contains digitally encoded data that is read by a laser beam. Because the reflective data layer is embedded within the disc, dust and fingerprints on the reading surface do not normally affect reproduction. The effect of most errors can be minimized by error-correction algorithms. Because no stylus touches the disc surface, there is no disc wear, no matter how often the disc is played. Thus, digital storage, error correction, and disc longevity result in a robust digital storage medium. In addition, the CD offers high-density data storage providing long playing time with a small disc size. Whereas the (analog) Edison cylinder stored the equivalent of 100 bits/mm^2, the CD stores about 1 million bits/mm^2. Above all, the CD established a new fidelity standard that was unprecedented for the consumer with flat frequency response and low distortion. In addition, the CD is highly effective for storing other types of data beyond digital music. But as impressive as the CD is, it is surpassed by its optical disc successors, the Super Audio CD, DVD, and Blu-ray formats.
Development
The chronology of events in the development of the Compact Disc spans almost a decade from inception to introduction. Even then, the development of optical disc storage predates the CD by several more decades. The CD incorporates many technologies pioneered by many individuals and corporations; however, Philips Corporation of The Netherlands and Sony Corporation of Japan must be credited with its primary development. Optical disc technology developed by Philips and error-correction techniques developed by Sony, when merged, resulted in the successful CD format. The original standard established by these two companies guarantees that discs and players made by different manufacturers are compatible. The CD-Audio or CD-DA (Compact Disc Digital Audio) format is sometimes called the Red Book standard (after the color of the notebook used to hold the original specification); it was formalized in 1980. In 1987, it was subsequently also specified in the IEC 908 standard (International Electrotechnical Commission) available from the American National Standards Institute (ANSI).
Philips began working on optical disc storage of images in 1969. It first announced the technique of storing audio material optically in 1972. Analog modulation methods used for video storage were deemed unsuitable, and the possibility of digital signal encoding was examined.
Furthermore, Philips established laser readout and small disc diameter as a design prerequisite. Sony, similarly had explored the possibility of an optical, large-diameter audio disc, and had extensively researched the error-processing and channel-coding requirements for a practical realization of the system. Other manufacturers such as Mitsubishi, Hitachi, Matsushita, JVC, Sanyo, Toshiba, and Pioneer advanced proposals for a digital audio disc. By 1977, numerous manufacturers had shown prototype optical disc audio players. In 1978, Philips and Sony designated disc characteristics, signal format, and error-correction methods; and in 1979 they reached an agreement in principle to collaborate (with design meetings from August 1979 through May 1980) with decisions on signal format and disc material. In June 1980, they jointly proposed the Compact Disc Digital Audio system, which was subsequently adopted by the Digital Audio Disc Committee, a group representing more than 25 manufacturers.
Following the development of a semiconductor laser pickup and LSI (large-scale integration) circuits for signal processing and digital-to-analog conversion, the Compact Disc system was introduced in October of 1982 in Japan and Europe. In March 1983, the Compact Disc was made available in the United States. Over 350,000 players and 5.5 million discs were sold worldwide in 1983, and 900,000 players and 17 million discs in 1984, making the CD one of the most successful electronic product launches ever.
Starting with the original CD-Audio format, the CD family was expanded to include CD-ROM (1984), CD-i (1986), CD-WO (1988), Video-CD (1994), and CD-RW (1996) with a host of applications in data, audio, and video. The SACD, introduced in 1999, incorporates aspects of the CD.
Overview
The Compact Disc is an efficient information storage system. An audio disc stores a stereo audio signal comprising two 16-bit data words sampled at 44.1 kHz; thus, 1.41 million bits per second (Mbps) of audio data are output from the player along with other nonaudio data.
Altogether, the channel bit rate, the rate at which data is read from the disc, is 4.3218 Mbps. A disc containing an hour of music thus holds about 15.5 billion channel bits-a respectable capacity for a disc that costs a few cents to manufacture. Apart from overhead (33% for error correction, 7% for synchronization, and 4% for control and display), a CD-Audio disc holds a maximum of 6.3 billion bits, or 783 million bytes of user information.
A standard Compact Disc measures 12cm in diameter and has a maximum playing time of 74 minutes, 33 seconds. By varying the CD standards slightly, longer playing times can be achieved. For example, a track pitch of 1.5 m and a linear velocity of 1.2 m/s would yield a playing time of about 82 minutes.
Information is contained in a pit track impressed into one side of the disc's plastic substrate. The substrate is made of polycarbonate plastic (also used for eyeglass lenses). The data surface is metallized to reflect the laser beam used to read the data from underneath the disc. A pit is about 0.6 µm wide (it is worth remembering that a micrometer [1 micron] equals 1-millionth of a meter, or about 40 millionths of an inch) and a disc might hold about 2 billion pits. If a disc were enlarged so that its pits were the size of grains of rice, the disc would be half a mile in diameter. Along the track, each pit edge represents a binary 1; flat areas between pits or areas within pits are decoded as binary 0s. Data is read from the disc as a change in intensity of reflected laser light. Reading a CD causes no more wear to the recording than your reading causes to the words printed on this page (also conveyed to your eyes via reflected light).
The pits are aligned in a spiral track running from the inside radius of the disc to the outside. CDs with maximum playing times contain data to within 3 mm of the outer disc edge. CDs with shorter playing times have an unused area at the outer edge. This allows a greater manufacturing yield because errors tend to increase at the outer radius, and the disc is oblivious to fingerprints on the empty outer radius. If unwound, a CD track would run for about 3.5 miles. The pitch (distance between adjacent track revolutions) of the CD spiral is nominally 1.6 µm. There are 22,188 track revolutions across the disc's signal surface of 35.5 mm.
The period at the end of this sentence would cover more than 200 tracks.
Data is retrieved with an optical pickup. A laser beam is emitted and is guided through optics to the disc data surface. The reflected light is detected by the pickup, and the data from the disc conveyed on the beam is converted to an electrical signal. Because nothing touches the disc except light, light itself and electrical servo circuits are used to keep the laser beam properly focused on the disc surface and properly aligned with the spiral track. The pits are encoded with eight-to-fourteen modulation (EFM) for greater storage density and Cross-Interleave Reed-Solomon code (CIRC) for error correction; algorithms in players provide demodulation and error correction. When the audio data has been properly recovered from the disc and converted into a binary signal, it is input to digital oversampling filters and digital-to-analog converters to reconstruct the analog signal.
Music CDs deliver high-fidelity sound with excellent performance specifications. With 16-bit quantization sampled at 44.1 kHz, players typically exhibit a frequency response of 5 Hz to 20 kHz with a deviation of 0.2 dB.
Dynamic range exceeds 100 dB, signal-to-noise ratio exceeds 100 dB, and channel separation exceeds 100 dB at 1 kHz. Harmonic distortion at 1 kHz is typically less than 0.002%. Rotational speed deviation is limited to the tolerances of quartz accuracy, which is essentially unmeasurable. With digital filtering, phase shift is less than 0.5°. D/A converters provide linearity to within 0.5 dB at -90 dB. Excluding unreasonable abuse, a disc will remain in satisfactory playing condition indefinitely, as the medium does not significantly age. Electrical measurements of CD players may be carried out with a variety of techniques, such as those described in the AES17 specification.
One might reasonably ask why 44.1 kHz was selected as the sampling frequency for the Compact Disc.
Professional video recorders were originally used to prepare CD master tapes because they were the only recorders capable of handling the high bandwidth requirements of digital audio signals. Because 16-bit digital audio signals (and error correction) were encoded as a video signal, the sampling frequency had to relate to television standards' line and field rate, storing a few samples per scan line. The NTSC (National Television Systems Committee) format used 525 lines in 30 frames per second; only 490 are available for storage. With two samples per line, 490 × 30 × 2 = 29.4 kHz, a too-low sampling frequency. With four samples per line, 490 × 30 × 4 = 58.8 kHz, was considered too high. With three samples per line, 490 × 30 × 3 = 44.1 kHz-it is just right. Moreover, the PAL/SECAM (phase-alteration line/sequential-and memory) format used 625 lines (588 active lines) in 25 frames per second, and 588 × 25 × 3 = 44.1 kHz as well.
Therefore, 44.1 kHz became the universal sampling frequency for CD master tapes. Because sampling frequency conversion was difficult, and 44.1 kHz was appropriate, the same sampling frequency was used for finished discs.
Disc Design
The CD provides reasonable data density using a combination of the optical design of the disc and the method of coding the data impressed on it. For example, the wavelength of the reading laser and numerical aperture of the objective lens are selected to achieve a small spot size. This allows small pit/land dimensions. In addition, the pit/land track uses a constant linear velocity, and that velocity is set low, to increase the track's linear data density. Also, EFM is used to encode the stored data.
Although it creates more channel bits to be stored, the net result is a 25% increase in audio data capacity.
Disc Optical Specification
The Red Book specifies both the physical and logical characteristics of a Compact Disc. The physical characteristics of a CD are shown in FIG. 1. Disc diameter is 120 mm, center hole diameter is 15 mm, and disc thickness is 1.2 mm. The innermost part of the disc does not hold data; it provides a clamping area for the player to hold the disc firmly to the spindle motor shaft.
Data is recorded on an area that is 35.5 mm wide. A lead in area rings the innermost data area, and a lead-out area rings the outermost area. The lead-in and lead-out areas contain nonaudio data used to control the player.

FIG. 1 Physical specification of the Compact Disc showing disc dimensions
and the relief structure of data pits.

FIG. 2 Data pits are aligned along a spiral track. The laser spot on the
data surface has a diameter of approximately 1.0 µm (half-intensity level of
the Airy pattern), covering the 0.6-µm pit width.
A transparent plastic substrate forms most of a disc's 1.2-mm thickness. Data is physically contained in pits that are impressed along its top surface and are covered with a very thin (50 nm to 100 nm) metal (typically aluminum) layer.
Another thin (10 µm to 30 µm) plastic layer protects the metallized pit surface, on top of which the identifying label (5 µm) is printed.
The laser beam used to read data operates at a wavelength of 780 nm. The beam is applied from below the disc and passes through the transparent substrate and back again. The velocity of light decreases when it passes from air to the substrate. The substrate has a refractive index of 1.55 (as opposed to 1.0 for air); the velocity of light slows from 3 × 10^5 km/s to 1.9 × 10^5 km/s. When the velocity of light slows, the beam refracts, and focusing occurs. Because of the wavelength of the laser light, refractive index, thickness of the disc, and numerical aperture of the laser lens, the approximately 800-µm diameter of the laser beam on the disc surface is focused to a spot measuring approximately 1.0 µm in diameter (Airy pattern half-intensity level) at the pit surface. The CD is diffraction-limited; that is, the choices of the wavelength of the laser light and numerical aperture of the lens will not permit a smaller spot size.
The laser beam is thus focused to a spot that is slightly larger than the 0.6-micron pit width, as shown in FIG. 2.
The effects of dust or scratches on the substrate's outer surface are minimized because their size at the data surface is effectively reduced along with the laser beam.
Specifically, any obstruction less than 0.5 mm is insignificant and causes no error in the readout. On the other hand, because the disc substrate is part of the playback optics, its optical quality, in terms of birefringence and thickness, must be specified. In addition, because of the relatively large distance between the objective lens and the data surface, disc tilt can cause an error in refraction angle.
Data is physically stored as a phase structure, a metallized surface comprising pits and land. In theory, when the beam strikes the land between pits, virtually all of its light is reflected, and when it strikes a pit, virtually all of its light is canceled, so that virtually none is reflected. As noted in Section 6, complete destructive interference in the reflected beam results when the pit depth is such that the intensity of light reflected from a pit equals the intensity of light reflected from the surrounding land, as shown in FIG. 3. Specifically, the phase difference forms a diffraction pattern in the reflected light; this causes destructive interference in the main reflected beam. A pit thus reduces the intensity of the reflected light returning to the objective lens. A plane wave model suggests that pit height should be /4 where is the apparent wavelength of light. The model predicts that a pit height equal to /4 creates a phase difference of /2 (1/4 + 1/4 wave-length path differences) between the part of the beam reflected from the pit and the part reflected from the surrounding land. However, a more complex spherical wave model that accounts for effects of the converging focused beam predicts that the optimum pit depth should be /2.

FIG. 3 The laser spot reads data as an intensity modulation of its reflected
beam. The phase structure of the data surface places the pit height above the
land surface; this creates destructive interference in the reflected beam.
In either case, destructive interference causes an absence of reflected light when there is a pit, distinguishing it from the almost total reflection when the spot strikes the land between pits. In practice, a balance must be made between the data readout advantages of zero reflected pit light, and the reflected intensity that is conducive for signal tracking which requires a /8 pit depth for most pickups. In fact, the specifications for both pit depth and width are a compromise among several factors including optimal high frequency readout signal, optimal radial tracking signal, and allowance for mass replication. For example, the readout signal should provide good contrast between pit and land areas, but for tracking, the reflected light should not be completely extinguished during a long pit. Moreover, pit geometry must allow the disc to be released from the mold. In practice, pits are made shallower than the theoretically optimal figure and the laser spot is larger than is required for complete cancellation between pit and land reflections. Most CD pressing plants use a pit depth that is approximately one-quarter of the laser's wavelength in the substrate. The laser beam's wavelength in air is 780 nm.
Inside the polycarbonate substrate, with a refractive index of 1.55, the laser's wavelength is about 500 nm. Generally, the pit depth may be between 0.11 and 0.13 µm. A long pit causes about 25% of the power of the incident light to be reflected. The reflective flat land typically causes 90% of the laser light to be reflected. When viewed from the laser's perspective (underneath), the pits appear as bumps. In any case, the presence of pits and land is thus read by the laser beam; specifically, the disc surface modulates the intensity of the light beam. Thus, the data that is physically encoded on the disc can be recovered by the laser and then converted to an electrical signal.
Examination of a pit track reveals that the linear dimensions of the track are the same at the beginning of its spiral as at the end. Specifically, a CD rotates with constant linear velocity (CLV), a condition in which a uniform relative velocity is maintained between the disc and the pickup.
CLV allows high data density, but necessitates more complex mechanics and also dictates slower access times.
The player must adjust the disc's rotational speed to maintain a constant velocity as the spiral radius changes.
Because the disc plays from the inner radius to the outer, and each outer track revolution contains more pits than each inner track revolution, the disc rotation must slow down as it plays. When the pickup is reading the inner circumference, the disc rotates at a speed of about 539 rpm (revolutions per minute), and as the pickup moves outward, the rotational speed gradually decreases to about 210 rpm. Thus a constant linear velocity is maintained along the pit track. Moreover, with CLV, the spindle motor must be able to change speed quickly, for example, when a user skips from track 1 at the inner radius to track 12 at the outer.
In other words, all the pits are read at the same speed, regardless of the circumference of that part of the spiral.
This is accomplished by a CLV servo system; the player reads frame synchronization words from the data and adjusts the disc speed to maintain a constant data rate.
Although the CLV of any particular CD is fixed, the CLVs used on different discs can range from 1.2 to 1.4 m/s. In general, discs with playing times of less than 60 minutes are recorded at 1.4 m/s, and discs with longer playing times use a slower velocity, to a minimum of 1.2 m/s. The CD player is indifferent to the actual CLV; it automatically regulates the disc rotational speed to maintain a constant channel bit rate of 4.3218 MHz.
Data Encoding
The channel bits, the data physically encoded on the disc, are the end product of a coding process accomplished prior to disc mastering, and then decoded as a disc is played. Whether the original is an analog or digital recording, the audio program is represented as 16-bit pulse-code modulation (PCM) data. The data stream must undergo CIRC error correction encoding and eight-to fourteen modulation (EFM), and subcode and synchronization words must be incorporated as well.
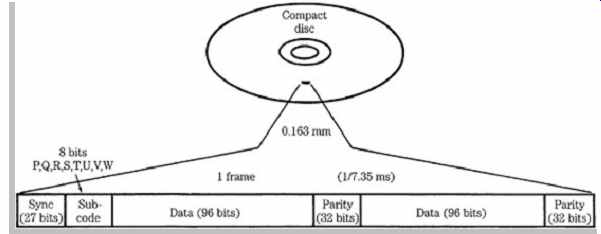
FIG. 4 Elements of a CD frame shown without EFM modulation and interleaving.
All data except the synchronization word undergo EFM modulation to create a
total of 588 channel bits.
All data on a CD is formatted with frames. By definition, a frame is the smallest complete section of recognizable data on a disc. The frame provides a means to distinguish between audio data and its parity, the synchronization word and the subcode. Frame construction prior to EFM coding is shown in FIG. 4. All the required data is placed into the frame format during encoding. The end result of encoding and modulation is a series of frames, each frame consisting of 588 channel bits.
To begin assembly of a frame, six 32-bit PCM audio sampling periods (alternating between left and right channels) are grouped in a frame. This places 192 audio bits in the frame. The 32-bit sampling periods are divided to yield four 8-bit audio symbols. To scatter possible errors, the symbols from different frames are interleaved so that the audio signals in one frame originate from different frames. In addition, eight 8-bit parity symbols are generated per frame, four in the middle of the frame and four at the end. The interleaving and generation of parity bits constitute the error correction encoding based on the Cross-Interleave Reed-Solomon Code (CIRC). CIRC is discussed in Section 5.
One subcode symbol is added per frame; two of these subcode bits (P and Q) contain information detailing the total number of selections on the disc, their beginning and ending points, index points within a selection, and other information. Six of these subcode bits (R, S, T, U, V, and W) are available for other applications, such as encoding text or graphics information on audio CDs. After the audio, parity, and subcode data is assembled, this data is modulated using EFM. This gives the bitstream specific patterns of 1s and 0s, thus defining the lengths of pits and lands to facilitate optical reading of the disc. EFM permits a high number of channel bit transitions for arbitrary pit and land lengths. This increases data density and helps facilitate control of the spindle motor speed. To accomplish EFM, blocks of 8 data bits are translated into blocks of 14 channel bits using a dictionary that assigns an arbitrary and unambiguous word of 14 channel bits to each 8-bit word. The 8-bit symbols require 2^8 = 256 unique patterns, and of the possible 2^14 = 16,384 patterns in the 14-bit system, 267 meet the pattern requirements; therefore, 256 are used and 11 discarded. A portion of the conversion table is shown in Table 1. EFM is discussed in Section 3.
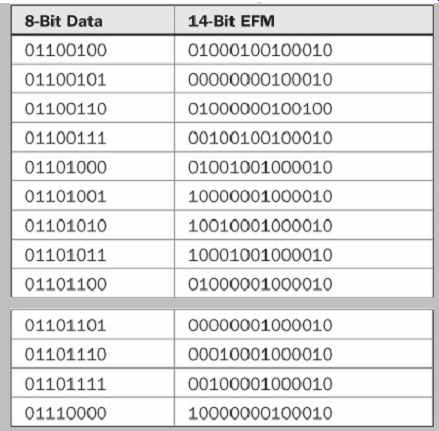
TABLE 1 Excerpt from the EFM conversion table. Data bits are translated
into channel bits.
Blocks of 14 channel bits are linked by three merging bits. With the addition of merging bits, the ratio of bits before and after modulation is 8:17. The merging bits maintain the proper run length between words, suppress dc content, and aid clock synchronization. Successive EFM words cannot simply be concatenated; this might violate the run length of the code by placing binary 1s closer than 3 periods, or further than 11 periods. To prevent the former, a 0-merging bit is used, and the latter is prevented with a 1 merging bit. Two merging bits are sufficient to maintain proper run length. A third merging bit is used to more effectively control low-frequency content of the output signal.
A 1 can be used to invert the signal and minimize accumulating dc offset in the signal's polarity. This is monitored by the digital sum value (DSV); it tallies the number of 1s by adding a +1 to its count, and the number of 0s by adding a -1. The Red Book uses a simple one symbol look-ahead strategy when choosing a DSV merging bit. An example of a merging bit determination, observing run length and DSV criteria, is shown in FIG. 5.
Low-frequency content must be avoided because it can interfere with the operation of tracking and focusing servos that operate at low frequencies (below 20 kHz); in addition, low-frequency signals such as from fingerprints on the disc can be filtered out without affecting the data signal itself.
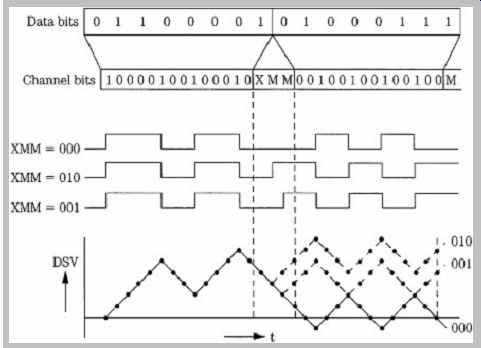
FIG. 5 An example of merging-bit determination. With this data sequence,
the first merging bit is set to 0 to satisfy EFM run-length rules; the two
remaining bits are set to 00 to minimize DSV. (Heemskerk and Schouhamer Immink,
1982)

FIG. 6 The complete collection of pit (and land) lengths created by EFM
modulation ranges from 3T to 11T.
Minimum pit length is 0.833 µm to 0.972 µm; maximum pit length is 3.054 µm to 3.56 µm, depending on velocity (1.2 m/s to 1.4 m/s).

FIG. 7 Each 8-bit half-sample undergoes EFM modulation, three merging
bits concatenate 14-bit words, the NRZ representation is converted to NRZI
, and transitions are represented as pit edges on the disc.
The channel stream produces pits and lands that are at least 2 but no more than 10 successive 0s long. The EFM pit/land family portrait is shown in FIG. 6. This collection of pit/land lengths encodes all user data contained on a CD.
These pit/land lengths are described as 3T, 4T, 5T, …, 11T with T referring to the period of one channel bit. The signal is sometimes called the 3T-11T signal. Physically, pit and land lengths vary incrementally from 0.833 µm to 3.054 µm at a track velocity of 1.2 m/s, and from 0.972 µm to 3.56 µm at a velocity of 1.4 m/s.
The 3T-11T signal represents EFM channel bits on the CD surface. This is accomplished by coding the channel bits as nonreturn to zero (NRZ), and then as nonreturn to zero inverted (NRZI ) data. Each logical transition in the NRZI stream represents a pit edge, as shown in FIG. 7.
The code is invertible; pits and lands represent channel bits equally; inversions caused by merging bits do not affect the data content. When the signal is decoded, the merging bits are discarded. After EFM, there are more channel bits to accommodate, but acceptable pit and land patterns become available. With this modulation, the highest frequency in the signal is decreased; therefore, a lower track velocity can be utilized. One important benefit is conservation of disc real estate.

FIG. 8 The algorithm used in the CD encoding process.
Subcode and parity are added to the audio data, the data undergoes interleaving and modulation, and a synchronization word is added. (Heemskerk and Schouhamer Immink, 1982)
The resulting EFM data must be delineated, so a synchronization word is placed at the beginning of each frame. The synchronization word is uniquely identifiable from any other data configuration. Specifically, the 24 channel bit synchronization word is 100000000001000000000010 plus three merging bits.
With the synchronization word, the player can identify the start of data frames. A complete frame contains one 24-bit synchronization word, 14 channel bits of subcode, 24 words of 14 channel bit audio data, eight words of 14 channel bit parity, and 102 merging bits, for a total of 588 channel bits per frame. Because each 588-bit frame contains twelve 16-bit audio samples, the result is 49 channel bits per audio sample. Thus when the data manipulation is completed, the original audio bit rate of 1.41 million bits per second is augmented to 4.3218 million channel bits per second. This resulting channel bitstream is physically stored on the disc. The entire encoding process is summarized in FIG. 8.
A finished CD must contain a lead-in area, program area, and a 90-second lead-out area of silence. The program area holds from 1 to 99 tracks. In addition, each track can contain up to 100 time markers called index points.

FIG. 9 The optical elements in a three-beam laser pickup.
Player Optical Design
The function of a Compact Disc player is to recover the data encoded on discs. That task begins at the laser pickup used to read data. In addition, automatic optical tracking and focusing systems must be used. Players generally use either three-beam or one-beam pickup designs. We will consider the more common three-beam design first.
Optical Pickup
The data is recovered from a Compact Disc with an optical pickup, which moves across the surface of the rotating disc. A disc might contain 2 billion pits precisely arranged on a spiral track; the optical pickup must focus, track, and read that data track with submicron precision. The entire lens structure, laser source, and reader must be small enough to move laterally underneath the disc surface, moving in response to linear tracking information or user random access track programming. Although particulars vary among manufacturers, pickups are similar in design and operation. A three-beam optical pickup contains a laser diode, diffraction grating, polarization beam splitter, quarter-wave plate, and several lens systems, as shown in FIG. 9.
A semiconductor laser is used as the light source. Laser light is monochromatic; the optical system is designed for one wavelength and this minimizes chromatic aberrations.
Laser light is coherent and can be focused to a small spot.
It also yields a concise interference pattern, and can be manipulated via polarization. The laser beam originates from a laser diode. A CD pickup uses a semiconductor laser with approximately a 5-mW (milliwatt) optical output irradiating a coherent AlGaAs beam with a 780-nm wavelength to yield a spot power on the disc of about 0.5 mW. The light emitting properties of semiconductors have been utilized for many years. By adding forward bias to a PN junction, the injected part of the carrier is recombined to emit light; light-emitting diodes (LEDs) use this phenomenon. However, laser light is significantly different from ordinary light in that it comprises a single wavelength and is coherent with respect to phase. Thus, a modified device is required.
The injection laser diode used in CD players uses a double heterojunction structure. It contains a thin (perhaps 0.1 µm) active layer of GaAs semiconductor, sandwiched between heavily doped P- and N-type AlGaAs materials, sometimes called cladding layers. Forward bias creates a high concentration of electrons (from the N layer) and holes (from the P layer) in the active layer. An inverted population condition is created with many electrons in a high-energy state band and many holes in a low-energy band. Electrons fall to a lower energy band, releasing a photon; this reaches equilibrium with the input energy pumping rate. Stimulated light emission is thus induced. However, the light must be amplified, so several steps are taken. Both sides of the activating layer are sandwiched within materials with a large band gap to enclose the carrier, and the refraction ratio at both boundaries of the activating layer is different to provide enclosure. Also, for amplification within the layer, the crystal surface in the direction of the light emission is made reflective, and acts as a light resonator for continuous wave emission. A monitor photodiode is placed next to the laser diode to control power to the laser, compensating for temperature changes. The monitor diode conducts current proportionally to the laser's light output. If the monitor diode's current output is low with respect to a reference, current to the laser's drive transistors is increased to increase the laser's light output. Similarly, if the monitor current is too high, supply current to the laser is decreased to compensate. The laser diodes used in CD players have a very long life expectancy, from hundreds of thousands, to millions of operating hours.
In a three-beam pickup, the light from the laser point source passes through a diffraction grating. This is a screen with slits spaced only a few laser wavelengths apart.
As the beam passes through the grating, it diffracts at different angles. When the resulting collection is again focused, it appears as a bright center beam with successively less intense beams on either side. In a three beam pickup design, the center beam is used for reading data and focusing, and two secondary beams, the first order beams, are used for tracking.
A polarization beam splitter (PBS) directs laser light to the disc surface, then angles the reflecting light to the photodiode. For incident light approaching the polarization beam splitter, it acts as a transparent window, but for reflected light with a rotated plane of polarization, it acts as a prism redirecting the beam. The PBS comprises two orthogonal prisms with a common face with a dielectric membrane between them. A collimator lens follows the PBS (in some designs it precedes it). Its purpose is to take the divergent light rays and make them parallel. The light then passes through a quarter-wave plate (QWP), a crystal material with anisotropic properties of double refraction. It rotates the plane of polarization of the incident and reflected laser light; plane of polarization is rotated 45° as light passes through the plate, and then rotates another 45° as reflected light returns through it. The reflected light is thus polarized in a plane at a right angle relative to that of the incident light, thus allowing the PBS to properly deflect the reflected light.
The final piece of optics in the light path to the disc is the objective lens with a numerical aperture of 0.45. It is used to focus the beam to about 1.0 µm (half-intensity level) at the reflective surface, somewhat wider than the pit width of 0.6 µm. The objective lens is attached to a two-axis actuator and servo system for up/down focusing motion and lateral tracking motion.
As noted, when the spot strikes a land interval between two pits, the light is almost totally reflected. When it strikes a pit (a bump from the reading side), a lower-intensity light is returned. Ultimately, a change in intensity is deciphered as a 1 and unchanged intensity as 0. The varying intensity light returns through the objective lens, the QWP (to further rotate plane of polarization), and the collimator lens, and strikes the angled surface of the PBS. The light is deflected and passes through a collective lens and cylindrical lens.
These optics are used to direct the operation of the focusing servo system to keep the objective lens at the proper depth of focus. The beam's main function, however, is to carry the data via reflected light to a four-quadrant photodiode. The electrical signals derived from that device are ultimately decoded into an audio waveform.
Autofocus Design
Nothing except laser light touches the data surface. That poses the engineering challenge of focusing on the pit surface and tracking the spiral pit sequence with nothing tangible to guide the pickup. To properly distinguish between pits and land, the laser beam must rely on interference in the reflected beam created by the height of the bumps, a 110-nm difference. The focus of the beam on the data surface is therefore critical; an unfocused condition might result in inaccurate or lost data.
Specifically, the laser must stay focused within ±0.5 µm. A disc can contain deviations approaching ±0.4 mm. Thus, the objective lens must be able to refocus as the disc surface deviates. This is accomplished with a servo-driven autofocus system, which utilizes the center laser beam, a four-quadrant photodiode, control electronics, and a servo motor to move the objective lens. An operational diagram of the autofocus system is shown in FIG. 10.

FIG. 10 Astigmatism produced by a cylindrical lens is used to create a
correction signal in an autofocus pickup. A. The main beam passes through a
cylindrical lens; the image distorts and rotates relative to path length. B.
Astigmatism creates an asymmetrical optical pattern because of path-length
errors. C. A four-quadrant photodiode converts the optical pattern into an
autofocus correction signal. D. The autofocus signal represents disc position
and controls a servo to dynamically maintain focus.
Many methods have been devised to maintain focus on the pit track. In many pickups, the optical property of astigmatism is used to achieve autofocus. An astigmatic cylindrical lens has two different focal lengths and this performs the essential trick needed to detect an out-of focus condition. As the distance between the objective lens and the reflective disc surface varies, the focal point of the system changes, and the image projected by the cylindrical lens changes shape. The change in the image on the photodiode is used to generate the focus correction signal.
When the disc surface lies at the focal point of the objective lens, the reflected image through the intermediate convex lens and the cylindrical lens is unaffected by the astigmatism of the cylindrical lens, and a circular spot strikes the center of the photodiode. When the distance between the disc and the objective lens decreases, the focal points of the objective lens, convex lens, and cylindrical lens move farther from the cylindrical lens, and the pattern becomes elliptical. Similarly, when the distance between the disc and the objective lens increases, the focal points are closer to the lens, and an elliptical pattern again results, but rotated 90° from the first elliptical pattern.
A four-quadrant photodiode reads an intensity level from each of the quadrants to generate four voltages. The value (A + B + C + D) creates an audio data signal. If a focus correction signal is mathematically created to be (A + C) - (B + D), the output error voltage is a bipolar S curve, centered around zero. Its value is zero when the beam is precisely focused on the disc; a positive-going focus correction signal is generated as the disc moves away, and a negative-going signal is generated as the disc moves closer. Using a closed-loop system, the difference signal continually corrects the mechanism to achieve a zero difference signal, and hence a properly focused laser beam.
A servo system moves the objective lens up and down, to maintain a depth of focus within tolerance. A circuit deciphers the focus correction signal and generates a servo control voltage, which in turn controls the actuator to move the objective lens. The objective lens is displaced in the direction of its optical axis by a coil and a permanent magnet structure; it is similar to that used in a loudspeaker except that the objective lens takes the place of the speaker cone. A two-axis actuator incorporates these elements. The top assembly of the pickup is mounted on a base with a circular magnet ringing it. A circular yoke supports a bobbin with both the focus and tracking coils inside. Control voltages from the focus drive circuit are applied to the bobbin focus coil; this moves up and down with respect to the magnet. The objective lens thus maintains its proper depth of focus. The other axis of movement, from side to side, is used to maintain tracking.
Autotracking Design
An autotracking system is used to track the spiral pit sequence. The spiral pit track has a 1.6-µm pitch. An off center disc might exhibit track eccentricity of over 100 µm.
Vibration can further challenge the pickup's ability to track within a ±0.1-µm tolerance. A laser beam system is appropriately used for tracking; any purely mechanical tracking system would be inordinately costly. Many different autotracking methods have been devised. In a three-beam pickup, a design that is widely used, the center beam is split by a diffraction grating to create a series of secondary beams of diminishing intensity. The first-order beams are conveyed to the disc surface along with the central beam.
The central beam spot covers the pit track, while the two tracking beams are aligned above and below, and offset to either side of the center beam. During proper tracking, part of each tracking beam illuminates a pit, while the other part illuminates the land between pit tracks. The three beams are reflected back through the QWP and PBS; the main beam strikes the four-quadrant photodiode and the two tracking beams strike two separate photodiodes mounted to either side of the main photodiode. The complete photodiode assembly for data reading, tracking, and focusing is shown in FIG. 11.

FIG. 11 The four-quadrant photodiode (A, B, C, D) is used for autofocus
and data playback. Photodiodes E and F are used for autotracking.

FIG. 12 A tracking-correction signal is generated from an intensity imbalance
in the two secondary beams. A servo system dynamically maintains tracking.
A. Left mistracking (F < E). B. Correct tracking (F = E). C. Right mistracking
(F > E).
If the three spots drift to either side of the pit track, the amount of light reflected from the tracking beams varies as one of the beams encounters more pit area; this results in less average light intensity. Meanwhile, the other beam encounters less pit area, returning greater reflected intensity. The relative voltage outputs from the two tracking photodiodes thus form a correction signal, as shown in FIG. 12. If tracking is precisely aligned, the difference between the tracking signals is zero. If the beams drift, a difference signal is generated, for example, varying positively for a left drift and negatively for a right drift, to create a tracking correction signal. That signal is applied to the two-axis actuator assembly containing the permanent magnet and focus/tracking coil. To correct for a tracking error, the correction voltage is applied to the coil; the bobbin swings around a shaft to laterally move the objective lens so that the main laser spot is again centered, and the tracking correction signal is again zeroed.


FIG. 13 Design and operation of a one-beam optical pickup. A. The reflected
beam is split by a wedge lens and directed to four photodiodes. B. Tracking
is accomplished using intensity asymmetry in the beam. C. Focusing is maintained
using the angle of deflection between the split beams.
One-Beam Pickup
The optical components of a one-beam pickup are shown in FIG. 13A, along with the photodiode array used to generate tracking and focusing signals, and read the data signal. A semi-transparent mirror is used to direct light from the laser diode to the disc surface. Light reflected from the disc passes through the mirror and is directed through a wedge lens. The wedge lens splits the beam into two beams, adjusted to strike an array of four horizontally arranged photodiodes. The outputs of all the photodiodes are summed to provide the data signal (D1 + D2 + D3 + D4), which is demodulated to yield both audio data and control signals for the laser servo system.
Autotracking uses a push-pull technique. A symmetrical beam is reflected when the laser spot is centered on the pit track. If the laser beam deviates from the pit track, interference creates intensity asymmetry in the beam. This results in an intensity difference between the split beams. If the beam is off track, one side of the beam encounters more pit area; hence, greater interference occurs on that side of the beam, and reflected light is less intense there, as shown in FIG. 13B. As a result, the split beam derived from that side of the beam is less intense, and the photodiode's output is decreased. The difference between the pairs (D1 + D2) - (D3 + D4) is used to generate an error signal to correct the pickup's tracking.
The intensity of the reflected beam could become asymmetrical from dirt in the optical system. This would create an offset in the tracking-correction signal, causing the pickup to remain slightly off track. To prevent this, a second tracking-error signal is generated. A low-frequency (for example, 600 Hz) signal is applied to the tracking servo. This signal modulates the output signal from the four photodiodes. If the pickup mistracks, a deviation occurs in the modulated signal. This signal is rectified and used to correct the primary tracking signal with a direct voltage. In this way, the effect of an offset is negated.
Auto-focusing uses a Foucault technique. As shown in FIG. 13C, when correct focus is achieved, two images are centered between photodiode pairs. When focus varies, the focal point of the system is shifted. When the disc is too far, the split beams draw together; when the disc is too near, the beams move apart. The difference in intensity between diode pairs D1/D4 and D2/D3 forms a focus error signal (D1 + D4) - (D2 + D3) that maintains focus of the servo-driven objective lens.
Pickup Control
A motor must precisely move the pickup across the disc surface to track the entire pit spiral. The pickup must also be able to jump from one location on the disc to another, find the desired location on the spiral, and resume tracking.
These functions are handled by separate circuits using control signals. Three-beam pickups are mounted on a sled that moves radially across the disc surface. Linear motors are used to position the pickup according to user commands, and bring the pickup within capture range of the autotracking circuit. Most one-beam pickups are mounted on a pivoting arm, which describes an arc across the disc surface. A coil and a magnet are placed around the pivot point of the arm. When the coil is energized, the pickup can be positioned anywhere across the pit track and its precise position corrected by the autotracking circuit. In both three- and one-beam designs, tracking in a CD player is similar to that of an analog LP record player.
In the same way that a record groove pulls the stylus across an LP record, the autotracking system pulls the pickup across a CD, keeping the pickup on track.
For fast forward or reverse, a microprocessor assumes control of the tracking servo to provide faster motion than is possible during normal tracking. When the correct location is reached, the S curve generated by the tracking correction signal is referenced to a microprocessor- generated control signal, and a signal signifies that proper tracking alignment is imminent. Just prior to alignment, a brake pulse is generated to compensate for the inertia of the pickup. The actuator comes to rest on the correct track, and normal autotracking is resumed.
The reflectivity of discs can vary because of manufacturing process differences, soiling of the player optics, and so on. It is important to maintain a constant voltage level for proper data recovery; thus, the gain of the output control amplifier is variable, depending on the intensity of the reflected laser beam. This gain adjustment is automatically accomplished during the initial reading of the disc table of contents and is maintained while the disc is played. This occurs under control of a microprocessor.
For example, the amplifier's gain might be varied by ±10 dB. A control signal from the detection circuit can alert the focus servo system to defective or damaged discs. In severe cases, the objective lens is pulled away from the disc to prevent damage to the pickup.
Player Electrical Design
A CD player's task of reproducing the audio signal requires demodulation and error-correction processing, as well as digital filtering and D/A conversion. Only then is the data recovered from the disc suitable for playback. In addition, controls and displays are required to interface the player with the human user. To simplify operation, and control the many subsystems, players incorporate one or more microprocessors in their design. A block diagram of a CD player is shown in FIG. 14.
EFM Demodulation
The voltage from the central photodiode array is output as an electrical data signal. This data signal resembles a sinusoid and is a radio-frequency (RF) signal. The RF signal represents the EFM code and thus contains the data stored on the disc. A collection of EFM waveforms is called the eye pattern, and is shown in FIG. 15. The eye pattern is always present whenever a player is tracking data, and the quality of the signal can be observed from the pattern.
The RF signal is also used to maintain proper CLV-rotation velocity of the disc. The RF signal is first amplified, and applied to a phase-locked loop to establish the correct timebase and read a valid data signal. The data signal is encoded with EFM, which specifies that the signal be composed of not less than 2 or more than 10 successive 0s between 0/1 or 1/0 transitions. This results in nine different incremental pit lengths from 3 channel bits long to 11 channel bits long. The shortest pit/land length of 3T describes a 720-kHz signal and the longest length of 11T describes a 196-kHz signal (at 1.2 m/s). The large range of pit/land lengths, a range of nearly 400% of the smallest length, allows a substantial tolerance for jitter error (50 ns) during data playback.

FIG. 14 A CD player's architecture, showing optical processing and output
signal processing.

FIG. 15 The modulated EFM data is read from the disc as an RF signal.
The RF signal can be monitored through an eye pattern by simultaneously displaying
successive waveform transitions. (Bouw huis et al., 1985)

FIG. 16 The RF signal contains all the audio and nonaudio data placed
on the disc. The data is recovered by reading the EFM words in the eye pattern.

FIG. 17 Demodulation of the EFM eye pattern signal permits recovery of
synchronization, subcode, audio, and error-correction data.
The information contained in the eye pattern is shown in FIG. 16. Although this signal is comprised of sinusoids, it contains digital information. It undergoes processing to convert it into an NRZI signal, in which the preceding polarity is reversed whenever there is a binary 1. This does not affect the encoded data because the width of the EFM periods holds the pertinent values. The NRZI signal is further converted to NRZ.
Frame synchronization words that were added to each frame during encoding are extracted from the NRZ signal.
They are used to synchronize the 33 symbols of channel data in each frame. Merging bits are discarded, and the individual channel bits are used to generate a synchronization pulse. The EFM code is demodulated so that every 14-bit EFM word is converted to 8 bits.
Demodulation is accomplished by logic circuitry or a lookup table, using the recorded data to reference back to the original patterns of eight bits. The process from eye pattern to demodulated data is summarized in FIG. 17.
During decoding, data is applied to a buffer memory.
Disc rotational irregularities might make data input irregular, but clocking ensures that the buffer output is precise. In addition, the buffer can also be used for data de-interleaving. To guarantee that the buffer neither overflows nor underflows, a synchronization control signal controls the disc rotation velocity. By varying the rate of data from the disc, the buffer level is properly maintained.
Timebase correction is discussed in Section 4.
Error Detection and Correction
Following demodulation, data is sent to a Cross-Interleave Reed-Solomon Code (CIRC) algorithm for error detection and correction. Any error on a disc, for example, a 6T pit misinterpreted as a 7T pit, requires correction. The CIRC error correction decoding strategy uses a combination of two Reed-Solomon code decoders, C1 and C2. The CIRC is based on the use of parity bits and interleaving of the digital audio samples. Depending on implementation, CIRC can enable complete correction of burst errors up to 3874 bits (a 2.5-mm section of pit track). In practice, physical disc damage that would exceed the power of the error-correction algorithm usually causes laser mistracking anyway.
Theoretically, the raw bit-error rate (BER) on a CD is between 10^-5 and 10^-6; that is, there is one incorrect bit for every 10^5 (100,000) to 10^6 (1 million) bits on a disc.
Following CIRC error correction, the BER is reduced to 10^-10 or 10^-11, or less than one bad bit in 10 billion to 100 billion bits. In practice, because of the high data density, even a mildly defective disc can exhibit a much higher BER. As discussed in Section 5, data is corrected through two CIRC decoders, C1 and C2. The C1 decoder corrects minor errors and flags uncorrectable errors. The C2 decoder corrects larger errors, aided by the error flags.
Uncorrected errors leaving C2 are flagged as well. Error correction flags generated from the CIRC algorithm during CD playback can represent the error rate (from sources such as poor pit geometry and uneven reflectivity) present on a disc.
If the CIRC decoder cannot correct all errors, it outputs the data symbols uncorrected (the parity symbols have been dropped), but marked with an erasure flag. Most of these symbols can be reconstructed with linear interpolation, using the combination of error flags to aid interpolation. The function of these error concealment circuits is to reduce such errors to inaudibility. Only uncorrected symbols, marked with erasure flags, are processed. All valid audio data passes through the concealment circuitry unaffected, except in the case of data surrounding a mute point, which is attenuated to minimize audibility of the mute. Concealment methods vary according to the degree of error encountered, and from player to player. In its simplest form, when a single sample is flagged between two correct samples, mean value interpolation is used to replace the erroneous sample. For longer consecutive errors, the last valid sample value is held, then the mean value is taken between the final held value and the next sample value. The system might permit recovery through adjacent sample interpolation of losses of up to 13,282 bits (8.7-mm track length).
If large numbers of adjacent samples are flagged, the concealment circuitry performs muting on one or more CD frames (1/75 second each). A number of previous valid samples (perhaps 30) are gradually attenuated with a cosine function to avoid the introduction of high-frequency components. Gain is kept at zero for the duration of the error, and then gain is gradually restored. Errors that escape the CIRC decoder without being flagged are not detected by the concealment circuitry, and therefore do not undergo concealment and may produce an audible click in the audio reproduction. Not all CD players are alike in error correction. Any CD player's error correction ability is determined by the success of the strategy devised to decode the CIRC, as well as the concealment algorithm.
The AES28 standard describes a method to estimate the life expectancy of CDs (excluding recordable media) based on the effects of temperature and humidity. In AES28, block-error rate (BLER) is the measured response and the end-of-life criterion is a 10-second average of maximum BLER of 220. The ISO/IEC 10149 and ANSI /NAPM IT9.21-1996 standards also specify this error count.
Output Processing
Following error correction, the digital data is processed to recover subcode information. During encoding, eight bits of subcode information per frame are placed in the bit stream. During decoding, subcode data from 98 frames is read and grouped together to form one block, then assigned eight different channels to provide control and (optionally) text or other information.
Output anti-imaging filtering is accomplished in the digital domain with oversampling filters. In oversampling, data is de-multiplexed into left and right channels, and applied to an FIR transversal filter. Through interpolation, additional samples are inserted between disc samples, thus raising the sampling rate. An eight-times rate is common. As a result of oversampling, the output image spectra are raised to the corresponding multiple of the sampling frequency. When shifted to this higher frequency range, they can be easily removed by a low-order analog filter, free of phase distortion. Oversampling filters are discussed in Section 4. Following this processing, the data is converted into a format appropriate for the type of D/A converter used in the player. In most CD players, sigma delta D/A converters are used, as described in Section 18.
Subcode
Each demodulated CD frame contains eight subcode bits, containing information describing where tracks begin and end, track numbers, disc timing, index points, and other parameters. The player uses the subcode bits to interpret the information on the disc, and facilitate user control of the player in accessing disc contents.
The eight subcode bits in every frame are designated as P, Q, R, S, T, U, V, and W as shown in FIG. 18A. Only the P and Q subcode bits are defined in the CD-Audio format.
(There is no relation to the P and Q codes in CIRC.) A subcode block is constructed sequentially from 98 successive frames. Thus the eight subcode bits (P through W) are used as eight different channels, with each frame containing 1 P bit, 1 Q bit, and so on. This interleaving minimizes the effect of disc errors on subcode data. The subcode block rate can be determined: a CD codes 44,100 left and right 16-bit audio samples per second, so the 8-bit byte rate is 44,100 × 4, or 176.4 kbytes per second. With 24 audio symbols in every frame, the frame rate is 176.4/24 or 7350 Hz. Because 98 frames form one subcode block, the subcode block rate is 7350/98 or 75 Hz; that is, 75 subcode blocks per second. Parenthetically, 7350 frames per second multiplied by the number of channel bits, 588, results in 4.3218 MHz, the overall channel bit rate.
A subcode block is complete with its own synchronization word, instruction, data, commands, and parity. The start of each subcode block is denoted by the presence of S0 and S1 synchronization bits in the first symbol positions of two successive blocks. On most audio discs, only the P and Q subcode channels contain information; the others are recorded with 0s.

FIG. 18 The data structure of the CD subcode block, showing detail of
the Q subcode channel. A. Mode 1 has provisions for a lead-in and program format.
B. Mode 2 format stores UPC codes. C. Mode 3 format stores ISRC code.

FIG. 19 An example of the program information contained in the P and Q
subcode channels across a disc surface.
The P channel contains a flag bit. It designates the start of a track, as well as the lead-in and lead-out areas on a disc, as shown in FIG. 19. The music data is denoted by 0, and the start flag as 1. The length of a start flag is a minimum of 2 seconds, but equals the pause length between two tracks if this length exceeds 2 seconds. Lead in and lead-out signals tell the player where the music program on the disc begins and ends. A lead-in signal consists of all 0s appearing just prior to the beginning of the music data. At the end of the lead-in, a start flag that is 2- to 3-seconds long appears just prior to the start of music.
During the last music track, preceding the lead-out, a start flag of 2 to 3 seconds appears. The end of that flag designates the start of the lead-out and the flag remains at 0 for 2 to 3 seconds. Following that time, a signal consisting of alternating 1s and 0s (at a 2-Hz rate) appears.
These signals could be used by players of basic design to control the optical pickup. For example, a player could count start flags placed in the blank interval between tracks to locate any particular track on a disc. In practice, players use only the more sophisticated Q code.
The Q channel (see FIG. 18) contains four basic kinds of information: control, address, Q data, and an error detection code. The control information (four bits) handles several player functions. The number of audio channels (2 or 4) is indicated; this distinguishes between two- and four channel CD recordings (the latter was never implemented).
The digital copy (permit/deny) bit regulates the ability of other digital recorders to record the CD's data digitally.
Pre-emphasis (on/off) is also coded. When indicated, the player reads the code and switches to the de-emphasis circuit.
The address information consists of four bits designating the three modes for the Q data bits. Primarily, Mode 1 contains number and start times of tracks, Mode 2 contains a catalog number, and Mode 3 contains the International Standard Recording Code (ISRC). Each subcode block contains 72 bits of Q data, as described below, 16 bits for the cyclic redundancy check code (CRCC) generation polynomial x16 + x12 + x5 + 1, used for error detection on the control, address, and Q data information in each block.
As noted, there are three modes of Q data. Mode 1 stores information in the disc lead-in area, program area, and lead-out area. The data content in the lead-in area (see FIG. 18A) differs from that in the other areas. Mode 1 lead-in information is contained in the table of contents (TOC). The TOC stores data indicating the number of music selections (up to 99) as a track number (TNO) and the starting times (P times) of the tracks. The TOC is read during disc initialization, before audio playback begins, so that the player can respond to any programming or program searching that is requested by the user. In addition, most players display this information.
In the lead-in area, the TNO is set to 00, indicating that the data is part of a TOC. The TOC is assembled from the point field; it designates a track number and the absolute starting time of that point in minutes, seconds, and frames (75 frames per second). The times of a multiple disc set can also be designated in the point field. When the point field is set to A0 (instead of a track number) the minute field shows the number of the first track on the disc. When the point field is set to A1, the minute field shows the number of the last track on the disc. When set to A2, the absolute running time of the start of the lead-out track is designated.
During lead in, running time is counted in minutes, seconds, and frames. The TOC is repeated continuously in the lead in area, and the point data is repeated in three successive subcode blocks.
In the program and lead-out area (see FIG. 18A) Mode 1 contains track numbers, index numbers (X) within a track, time within a track, and absolute time (A-time). TNO designates individual tracks and is set to AA during lead out. Running time is set to zero at the beginning of each track (including lead-in and lead-out areas) and increases to the end of the track. Starting at the beginning of a pause, time counts down, ending with zero at the end of the pause.
The absolute time is set to zero at the beginning of the program area (the start of the first music track) and increases to the start of the lead-out area. Program time and absolute time are expressed in minutes, seconds, and frames. Index numbers both separate and subdivide tracks.
When set to 00, X designates a pause between tracks, and countdown occurs. Nonzero X values set index points inside tracks. A 01 value designates a lead-out area. Using indexing, up to 100 locations within tracks can be indexed.
Index 0 marks the onset of the pre-gap (pause) that precedes the audio portion of the track and index 1 marks the beginning of the audio portion. The pre-gap is nominally 2 seconds long. Mode 1 information occupies at least 9 out of 10 successive subcode blocks. (FIG. 19 summarizes the timing relationships contained in Mode 1 Q channel information.) In Q data Modes 2 and 3 the program and time information is replaced by other kinds of data. Mode 2 contains a catalog number of the disc, such as the UPC/EAN (Universal Product Code/European Article Number) codes. The UPC/EAN code is unchanged for an entire disc. Mode 2 also continues absolute time count from adjacent blocks. Mode 3 provides an ISRC number for each track. The ISRC number includes the country code, owner code, year of recording, and serial number. The ISRC code can change for each track. Mode 3 also continues absolute time.
Modes 2 and 3 can be omitted from the subcode if they are not required. If they are used, Mode 2 and Mode 3 must occupy at least one out of 100 successive subcode blocks, with identical contents in each block. In addition, Mode 2 and 3 data can be present only in the program area. The remaining six subcode bits (R, S, T, U, V, and W) are packed with zeros on most CDs. However, they are available for CD + G/M or CD Text data as described below.
Unlike newer formats such as DVD and Blu-ray, the CD was not originally designed to hold extensive text or menu information. Thus, the CD Text feature was appended to the original Red Book specification in June 1996. CD Text allows the album title, song titles, artist, composer, producer, and other text information to be added to a disc at the time of manufacture. Compatible players can use CD Text to display this textual information and also to search for particular album titles. CD Text data is placed in the subcode R-W subchannels; it supports a color display of 21 lines of 40 characters each and the option of displaying bitmaps and JPEG pictures. It also permits levels of menus, as well as scrolling lyrics. CD Text was envisioned for numerous applications. For example, catalog number, song title, and artist name can be automatically broadcast via an FM subcode data service. Also, record companies could mark highlighted disc areas for playback at record store listening kiosks. In practice, CD Text is used to display basic album text information.
Other unique approaches can be used to access text information. For example, when using a compatible software CD player, the database at www.cddb.com can be accessed to create metadata files with title, artist, and timing information. When a new disc is loaded, the specific information is accessed over the Internet and then stored locally for subsequent use each time the disc is played. The system creates a unique identifier for every title, based on its running times and number of tracks.