To Check the Modulated Square-Wave Response of the RF and IF Amplifiers
Equipment: Square-wave generator, signal generator, modulator, and low-capacitance probe.
Connections Required: Apply generator outputs to modulator input. Apply modulator output to antenna-input terminals of receiver. Pull the first video-amplifier tube, and connect low-capacitance probe between video-amplifier grid terminal and chassis ground. Feed probe output to vertical-input terminals of scope.
Procedure: Adjust instrument and receiver controls for squarewave display on scope screen. Carefully tune signal generator to picture-carrier frequency. Avoid overloading IF amplifier.
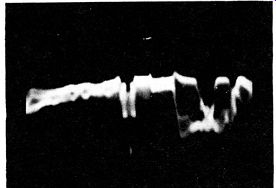
Evaluation of Results: A 60-cycle square wave should be reproduced with less than 15% tilt. A 100-khz square wave should not overshoot more than 10%. A 20-khz square wave should not have seriously rounded corners. (These are the factors determining picture quality.).
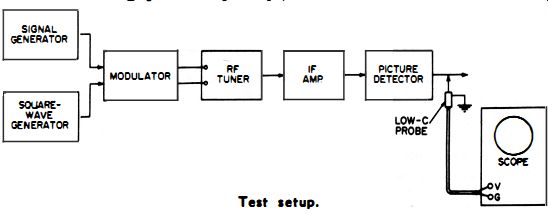
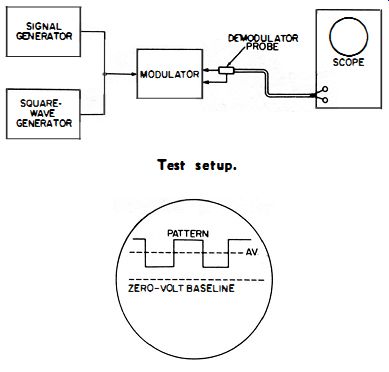
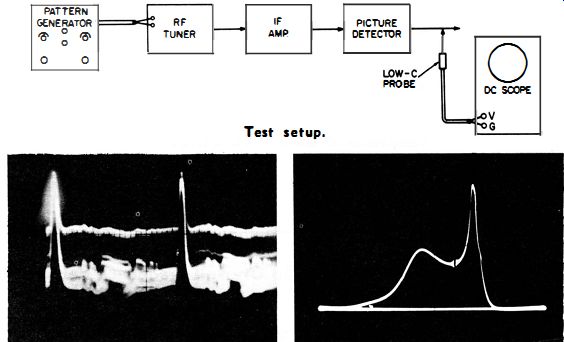
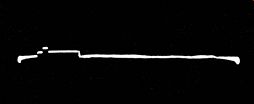
------ Test setup.
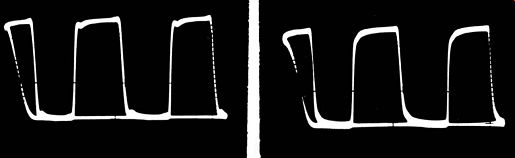
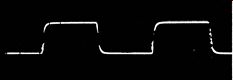
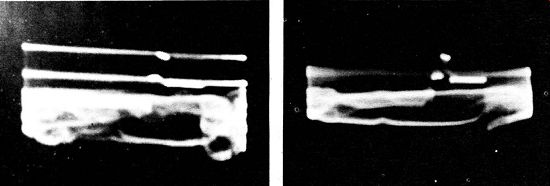
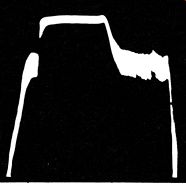
(L) Corners of a 10-khz square wave are reasonably square when the picture carrier
is correctly located halfway up the side of the over-all response curve. (R)
Corners of a 10-khz square wave are rounded when the picture carrier is tuned
to the top of the over-all response curve.
NOTE 24
Construction of External Modulator
An effective external modulator can be easily constructed, as shown be-low. Its response is much better than that of built-in modulators in many signal generators.
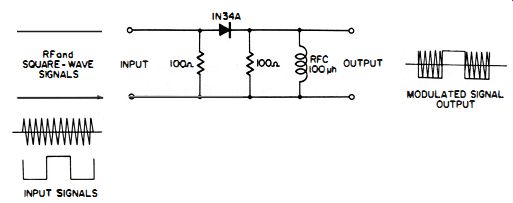
--- Modulator circuit.
NOTE 25
Test for Modulator Linearity
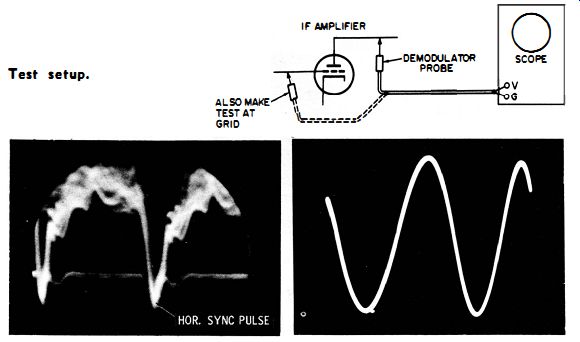
Misleading results can be obtained in tests if a modulator is operated in a nonlinear manner. Hence, a simple test for modulator linearity is described in the following. Outputs from an audio oscillator and RF generator are applied to the modulator input. The modulator output is applied to a demodulator probe and thence to a scope. The scope pattern should be essentially the same as observed directly from the audio oscillator. If distortion is observed in modulator operation, adjust the levels of the RF and AF signals to obtain satisfactory linear operation.
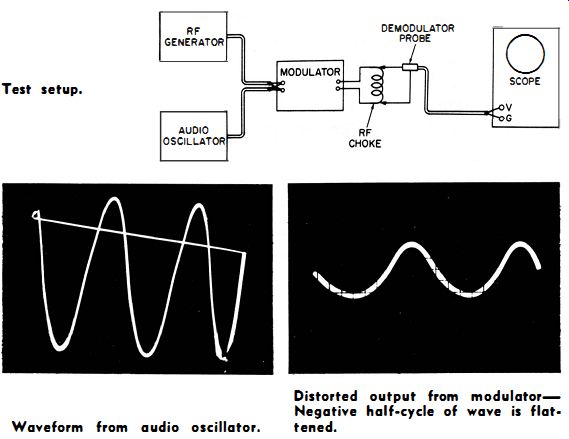
------- Test setup. ----- Waveform from audio oscillator.
Distorted output from modulator-Negative half-cycle of wave is flattened.
++++++++
U18
To Check the Percentage Modulation of the Output from a Diode Modulator
Equipment: Square-wave generator, signal generator, modulator (shown in Note 24), demodulator probe, and DC scope.
Connections Required: Apply signal-generator and square-wave generator outputs to modulator input. Connect demodulator probe at modulator output. Feed probe output to vertical input terminals of scope.
Procedure: Adjust square-wave generator for frequency within the capability of the demodulator probe, such as 100-hz.
Set signal generator to any suitable frequency, such as 75-mhz. Short scope input terminals and note resting position of the base line (zero-volt level) . Remove short and observe position of square-wave pattern on screen.
Evaluation of Results: The excursion of the square wave with respect to the zero-volt level shows the percentage of modulation. If the negative peak of the square wave touches the zero-volt level, modulation is 100%. The following illustration shows 50% modulation. Receiver checks are usually made to best advantage at about 85% modulation. (The percentage modulation is determined by the relative output voltages from the two generators.)
------- Test setup. Appearance of 50 % modulation.
+++++++
U19
To Check the Demodulating Capability of a Demodulator Probe Equipment: Square-wave generator, signal generator, modulator (shown in Note 24) , demodulator probe, and DC scope.
Connections Required: Apply signal-generator and square-wave generator outputs to modulator input. Connect demodulator probe at modulator output. Feed probe output to vertical-input terminals of scope.
Procedure: Vary square-wave generator frequency to determine the upper limit at which the reproduced square wave begins to show rounded corners.
Evaluation of Results: The demodulator probe will introduce distortion when used in square-wave tests at frequencies exceeding the limit determined by the foregoing procedure.
----- Rounded corners of square wave caused by square-wave frequencies
exceeding the demodulating capabilities of the probe.
NOTE 26
Elimination of Line Bounce
In some heavily industrialized and rural areas, line voltage will fluctuate considerably. This fluctuation can cause line bounce in the scope pattern, as illustrated in the following. To correct this difficulty, use an automatic line-voltage regulating transformer to power the scope and other equipment used in tests.
------- Appearance of line bounce.
++++++++++++++++++
U20
To Check the Modulated Square-Wave Response of the RF and IF Amplifiers, Using a Signal Generator with a Built-in Modulator
Equipment: Signal generator (with built-in modulator) , square-wave generator, and low-capacitance probe.
Connections Required: Connect square-wave generator output cable to External Modulation terminals of signal generator.
Connect signal-generator output cable to antenna-input terminals of receiver. Pull first video-amplifier tube. Connect low-capacitance probe between grid of first video-amplifier tube and chassis ground. Feed probe output to vertical input terminals of scope.
Procedure: Adjust instrument and receiver controls for square-wave display on scope screen. Carefully tune signal generator to picture-carrier frequency. Avoid overloading IF amplifier.
Evaluation of Results: A 60-cycle square wave should be reproduced with less than 15% tilt. A 100-khz square wave should not overshoot more than 10%. A 20-khz square wave should not have seriously rounded corners. These are the factors determining picture quality. (Note that the built-in modulator of some signal generators may distort the square-wave signal at higher frequencies of test. )
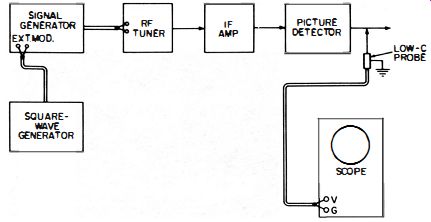
-------- Test setup.
+++++++
U21
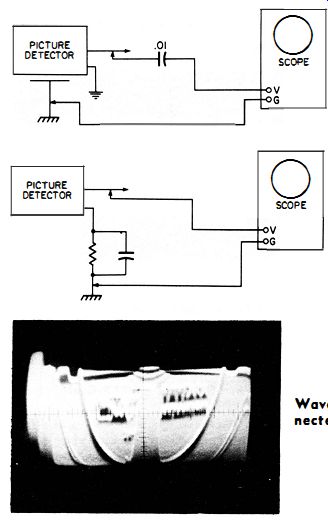
To Check the Video Signal at the Picture-Detector Output
Equipment: Low-capacitance probe.
Connections Required: Connect probe output cable to vertical-input terminals of scope. Apply probe at grid of first video amplifier tube.
Procedure: Tune in TV station signal on receiver. Pull first video-amplifier tube. Adjust scope controls for desired wave-form. Use either vertical or horizontal sweep rate.
Evaluation of Results: A wide-band scope will show all details of the composite video signal. However, a narrow-band scope will serve for many practical tests. Compare waveform and peak-to-peak voltage with data specified in receiver service literature.
Some service scopes have preset horizontal sweep rates for waveforms of this type. If so, the coarse sweep-rate control is merely set to either the "V" or "H" position.
----- Composite video signal-60-hz sweep. Composite video signal--15,750-hz
sweep.
NOTE 27
Distortion of Composite Video Signal, Caused by Resistive Isolating Probe
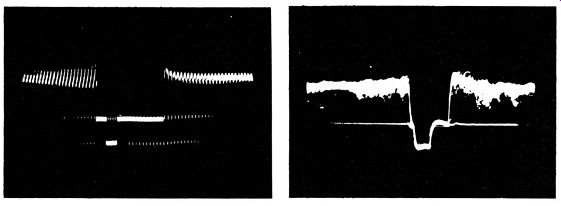
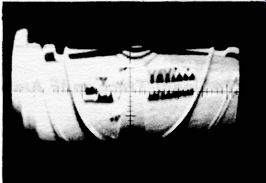
Only a low-capacitance probe is suitable for display of the composite video signal. When a low-capacitance probe is used, the horizontal sync pulses have the same height as the vertical sync pulse. If a resistive isolating probe is used, the reproduced waveform becomes distorted, as illustrated in the following. Here, the horizontal sync pulses (high frequencies) are greatly attenuated and distorted to small sawteeth. Serrations in the vertical sync pulse are al .so distorted to a sawtooth form.
---- Waveform obtained with a low-capacitance probe. ---- Waveform obtained
with resistive probe.
NOTE 28
Distortion of Composite Video Signal, Caused by Narrow-Band Oscilloscope
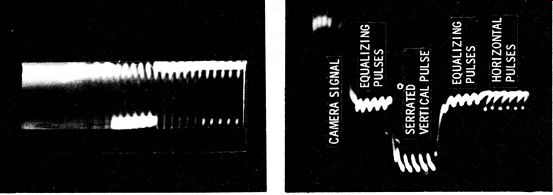
A scope having a narrow bandwidth attenuates the higher video frequencies and causes phase-shift distortion, in much the same manner as a resistive isolating probe. The following photographs show a comparison between the horizontal sync pulse as displayed by a narrow-band scope and by a wide-band scope.
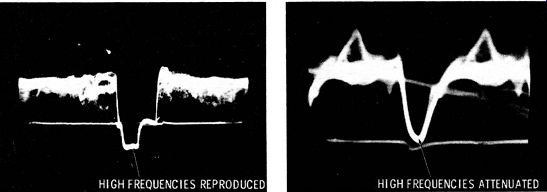
------- Waveform obtained with a 4-mhz scope. ------ Waveform obtained
with audio-frequency scope.
NOTE 29
Locking the Composite Video Signal, When Scope Is Deflected at 60-Cycle Rate
Difficulty is sometimes experienced in obtaining tight sync lock when displaying the composite video signal at a 60-cycle (or 30-cycle) sweep rate. Scopes vary in their ability to lock this type of signal. In event of difficulty, internal 50-cycle line sync can be used. The pattern locks tightly.
However, if a distant station signal, powered from another utility, is being displayed, the vertical sync pulse will drift slowly through the pattern, because various utilities do not operate on synchronized frequencies.
NOTE 30
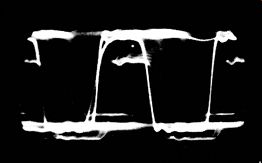
Display of Video Signal Picture Pattern on Scope Screen, Caused by Stray Hum Pickup
When open test leads are used to the vertical-input terminals of the scope, 50-cycle hum will be picked up when the operator brings his hand near the leads. If the composite video signal is being displayed on the scope screen at a 15,750-cycle sweep rate, the presence of 50-cycle hum causes a vertical scanning that displays a picture pattern on the scope screen, as shown in the following illustration.
This pattern is caused by beam displacement, not by intensity modulation, as in a picture tube.
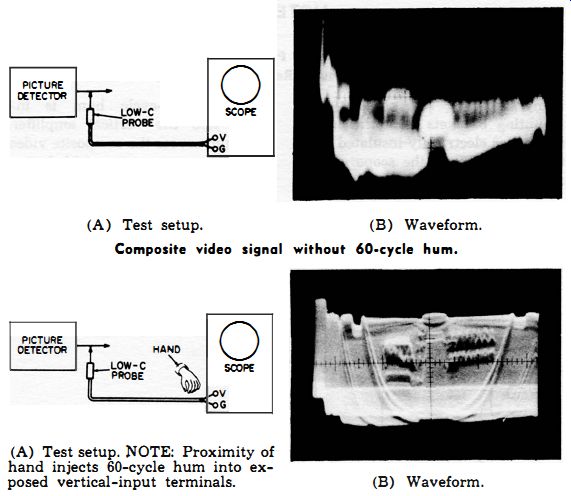
----- Composite video signal without 60-cycle hum. (A) Test setup.
(B) Waveform.
---- Composite video signal with 60-cycle hum. (A) Test setup. NOTE:
Proximity of hand injects 60-cycle hum into exposed vertical-input terminals.
(B) Waveform.
NOTE 31
Fold-over of Video Signal Picture Pattern, Caused by 60-Cycle Hum
When hum is introduced into the vertical amplifier while a composite video signal is being displayed at a 15,750-cycle sweep rate, the hum voltage produces vertical scanning.
Because this is a 50-cycle scan, the pattern is folded over in half, as seen in Note 30. Some scopes have an internal 60-cycle blanking voltage. If this blanking voltage is turned on, the folded-over half of the picture pattern disappears, as shown in the following illustration.
------- Appearance of video signal picture pattern with 60-cycle blanking
voltage turned on.
NOTE 32
Display of Video Signal Pattern on Scope Screen, Caused by Making Ground Return to Floating Metalwork
Many AC/DC TV chassis have mounting brackets and other metal structures electrically insulated from the chassis. When the scope ground return is made to such floating metalwork, 60-cycle hum is injected into the vertical amplifier.
This hum causes the composite video signal to appear as a folded-over picture pattern on the scope screen.
----- Scope connected to floating mounting bracket. Scope properly connected.
Waveform obtained when scope is connected to floating mounting bracket.
++++
U22
To Signal-Trace an IF Amplifier
Equipment: Demodulator probe.
Connections Required: Connect probe output cable to vertical input terminals of scope.
Procedure: Tune in a TV broadcast station (or use modulated output from a signal generator) . Operate the scope at high gain to check the first and second IF stages. Either vertical or horizontal sweep rate can be used. Apply the probe consecutively to each plate and grid of the IF amplifier tubes.
Evaluation of Results: This test is useful chiefly to determine the presence or absence of signal at a particular stage. The probe loads the IF circuits heavily, and accurate peak-to
peak voltage or gain measurements cannot be made. A dead IF stage can be quickly localized, and is indicated by absence of a video signal pattern on the scope screen.
------- Test setup.
---- Video signal waveform from a TV
------ Modulated signal waveform from a generator.
NOTE 33
Oscillation in Video IF Amplifiers, Caused by Probe
Capacitance You will sometimes observe that the input capacitance of the probe detunes an IF stage in such a manner that the tube starts to oscillate.
An IF stage generally oscillates if the grid and plate circuits happen to be peaked to the same frequency.
When a stage oscillates, the video signal is "killed," and the scope screen displays a base line only. It could be falsely concluded that the stage is dead. However, if a test is made at both the grid and the plate of the tube, signal will be found at one point. If the probe capacitance should tune the grid circuit in the direction of oscillation, it will then tune the plate circuit away from the oscillation point.
NOTE 34
Use of Voltage Doubler Demodulator Probe
Service technicians often wish to signal-trace throughout the IF amplifier, from the picture detector back to the tuner output. This can be done if the scope has high sensitivity and a good demodulator probe is used. It is also helpful to tune in a strong TV station signal, to check at the tuner output. Several test-equipment manufacturers have voltage-doubler demodulator probes available. These are twice as sensitive as half-wave probes and assist in making useful checks at the tuner output.
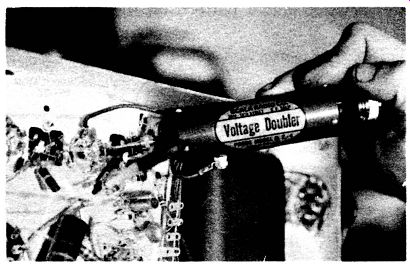
--------- A voltage-doubler demodulator probe in use. (Courtesy of
SCALA Radio Co.)
NOTE 35
Attenuation of Horizontal Sync Pulse, Caused by Demodulator Probe
The usual demodulator probe has poor high-frequency response. As a result, the horizontal sync pulses are attenuated and rounded. When the pattern is displayed with 60 cycle sweep, the vertical sync pulse extends above the level of the horizontal sync pulses, as shown in the following photo. (For tests of probe frequency response, see the companion book, 101 Ways to Use Your Sweep Generator.)
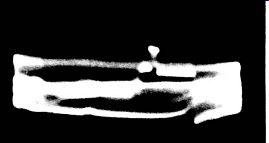
----- Waveform showing the attenuation of horizontal sync pulses by
the demodulator probe.
NOTE 36
Use of Medium-Impedance Demodulator to Eliminate Distortion
Service technicians occasionally wish to use a medium-impedance demodulator probe that does not appreciably distort the horizontal sync pulse. This can be done at the expense of sensitivity. The probe circuit shown in the following illustration can be used for this purpose.
An output cable having relatively low capacitance must also be used.
Best response is obtained by removing the center conductor from standard coax cable and replacing the center conductor with No. 30 wire.
To do this, select the type of coax having a spiral-wound polystyrene insulation around the conductor; otherwise, removal is not practical.
(To invert the direction of the sync pulse on the scope screen, reverse the diode polarity.)
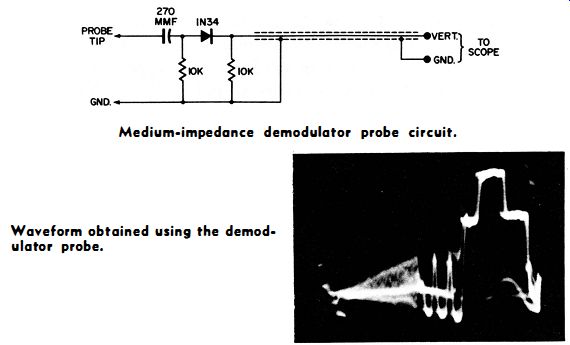
-- Medium-impedance demodulator probe circuit.

----- Waveform obtained using the demodulator probe.
NOTE 37
Demodulator Probe Containing IF Amplifier Stage
Special demodulator probes containing a tunable IF amplifier stage are available for obtaining substantial screen deflection when signal tracing low-level stages. This type of probe has a small self-contained power supply and is powered from a 117 volt, 60-cycle outlet. A small tuning disc extending through the probe housing permits tuning over the 20 and 40-mhz IF bands. It provides good waveform display, as well as high sensitivity. This type of probe is two to three times as expensive as non-amplifying demodulator probes.
+++++++
U23
To Use the RF and IF Amplifiers to Check the Percentage Modulation of a Video Signal, Pattern-Generator Output, or Signal-Generator Output
Equipment: DC scope and low-capacitance probe. (Also a generator, if signal is to be checked from an equipment source. ) Connections Required: Connect low-capacitance probe at picture detector output. Apply probe output to vertical-input terminals of DC scope. (If instrument is used as a signal source, apply output to antenna-input terminals of receiver. ) Procedure: Tune receiver to input signal frequency. Adjust scope controls for suitable waveform display. Then short the vertical-input terminals of the scope.
Evaluation of Results: Note the position of the waveform with respect to the zero-volt level when the vertical-input terminals are shorted. For example, if the waveform touches the zero-volt level, modulation is 100%. If the bottom of the waveform is clipped at the zero-volt level, the carrier is overmodulated.
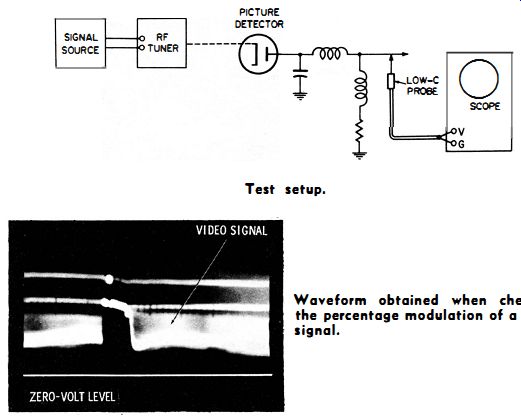
-----Test setup. Waveform obtained when checking the percentage modulation
of a video signal.
NOTE 38
Checking a DC Scope for Equality of AC and DC Response
Most DC scopes give equal vertical deflections for equal values of DC and peak-to-peak voltages. That is, if a 1-volt, peak-to-peak, sine-wave source deflects the CRT beam one inch, a 1-volt DC source will also deflect the beam one inch. However, because of amplifier defects, this is not always true. The scope can be checked for equality of AC and DC response as shown in the following illustrations. First mark the base line of the scope, then apply a DC potential and note the amount the beam is deflected. Next, apply an AC voltage having a peak-to-peak voltage equal to the DC voltage. The peak-to-peak beam deflection of the AC voltage should equal the beam deflection of the DC potential. When AC and DC deflections are not equal, measurements of percentage modulation will be in error.
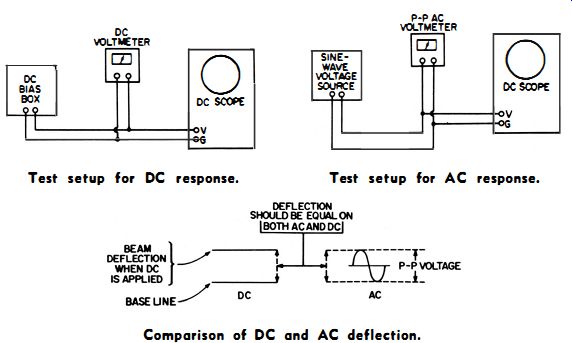
------- Test setup for DC response. Test setup for AC response.
-------- Comparison of DC and AC deflection.
+++++++++
U24
To Make a Quick Test of the Over-all Frequency Response of a TV Receiver
Equipment: Pattern generator and low-capacitance probe.
Connections Required: Apply modulated RF output from pattern generator to antenna-input terminals of receiver. Connect probe at picture-detector output. Feed probe output to vertical-input terminals of scope.
Procedure: Adjust instrument and receiver controls for suitable pattern. Then vary the RF carrier frequency of the pattern generator through the passband of the receiver while watching the vertical deflection on the scope screen. Operate the scope on 30-cycle sweep.
Evaluation of Results: The peak-to-peak voltage of the pattern depends chiefly upon the low video frequencies. These correspond to sidebands near the picture carrier. As the frequency of the pattern generator is varied through the passband of the receiver, the vertical deflection noted on the scope screen indicates the height of the over-all response curve at that frequency. If the pattern height "jumps" or "pops up," there is a sharp peak in the over-all response curve. If it "pops up" twice, there are two sharp peaks, etc. If the pattern suddenly disappears and then reappears, there is a "suck-out" in the over-all response curve.
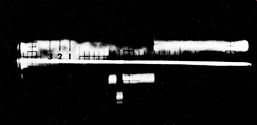
You will note from the photograph that the vertical sync pulse from a service pattern generator does not have standard shape. This is true of all but the most expensive pattern generators. However, useful service tests can still be made without a perfectly shaped vertical sync pulse.
------ Test setup. ----
Typical display from a test pattern generator.
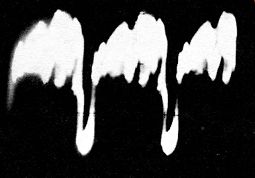
If a receiver has a response curve like this, the pattern will jump to double height when the generator carrier frequency is tuned to the sharp peak.
---- If the receiver has a response curve like this, the pattern
will jump up and down rapidly when the pattern generator is tuned across the
passband of the receiver.
Pattern has half-height on scope screen when generator RF frequency is tuned to half-voltage point on curve; pattern has full height when RF frequency is tuned to top of curve.
NOTE 39
Checking the Over-all Frequency Response, Using the Signal from a TV Station
The same general type of over-all frequency response test can. be made with a TV station signal if the local oscillator frequency is varied. To obtain the necessary range of frequency variation, rotation of the fine-tuning control is usually insufficient and must be supplemented by turning the slug in the local oscillator coil. A well-shaped vertical sync pulse is observed when a TV station signal is used.
If a wide-band scope is used, the horizontal sync pulses will have the same peak voltage as the vertical sync pulse. However, if a narrow-band scope is used, the horizontal sync pulses are attenuated and do not appear to have the same peak voltage as the vertical sync pulses.
This is because the horizontal sync pulses are higher in frequency than the vertical sync pulses.
---- Pattern obtained with a wide-band scope. ---- Pattern obtained
with a narrow-band scope.
++++++++
U25
To Measure the 4.5-mhz Intercarrier Sound-Signal Voltage at the Picture-Detector Output
Equipment: Low-capacitance probe.
Connections Required: Remove first video-amplifier tube. Connect probe at grid terminal of video-amplifier socket. Feed probe output to vertical-input terminals of a wide-band (flat through 4.5-mhz) scope.
Procedure: Tune in a TV station signal. Adjust scope controls for suitable video signal pattern. Use 60-cycle sweep rate.
Evaluation of Results: Observe the top and porches of the vertical sync pulse. The "fuzz" riding on the pulse is the 4.5-mhz sound signal. Turn the fine-tuning control and observe the variation in the 4.5-mhz voltage. If the scope is calibrated, the intercarrier sound voltage can be measured. It should not exceed 5% of the video-signal voltage.
If it does, the IF amplifier is operating nonlinearly or the receiver passband is much too broad.
In the following illustration, the over-all passband is much too wide. The 4.5-mhz intercarrier sound-signal voltage exceeds the allowable 5%. This is conducive to generation of sync buzz.
(Note the horizontal line through the pattern. This line is the zero-volt reference level, obtained by shorting the vertical-input terminals of the scope. The average value or zero-volt level in any waveform can be quickly observed in this manner.)
------- Waveform observed when 4.5-mhz intercarrier sound signal
exceeds 5 % .
NOTE 40
Eliminating Cross Talk from Sweep Circuits in a Video Signal
Do not confuse the 4.5-mhz intercarrier sound signal with possible cross talk from the sweep circuits of the receiver. The following illustration shows the appearance of 60 cycle hum and vertical-sweep cross talk in the composite video signal.
The pattern shows simulated horizontal sync pulses, as commonly provided by service pattern generators.
When in doubt whether cross talk or 4.5-mhz intercarrier sound signal is being observed, remove the horizontal- and vertical-output tubes.
Sometimes the horizontal- and vertical-oscillator tubes must also be removed to eliminate cross talk. A quick test is to turn the fine-tuning control of the receiver. Cross talk does not respond to the local-oscillator frequency.
----- 60-cycle hum and vertical-sweep cross talk in composite
video signal.
NOTE 41
Effect when Demodulator Probe Is Used
Erroneous use of a demodulator probe (instead of a low-capacitance probe) seriously distorts the composite video signal, which undergoes double demodulation.
------ Appearance of composite video signal when demodulator probe
is used at picture-detector output.
NOTE 42
Pickup of Signal from Local TV Station with Demodulator Probe
When a demodulator probe is connected to the vertical-input terminals of a scope and left on the bench, the operator sometimes ob serves a sync pulse when the scope is operated at a 60-cycle sweep rate and at high gain. This sync pulse is caused by probe pickup of a local
TV station having high field strength.
The spurious signal disappears when the probe is connected across a circuit under test, because the input impedance of the probe is then sufficiently lowered that pickup is negligible.
-------- Composite video signal picked up by demodulator probe from local
TV station.
+++++++++
U26
To Check the IF Amplifier for Amplitude Linearity
Equipment: RF signal generator, square-wave generator with built-in modulator (or external modulator), and low-capacitance probe.
Connections Required: Apply square-wave signal to modulator input terminals of signal generator. (If external modulator is used, apply both square-wave signal and RF signal to modulator input.) Connect modulated signal output to antenna-input terminals of receiver. Connect probe at picture detector output. Feed probe output to vertical-input terminals of scope.
Procedure: Tune RF signal generator to channel frequency of receiver. Use a small percentage modulation on the RF generator signal. Tune square-wave generator to any medium frequency, such as 10-khz. Adjust scope controls for suitable square-wave pattern display.
Evaluation of Results: Vary the receiver signal input from a low level to where an output of 2 peak-to-peak volts is obtained from the picture detector. The reproduced square wave shows "fuzz" along the top and bottom. This "fuzz" is caused by the audio modulating voltage in the generator signal. If the IF amplifier is linear, the "fuzz" has equal voltages at both top and bottom of the square-wave display, even at full output from the picture detector. Otherwise, the IF amplifier is nonlinear. Nonlinear amplification is one of the important causes of sync buzz.
-------- Test setup. ------ If the "fuzz" in the reproduced
square wave has less peak-to-peak voltage at the top than at the bottom, I
F amplifier amplitude non-linearity is indicated.
NOTE 43
Determining if Signal Generator Modulator Is Operating Properly
Misleading results can be obtained in the linearity test if the signal generator has a poor modulator. If you find apparent IF-amplifier non-linearity at low input to the receiver, the generator modulator should be suspected. Unless serious trouble is present in the IF amplifier, it will be linear at low RF signal input levels. On the other hand, any IF amplifier becomes non-linear as the input signal level is increased past the normal capability of the IF strip.
+++++++
U27
To Localize a Sync-Limiting Stage in the IF Amplifier
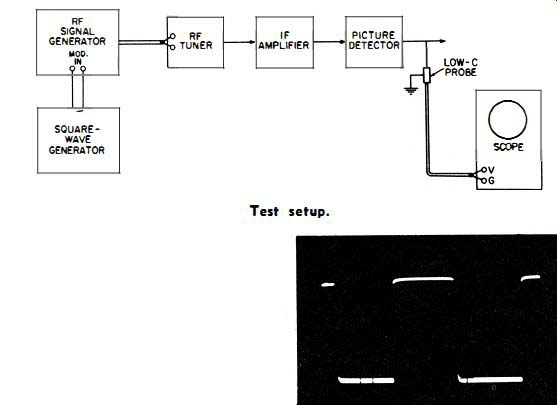
Equipment : Pattern generator and demodulator probe.
Connections Required: Connect modulated-RF output of generator to antenna-input terminals of receiver. Connect probe output cable to vertical-input terminals of scope.
Procedure: Adjust generator and receiver controls for approximately 1 volt peak-to-peak (or normal) output from the picture detector. Apply demodulator probe to the grid and plate of each IF stage, from the picture detector to the tuner. Adjust scope controls for pattern shown in the following illustration.
Evaluation of Results: The height of the vertical sync pulse is observed with respect to the video information. The limiting IF stage causes the vertical sync pulse to appear at less height in the video signal. The stages before the limiting stage show the sync pulse at normal height. The stages after the limiting stage show the sync pulse at subnormal height.
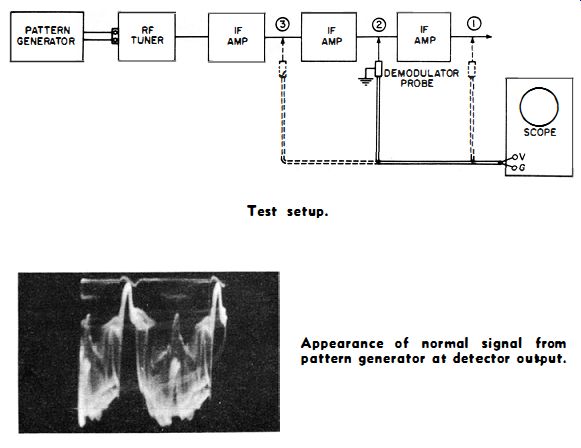
--------- Test setup. ------ Appearance of normal signal from pattern generator
at detector output.
NOTE 44
Reason for Using Pattern Generator to Localize Sync-Limiting Stage
A pattern generator is used in this test because it provides a constant signal as tests are made from stage to stage. A TV station signal is unsuitable unless the station is transmitting a test pattern. Sync limiting, if present, becomes more trouble some where pictures with white backgrounds are used. Most pattern generators permit using a plain white field. Sync limiting is a common cause of picture pulling and 60-cycle sync buzz.
NOTE 45
Method of Determining Whether Limiting of Sync Pulse Is Caused by Receiver or Scope
Sync limiting in receiver signal circuits should not be confused with limiting in the vertical amplifier of the scope. For example, the following photo shows a sync-pulse display in which the sync tip is seriously limited. However, the limiting is being caused by nonlinearity of the scope vertical amplifier. This is quickly shown by reducing the vertical gain to half-screen deflection or less. If the sync tip then resumes normal proportions, the limiting is occurring in the scope, not in the receiver under test.
------- Appearance of horizontal sync pulse when sync tip is compressed
in the vertical amplifier of the scope.
+++