To Make a Square-Wave Test of a Video Amplifier
Equipment: Square-wave generator and low-capacitance probe.
Connections Required: Connect a 0.25-mfd blocking capacitor in series with the "hot" lead from the generator. Apply square-wave voltage between grid and ground of the input video-amplifier tube. Remove socket from picture tube.
Connect low-capacitance probe at video-amplifier output. Feed probe output to vertical-input terminals of wide-band scope. (Scope should have flat response through 4-mhz.)
Procedure: Adjust square-wave generator for an output of approximately 1 volt peak-to-peak. Set contrast control to normal operating position. Adjust scope controls for suitable pattern. Make successive square-wave tests at approximately 60-hz, 10-khz, and 100-khz.
Evaluation of Results : Low-frequency square waves should not have more than 10% tilt. High-frequency square waves should not have more than 10% overshoot. Waveform should be reproduced symmetrically. Faults in a square-wave reproduction are caused by incorrect values of load resistors, damping resistors, peaking coils, or by incorrect operating point of video-amplifier tube (s). Component faults, such as leaky coupling capacitors, defective bypass capacitors, and off-value screen and cathode resistors also cause distorted square-wave reproduction.
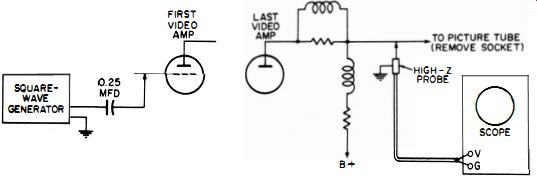
--- Test setup.
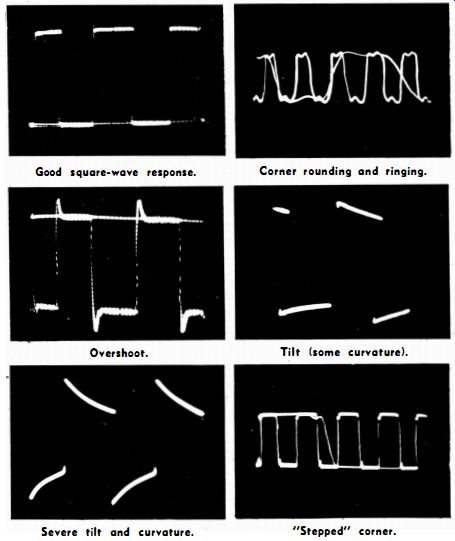
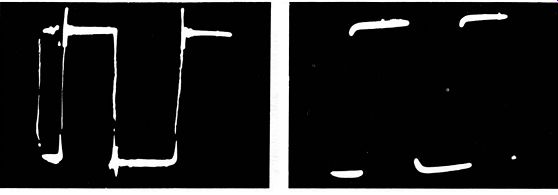
---- Good square-wave response.
Overshoot.
Severe tilt and curvature.
Corner rounding and ringing.
Tilt (some curvature). "Stepped" corner.
---- High-frequency attenuation and phase shift. Overshoot and ringing.
NOTE 46
Checking a Video Amplifier for Amplitude Linearity
At low frequencies, all video amplifiers introduce substantial tilt into the reproduced square wave. Linearity of the video amplifier can be checked by following the procedure outlined in U28 and setting the square-wave generator to 30-hz.
The tilt of the reproduced square wave is symmetrical if the video amplifier is linear. On the other hand, the tilt is unsymmetrical if the video amplifier introduces amplitude distortion. This is shown in the following illustrations. Nonlinear operation is caused by incorrect operating point of the video-amplifier tube, low plate or screen voltages, or inability of the tube type to handle the normal signal excursion (about 1-volt peak-to-peak input) .
-------- Tilt is reproduced symmetrically when amplitude distortion
is absent. Unsymmetrical reproduction of tilted square wave, caused by a nonlinear
amplifier. ----- 79 Severe dissymmetry of tilted square wave.
NOTE 47
Method of Differentiating the Square-Wave Signal in a Well-Designed DC Video Amplifier
The amplitude-distortion test described in Note 46 is easiest to make. Note, however, that with a well-designed DC video amplifier, differentiation of a square-wave signal does not take place, although the amplifier may operate in a non-linear manner. If so, the square wave signal must be tilted (differentiated) before it is applied to the video amplifier. This differentiation is conveniently done by inserting a small series capacitor in the generator output lead, as shown in the following.
---- Inserting a small value of capacitance in series with the
generator output lead. NOTE: Choose a value for C that provides substantial
differentiation of the square wave.
+++++
U29
To Make a Square-Wave Test of a Video Amplifier, Taking the Picture-Detector Circuit into Account
Equipment : Signal generator with built-in modulator (or use external modulator) , square-wave generator, 0.001-mfd capacitor, and low-capacitance probe.
Connections Required: Connect output cable from square-wave generator to modulator input terminals (Ext. Mod. terminals of generator). Connect signal-generator output cable through a 0.001-mfd blocking capacitor to the picture-detector input. Connect probe at video-amplifier output. Remove socket from picture tube.
Procedure: Adjust square-wave generator output for 85% to 100% modulation of the RF voltage (see UI8) . Tune signal generator to midband frequency of receiver IF. Use maximum output from signal generator.
Evaluation of Results: Same as explained in U28. Note that the picture-detector circuit attenuates the high video frequencies somewhat. Since the picture detector processes the composite video signal, this test is more informative when investigating causes of poor picture quality than when checking the video-amplifier response alone.
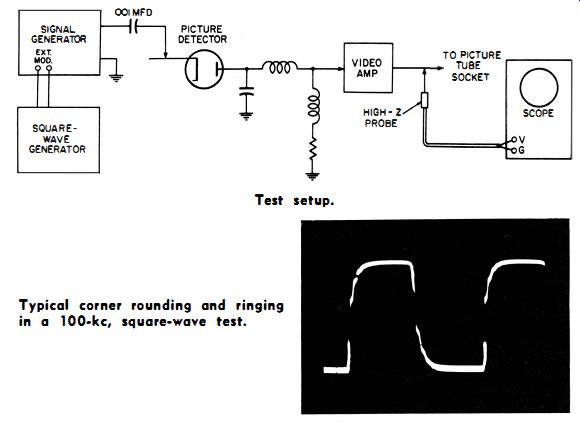
----- Test setup. ------ Typical corner rounding and ringing in a 100-khz,
square-wave test.
NOTE 48
Effect of Over- and Undercompensated Circuits
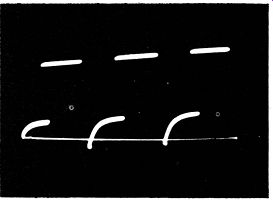
Comer rounding and ringing in square-wave reproduction is caused by a combination of over- and undercompensated circuits. If a circuit with falling high-frequency response is followed by a circuit with rising high-frequency response, the first circuit introduces a rounded corner, while the second circuit introduces ringing. The over-all effect is to produce "sawtooth" or "stepped" comers in the reproduced high frequency square wave.
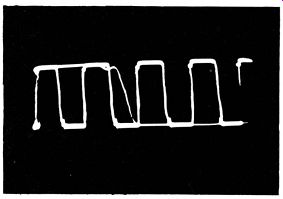
---- Stepped corner over a reproduced 100-khz square wave.
NOTE 49
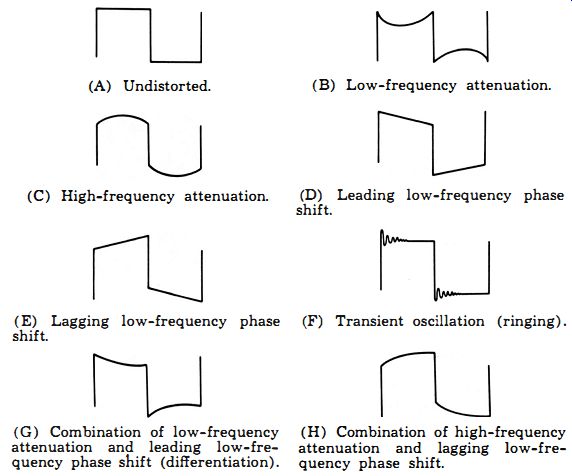
Square-Wave Distortion
The basic square-wave distortions and their causes are illustrated in the following. When troubleshooting circuits that cause square-wave distortion, it is helpful to keep these points in mind.
---- Square-wave distortion by circuit under test.
(A) Undistorted.
(C) High-frequency attenuation.
(E) Lagging low-frequency phase shift.
(G) Combination of low-frequency attenuation and leading low-frequency phase shift (differentiation).
(B) Low-frequency attenuation.
(D) Leading low-frequency phase shift.
(F) Transient oscillation (ringing) .
(H) Combination of high-frequency attenuation and lagging low-frequency phase shift.
A low-capacitance probe contains a compensating capacitor, as shown in the following diagram. Unless the capacitor is correctly adjusted, the scope will display a distorted square wave. Undercompensation causes diagonal corner rounding (high-frequency attenuation and phase shift). Overcompensation causes diagonal overshoot (excessive high-frequency response and phase shift) . The step attenuator in a scope also utilizes compensating capacitors. Unless these capacitors are correctly adjusted, similar square-wave distortion occurs.
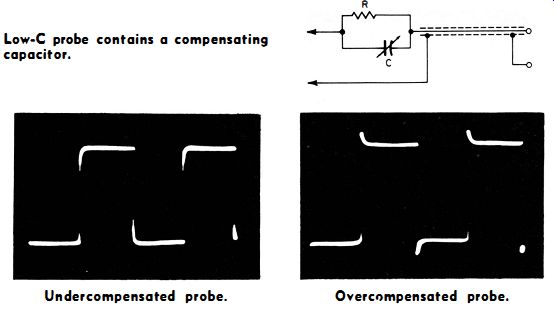
---- Low-C probe contains a compensating capacitor.
---- Undercompensated probe. Overcompensated probe.
NOTE 50
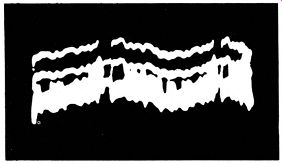
Need for High-Frequency, Square-Wave Test in Video Amplifier
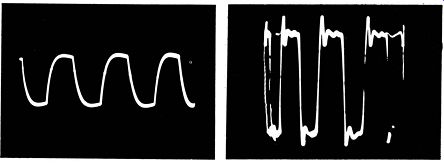
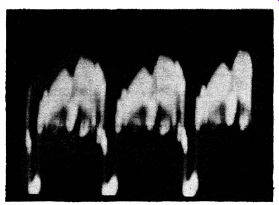
High-frequency ringing in a video amplifier can be properly observed with a high-frequency, square-wave test only, because the high-frequency harmonics in a low-frequency square wave are relatively weak. As shown in the following illustrations, high-frequency ringing, practically in visible in a 1,000-cycle square-wave test, becomes apparent in a 100,000 or 500,000-cycle square-wave test.
Ringing in a video amplifier is a common cause of "outlines," "repeats," or "circuit ghosts" in the picture.
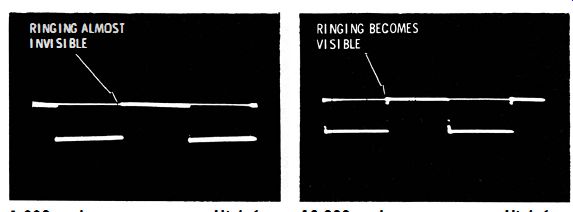
--- 1,000-cycle square wave. High-frequency ringing is practically
invisible. 10,000-cycle square wave. High-frequency ringing can be seen on
leading and trailing edges.
----- 100,000-cycle square wave. Ringing becomes evident.
500,000-cycle square-wave. Pattern shows ringing completely across the top
and bottom.
NOTE 51
Checking for Ringing in Video Amplifier
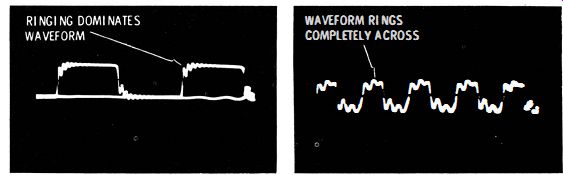
A basic distinction will be observed in ringing patterns from a video amplifier, depending upon whether the square wave rings only at the leading and trailing edges or whether it rings clear across the top of the square wave. When the ringing is damped and dies out between leading and trailing edges, the amplifier rings the same for all square-wave frequencies; i.e., you will observe that the peak-to-peak voltage of the ringing component remains the same when the tuning dial of the square-wave generator is varied. On the other hand, when the ringing is undamped and persists at practically the same peak-to-peak voltage completely across the top of the square wave, the amplifier rings strongly at one setting of the generator tuning dial, but the ringing disappears as the square-wave frequency is changed. Then the ringing appears again as the square-wave frequency is changed still more. This is caused by interference from ringing patterns, which aid or oppose at different frequencies. Therefore, ringing tests should not be made at "step frequencies," but should be observed as the tuning dial of the generator is rocked back and forth.
Otherwise, a false conclusion might be made that the video amplifier does not ring at all, whereas it actually rings very strongly at reinforcing square-wave frequencies.
(See the following illustrations.)
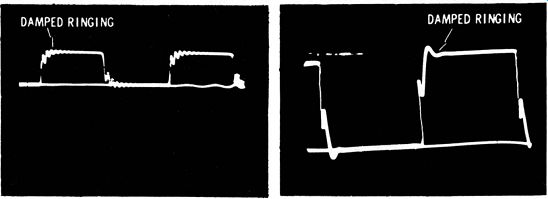
--- Square waveforms displaying damped ringing.
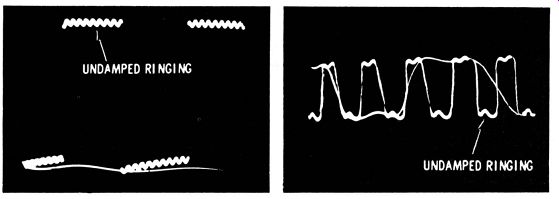
--- Square waveforms displaying essentially undamped ringing.
+++++
U30
To Check the Composite Video Signal at the Video-Amplifier Output
Equipment: Low-capacitance probe.
Connections Required: Connect probe between video-amplifier output terminal and chassis ground. Remove socket from picture tube. Feed probe output to vertical-input terminals of scope. (Scope should be flat through 4-mhz.)
Procedure: Tune in a TV broadcast signal or drive receiver from a test-pattern generator. Adjust scope controls for suitable pattern display.
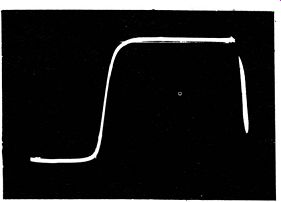
Evaluation of Results: Composite video signal should be undistorted, as shown in the following photo.
------- Appearance of composite video signal at output of video
amplifier.
NOTE 52
Effect on Composite Video Signal When Video Amplifier Low-Frequency Response Is Poor
When the low-frequency response of the video amplifier is poor, a partial differentiation of the composite video signal, commonly called sync punching, can be seen. The vertical sync pulse is punched (depressed) below the level of the horizontal sync pulses. (See the following photos.)
-- Examples of sync punching.
Effect of Poor Low-Frequency Response and 60-Cycle Hum Distortion on Composite Video Signal
A combination of poor low-frequency response and 60-cycle hum distortion in the video amplifier causes the composite video signal to appear as shown in the following photo. Poor low-frequency response is caused by faulty coupling or by pass capacitors, or by a load resistor too low in value. 60-cycle hum is caused by heater-cathode leakage in a tube.
---- Effect of poor low-frequency response and 60-cycle hum in video
amplifier on composite video signal.
NOTE 54
Checking for Sync Punching in IF and RF Amplifiers
Sync punching (as well as 60-cycle hum) can enter the composite video signal in the IF or RF amplifier, as well as in the video amplifier. Hence, this type of distortion must sometimes be traced back into the high-frequency circuits. Sync punching causes unstable or lost vertical sync.
If the distortion is found at the video amplifier input, it is next traced back through the IF amplifier.
A demodulator probe is used. A probe as described in Note 36 is best. It normally displays horizontal and vertical sync pulses at equal height.
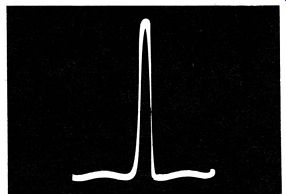
To Check the Operation of d Video-Peaking Contrast Control
Equipment: Signal generator with built-in modulator (or external modulator) , square-wave generator, 0.001-mfd capacitor, and low-capacitance probe.
Connections Required: Connect output cable from square-wave generator to modulator input terminals (Ext. Mod. terminals of generator). Connect signal-generator output cable through a 0.001-mfd blocking capacitor to the picture-detector input terminal. Connect probe at video-amplifier output.
Remove socket from picture tube.
Procedure: Adjust square-wave generator output for 85% to 100% modulation of the RF voltage (see U18) . Tune signal generator to midband frequency of receiver IF. Use maximum output from signal generator. Vary the setting of the contrast control over the major portion of its range. (Increase scope gain as the contrast-control setting is reduced.)
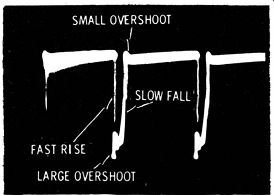
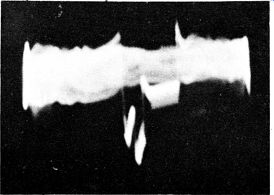
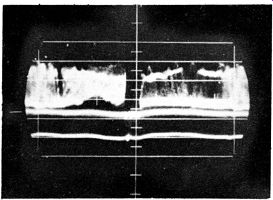
Evaluation of Results: A video-peaking contrast control, when set at maximum, usually introduces noticeable overshoot and ringing into a 100-khz square wave. On the other hand, when the control is set to a low position, the corners of a 100-khz square wave are usually rounded.
--- Overshoot and ringing of square wave with video-peaking contrast control
at high letting. --- Corner rounding occurs when control is let to low level.
NOTE 55
Reason for Unsymmetrical Overshoot in Reproduced Waveform
When observing reproduced square waves for overshoot, note that the overshoot is sometimes unsymmetrical on positive and negative peaks of the waveform, even though the amplifier is linear. This unsymmetrical overshoot is caused by unequal rise and fall times of the squarewave generator signal. The faster the rise (or fall) , the greater the overshoot produced by a given video-amplifier circuit. Good square-wave generators have equal rise and fall times.
++++++
U32
To Check CJ Squarewave Signal for Equal Rise und Full Times
Equipment: Trimmer capacitor, 10,000-ohm resistor, and square-wave generator.
Connections Required: Feed generator signal through the small capacitor and into the resistor (differentiating circuit) . Apply the voltage across the resistor to the vertical-input terminals of the scope.
Procedure: Adjust instrument controls for pattern as shown.
Vary trimmer capacitance to obtain sharp pulses.
Evaluation of Results: If the square-wave voltage has equal rise and fall times, the pulses have equal positive and negative peak voltages. If pulses have unequal voltages, the differing rise and fall times thus indicated must be taken into account in evaluating amplifier linearity in terms of overshooting.
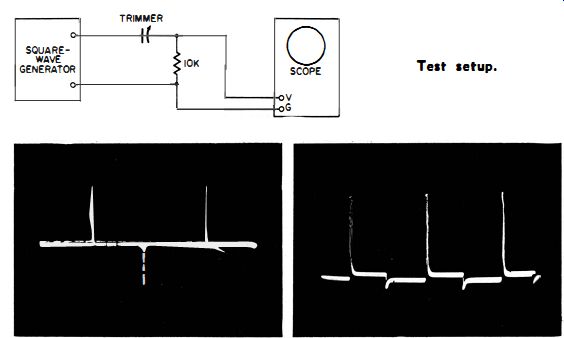
--- Test setup. ---- Rise time slightly falter than fall time.
Rise time much falter than fall time.
NOTE 56
Alternate Method of Checking Rile and Fall Time of Square-Wave Generator
Another simple test for determining the equality or inequality of rise and fall times is to adjust the ' intensity control of the scope until either the rise or fall of the square wave pattern is just visible. When rise and fall times are equal, their traces are equally visible. On the other hand, as shown in the next illustration, the fall trace, for example, may become visible before the rise trace. This shows that the rise is faster than the fall. This test is less informative than the test given in U32 because it is not quantitative. Furthermore, unless the scope itself is known to be in good operating condition, the square wave generator could be unjustly blamed for a failure of the scope.
---- Leading edge is invisible at brightness level where trailing
edge is visible. --- Rise time is faster than the fall time in this waveform.
Rise time is visible (slow). Fall time is invisible (fast) . Rise edge causes
no overshoot. Fall edge causes over shoot. ------ Sync-pulse waveform from
generator shows faster leading edge than trailing edge. Leading edge will
ring a video amplifier before the trailing edge does. --- Same sync pulse
with vertical-gain control advanced and horizontal-gain control setting reduced.
This provides an easy comparison of the leading and trailing edge brightness.
NOTE 57
How a Horizontal Sync Pulse with Unequal Rise and Fall Times Causes Ringing in Video Amplifier
The following photo illustrates how a horizontal sync pulse with unequal rise and fall times rings a video amplifier. The pulse rise is fast, as shown by its small visibility. This fast rise causes considerable over-shoot and ringing in underdamped video-frequency circuits. On the other hand, the pulse fall is slow, as shown by its plain visibility. This slow fall causes a comparatively small overshoot in the video circuits.
---- Horizontal sync pulse with unequal rise and fall times.
+++++++
U33
To Check the Decoupling Capacitors in a Video-Amplifier Circuit
Equipment: None.
Connections Required: Connect vertical-input cable of scope across the decoupling capacitor under test.
Procedure: Tune in TV broadcast signal. Adjust scope controls for pattern, as shown in the following illustration.
Evaluation of Results: Maximum tolerable p-p voltage is not published in general service notes, but the observed p-p voltage can be compared with that found in a normally operating receiver of the same type. A higher than normal p-p voltage at this point indicates the decoupling capacitor is not functioning properly.
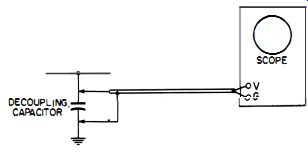
-------- Test setup.
------- Typical waveform across a video amplifier decoupling capacitor
(60-cycle sweep rate),
++++++
U34
To Check the Action of a DC Restorer
Equipment: DC scope and low-capacitance probe.
Connections Required: Connect probe at signal-input electrode of picture tube. Feed probe output to vertical-input terminals of scope.
Procedure: Tune in TV station signal (or use pattern-generator signal) . Adjust scope controls for waveform as shown in the following illustration.
Evaluation of Results: DC scope must have good vertical balance to make a valid test. Note level of the horizontal sync pulses on the scope screen. If DC restorer is operating properly, the sync tips remain at the same level (or nearly so) as the background changes from light to dark or vice versa.
If using a pattern generator, test is accomplished by varying the percentage modulation of the RF carrier by the test pattern. This generator control is identified as the Video control on some instruments.
--- Waveform at picture-tube input.
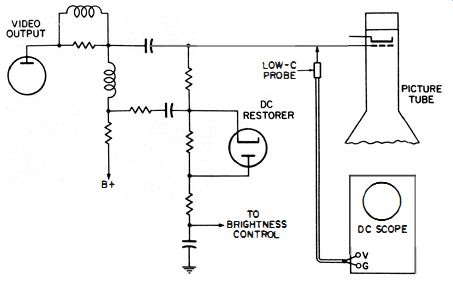
---- Test setup.
NOTE 58
Checking the Rise Time of a Video Amplifier
According to a rule of thumb, the rise time of a video amplifier is considered to be one-third the period represented by the frequency at a point down 3 db (71 %, or half-power point) . For example, if the amplifier passes a 4-mhz frequency at the 3-db point, then the period of the 4-mhz frequency is 0.25 microsecond, and one-third of this period is approximately 0.08 microsecond. The rise time of the amplifier is then considered to be 0.08 microsecond.
Of course, a square-wave generator used for testing a video amplifier must have a faster rise time than the video amplifier to obtain a meaningful test. If the rise time of a video amplifier is 0.08 microsecond, a generator with a rise time of 0.05 microsecond is quite satisfactory.
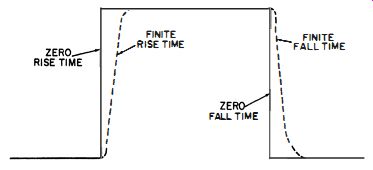
--- Comparison of zero rise and fall times to finite rise and fall
times.
------- The leading edge of any square wave sloping, not vertical,
when displayed on a scope with expanded sweep.
+++++++
U35
To Check the Vertical Retrace Blanking Pulse at the Picture Tube
Equipment: Low-capacitance probe.
Connections Required: Connect probe at blanking-pulse input point. This point is usually the grid or cathode of the picture tube. Feed probe output to vertical-input terminals of scope.
Procedure: Adjust scope controls for pattern as shown in the following.
Evaluation of Results: Check peak-to-peak voltage of pulse against value given in receiver service data.
---- Typical retrace blanking pulse.
++++++++
U36
To Check for AC in the Video-Amplifier B+ Supply Line
Equipment: None.
Connections Required: Connect cable directly from supply line to vertical-input terminals of scope.
Procedure: Use 60-cycle horizontal sweep. Adjust scope controls for pattern as shown in the following illustrations.
Evaluation of Results: Picture quality is impaired when excessive spurious AC voltage enters the video amplifier through the plate and screen supply lines. Maximum tolerable AC voltage is sometimes specified in the receiver service literature.
If maximum permissible ripple voltage is not given in receiver service literature, compare with value observed in a properly operating receiver of the same type.
--- Test setup. ---- Typical ripple waveforms observed in B + supply
line.
NOTE 59
Elimination of "Writhing," Caused by Difference in Supply Frequencies
AC waveforms in the power-supply system often "writhe." This "writhing" is caused by lack of identical frequencies between the vertical sweep rate and local utility frequency. To eliminate the "writhing," tune the receiver to a local TV station. Its sync is locked to the local utility frequency. In heavily industrialized and rural areas, rapid transients may also disturb the waveform, due to power-supply feedthrough. Transients can be eliminated with an automatic line voltage regulating transformer.
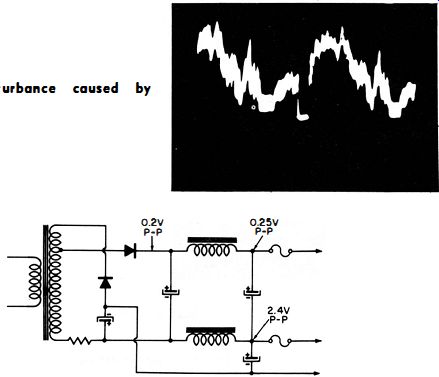
---- Waveform disturbance caused by transients. ----- Typical maximum tolerable
ripple voltages in a TV power supply.
+++++++
U37
To Check the Output from a Video Amplifier for Sync Limiting
Equipment : Low-capacitance probe and pattern generator.
Connections Required: Connect output from pattern generator to antenna-input terminals of receiver. Connect probe, first to picture-detector output and then to video-amplifier output.
Feed probe output to vertical-input terminals of scope.
Procedure: Adjust generator and receiver controls for normal screen pattern (or specified p-p output from picture detector) . Adjust scope controls for display as shown in the following illustration.
Evaluation of Results: With the probe applied at the picture detector output, note the vertical deflection of the sync pulse with respect to the total deflection of the video signal.
Next, with the probe applied at the video-amplifier output and scope gain reduced, check whether the ratio of sync-pulse deflection to total video-signal deflection is the same.
If not the same, sync limiting is present in the video amplifier.
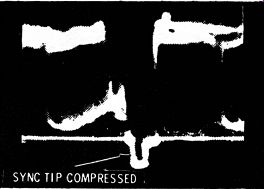
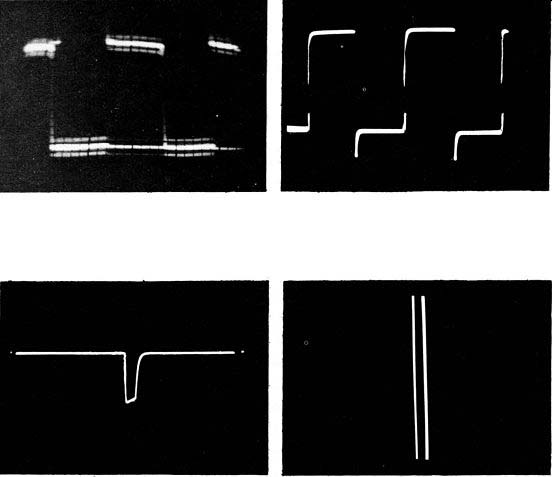
--------- Horizontal sync pulse with amplitude limiting present.
NOTE 60
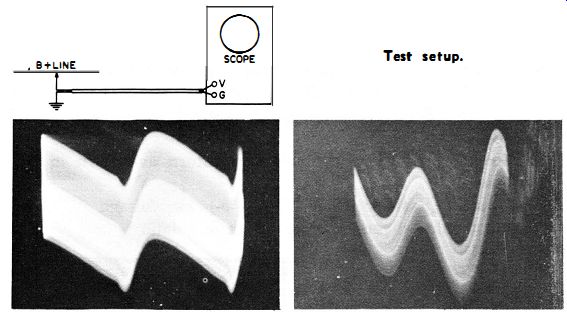
Effect of SyncLimiting
Sync limiting can cause picture pulling and sync buzz. Sync limiting can occur in the video amplifier as well as in the IF amplifier. This is the result of insufficient dynamic range. The most usual causes are incorrect tube operating points and low supply voltages. Picture pulling occurs when the sync pulses are so compressed that the phase detector no longer operates properly.
Sync buzz occurs when the vertical sync pulse becomes deeply modulated into the 4.5-mhz intercarrier sound signal. Buzz modulation does not occur when the video amplifier operates linearly. On the other hand, when the video amplifier limits 'sync (operates nonlinearly) , the sync voltage becomes modulated into the 4.5-mhz signal, as shown in the following illustration. The greater the curvature of the video-amplifier characteristic, the deeper the modulation of the sync pulses in the 4.5-mhz FM signal.
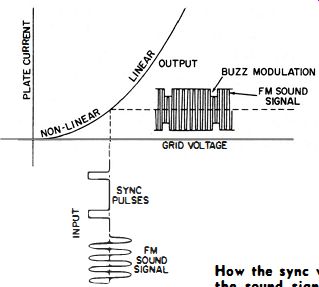
--- How the sync voltage becomes modulated into the sound signal.
++++++
U38
To Examine Waveform Detail by Use of Retrace Expansion
Equipment: As described under any selected Use.
Connections Required: As described under that Use.
Procedure: Turn up intensity control of scope. Adjust sync amplitude, horizontal-sweep rate, and sync-polarity controls to display the desired waveform detail on retrace.
Evaluation of Results: Waveform detail at a given level in the forward trace will be displayed at the same level in the retrace. However, the display appears from right to left instead of left to right, and the detail is greatly expanded on retrace. Expansion is greater when the horizontal-sweep rate is greater. The expanded display appears with the forward-trace pattern.
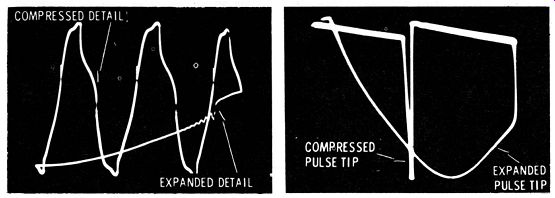
---- Harmonic detail of a distorted sine wave expanded in retrace
display. Peak of narrow pulse expanded by display on retrace.
+++++++
U39
To Obtain the Zero-Volt Level in a Waveform (Measurement of Positive- and Negative-Peak Voltages)
Equipment: Same as described under selected Use (AC scopes only) . Connections Required: Same as described under that Use.
Procedure: Display waveform as in selected Use. Then short-circuit the vertical-input terminals of the scope. A base line appears on the scope screen.
Evaluation of Results: The base line indicates the zero-volt level in the waveform.
Positive- and negative-peak voltages are measured from this zero-volt level. Peak volts are measured in the same units as peak-to-peak volts. Thus, if the scope has been calibrated for a sensitivity of one peak-to-peak volt per screen interval, its sensitivity is also one peak volt per screen interval when counting intervals from the zero-volt level to a waveform peak.
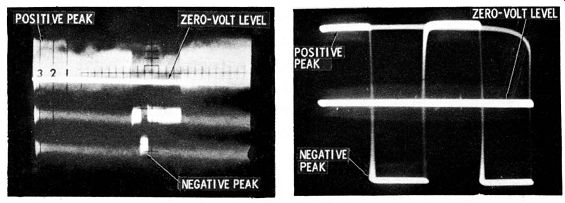
------- Appearance of the zero-volt line on a composite video waveform.
------- Appearance of the zero-volt line on a square wave.
+++++++
U40
To Apply the Video Signal Voltage Directly to the Vertical Deflection Plates of a Scope
Equipment: two 0.1-mfd capacitors.
Connections Required: Open the links (or disconnect the busses) from the scope vertical amplifier to the CRT deflection plates.
As shown in the following diagram, shunt a 0.1-mfd capacitor between the other plate and the video amplifier output.
Procedure: Adjust the receiver for normal signal output. Adjust the horizontal-sweep controls of the scope for suitable CRT display, as shown in the following waveform. (Note that the vertical-gain controls of the scope do not work.) The centering controls operate, since R1 and R2 provide a DC path from the CRT plates to the centering controls of the scope. If the pattern is difficult to lock, use external sync.
Run a test lead from the external-sync post of the scope and clip it to the insulation of the video-amplifier output lead.
Evaluation of Results: Note that the amount of vertical deflection obtained depends on the video-amplifier output voltage.
About 400 peak-to-peak volts are needed to get full-screen deflection on the usual scope screen. Hence, a typical video amplifier gives only one-quarter screen deflection or less.
This test shows extremely high frequencies, and parasitics or "spot" oscillatory voltages, which would escape the vertical amplifier in a service-type scope, can be seen.
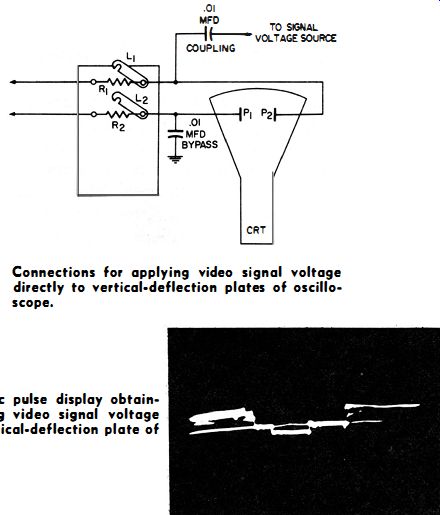
-- Connections for applying video signal voltage directly to vertical-deflection
plates of oscilloscope.
-------- Horizontal sync pulse display obtained by applying video signal voltage directly to vertical-deflection plate of oscilloscope.
NOTE 61
Need for Bypass Capacitor When Viewing Video Signal Applied Directly to Deflection Plates of Scope
The bypass capacitor shown in the foregoing diagram is essential. If the bypass capacitor is not used and the link is closed, signal-voltage return is then made through the plate load circuit of the vertical-amplifier circuit. The impedance of this return circuit distorts the waveform. On the other hand, if the bypass capacitor is not used and the link is left open, low sensitivity and severe frequency distortion occur. If a by pass capacitor is used and the link is left closed, a very large value of capacitance is required because of the resonant characteristics of the peaking coils shunting the bypass capacitor. Hence, open the link and use a relatively small value of bypass capacitance, such as 0.1 mfd.
Because of the high value used for R1, this gives good frequency response.
++++++++
U41
To Measure the Gain of a Video Amplifier
Equipment: Pattern generator and low-capacitance probe.
Connections Required: Connect output cable of generator to antenna-input terminals of receiver. Connect probe output cable to vertical-input terminals of scope.
Procedure: Apply probe to picture-detector output and then to video-amplifier output. Adjust receiver controls for normal operation. Adjust scope controls for pattern as shown.
Evaluation of Results: The video-amplifier gain is measured by comparing vertical deflections in the two tests. A pattern generator insures a stable signal. If the step attenuator is dropped back from the Xl position to the x100 position and equal screen deflection is obtained at the amplifier output, the gain is 100 times. Check service data for normal gain. A variation of 20% is permissible. Low gain gives poor picture contrast and is usually caused by low-value load resistors, incorrect tube voltages, or defective bypass capacitors.
------- Test setup.
------- Waveform at video-amplifier tube.
++++++++
U42
To Check a Video Amplifier for Low-Frequency and High Frequency Phase Shift
Equipment: Audio oscillator and blocking capacitor (10 mfd) .
Connections Required: Feed output from audio oscillator through blocking capacitor (connected in suitable polarity) to output terminal of picture detector. Also feed output from audio oscillator to vertical-input terminals of scope. Remove socket from picture tube and run lead from video-amplifier output to horizontal-deflection plate of scope. Horizontal amplifier is not used because its frequency response is inadequate in most service scopes. Hence, the video amplifier output is applied directly to the horizontal-deflection plate of the CRT. Procedure: Adjust audio generator output for maximum horizontal deflection on scope screen, without overload. Adjust vertical-gain control of scope for typical pattern, as shown.
Evaluation of Results: Negligible phase shift occurs in the mid-band range of the video amplifier, unless circuit faults are present. On the other hand, increasingly greater values of phase shift will be found at low video frequencies (such as 60 cycles) and at high video frequencies (such as 3-mhz) . Note that early low-frequency phase shift causes distortion of large areas in the picture, with poor background reproduction. Likewise, early high-frequency phase shift causes poor picture detail and displacement of picture elements.
The pattern may appear inclined to the right or left, depending on the number of stages in the receiver video amplifier and in the vertical amplifier of the scope.
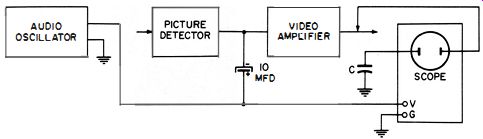
--------- Test setup (see Note 61 for discussion of C).
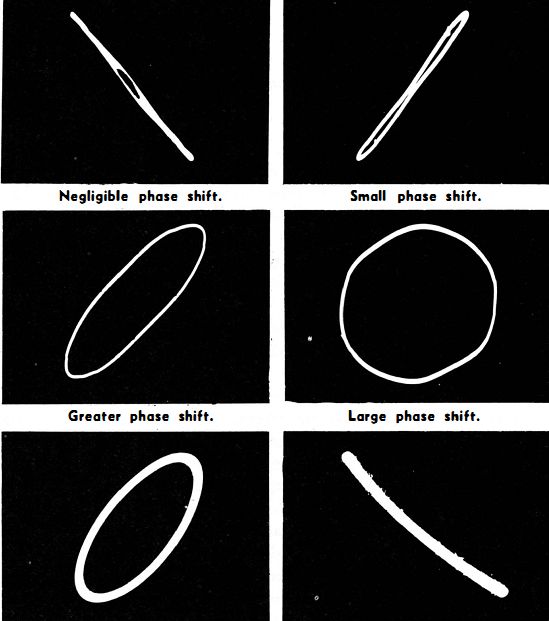
--------- Typical phase shift and loss of gain. No phase shift,
but amplitude non-linearity shows as a curvature of the diagonal line. Negligible
phase shift. Small phase shift. Greater phase shift. Large phase shift.
NOTE 62
Phase Shift Introduced by Vertical Amplifier of Scope
The scope vertical amplifier should have a flat frequency response and a greater bandwidth than the receiver video amplifier. Otherwise, apparent phase shift in the patterns will be introduced by the scope. A DC scope is best for low-frequency checks, since the vertical amplifier introduces no phase shift at 60 cycles, for example. A 5-mhz vertical amplifier is adequate for checking the 4-mhz video amplifier of a receiver.
NOTE 63
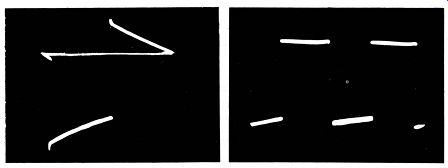
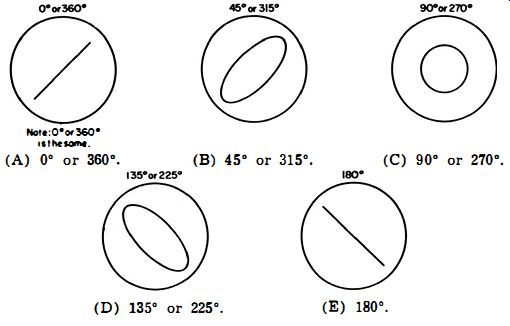
Determining Degrees of Phase Shift
The pattern characteristics show the degrees of phase shift. For example, the following illustrations show five key patterns. Suppose that in the midband response where no phase shift is present, the screen pattern is a line inclined to the right. As either end of the band is approached, the line will open into a 45° ellipse, also inclined to the right, as seen in the second pattern. Closer approach to the band limits causes a circular pattern (when vertical and horizontal gains are properly adjusted), indicating 90° phase shift, as shown in the third illustration.
At 135° the circle flattens to an ellipse, as shown in the fourth illustration, this ellipse being inclined to the left.
At 180° a straight line inclined to the left is displayed, as seen in the fifth illustration. A phase shift of 2250 next reproduces the 135° pattern.
At 270° the 90° pattern is reproduced. At 315° the 45° pattern is reproduced. At 3600 the 0° pattern reappears. Still greater amounts of phase shift cause the sequence to repeat.
-------
Waveforms obtained with different degrees of phase shift.
+++