To Check the Output from an NTSC-Type Color-Bar Generator
Equipment : NTSC color-bar generator. Scope with vertical amplifier having flat frequency response through 3.58-mhz.
Connections Required: Connect generator output cable to vertical-input terminals of scope.
Procedure: Set generator controls for video-frequency output.
Adjust scope controls for typical pattern, as shown in the following.
Evaluation of Results: Burst should have the same peak-to-peak voltage as the horizontal sync tip. Top of green bar should be approximately even with the back porch of the horizontal sync pulse. Bottom of the magenta bar should be approximately even with the white-bar level.
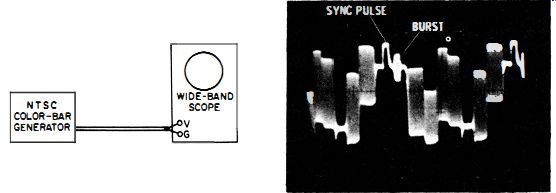
-------- Test setup. ; Waveform obtained from color-bar generator.
NOTE 79
Burst Position on Horizontal Sync Pulse
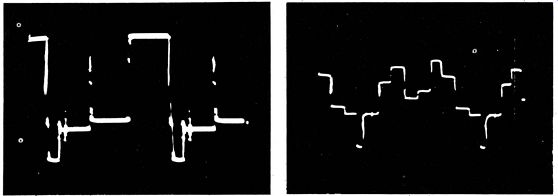
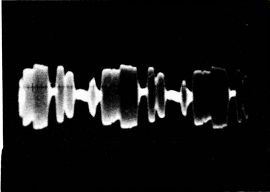
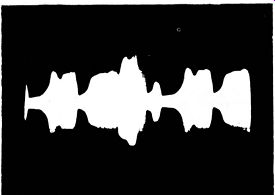
The position of the burst on the back porch of the horizontal sync pulse varies appreciably in some service color-bar generators. The following illustrations show two examples of burst positioning. Also shown is the burst position in a typical color-TV broadcast signal.
According to FCC standards, there is a small interval between the sync pulse trailing edge and the burst leading edge. This interval is established as 0.006H, where H is the total horizontal-scanning interval.
Although the burst position is not critical, a more accurate test of burst-gate timing is obtained when the burst position is standard.
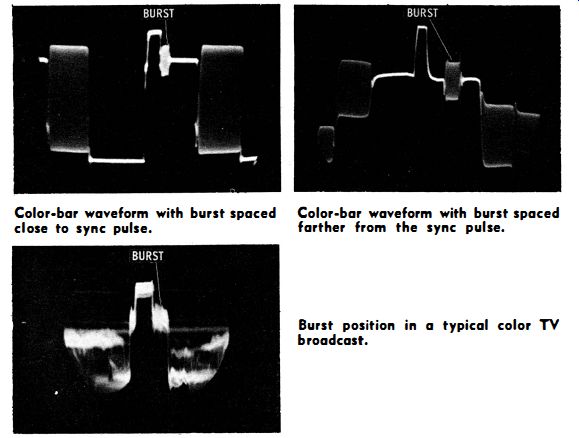
----- Color-bar waveform with burst spaced close to sync pulse.
Color-bar waveform with burst spaced farther from the sync pulse.
--------- Burst position in a typical color TV broadcast.
++++++++
U61
To Check the Y and Chroma Components in an NTSC Color-Bar Signal
Equipment: NTSC color-bar generator. Scope with vertical amplifier having flat frequency response through 3.58-mhz.
Connections Required: Connect generator output cable to vertical-input terminals of scope.
Procedure: Switch generator successively from "Color Bar" to "Y" and "Chroma" outputs.
Evaluation of Results: See the following illustration for correct proportions of 100% saturated color-bar waveforms.
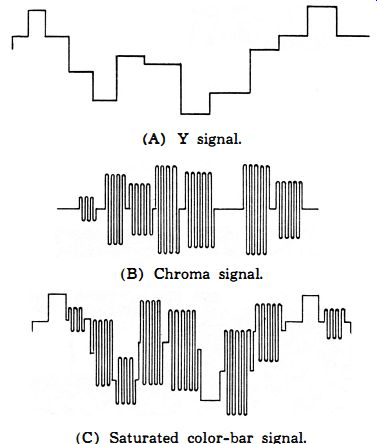
------ (A) Y signal. (B) Chroma signal. (C) Saturated color-bar signal.
Components of NTSC color-bar signal.
NOTE 80
Waveform Distortion When Scope Is Operated at High Gain
Some wide-band scopes distort a chroma waveform when the vertical gain control is set for full-screen deflection. This distortion is caused by vertical-amplifier overloading. In such cases, operate the scope at lower deflection, e.g., at half-screen vertical deflection, to avoid waveform distortion.
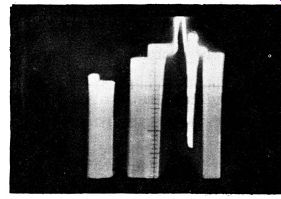
----- Severe overloading of vertical amplifier by chroma waveform.
NOTE 81
60-Cycle Hum in Chroma Waveform
A poor ground connection or heater-cathode leakage in a generator tube sometimes causes 60-cycle hum distortion of a chroma waveform, as illustrated.
---- Undistorted sync and burst waveform.
Waveform distorted by 60-cycle hum voltage.
NOTE 82
Overshoot in Y Signal
The Y signal supplied by a color bar generator sometimes displays noticeable overshoot and traces of ringing; as shown in the following.
This is usually of no concern in practical test work. However, overshoot caused by a generator should not be confused with overshoot introduced by misaligned or misadjusted receiver circuits.
--------- Y signal display with overshoot and ringing.
Y signal display without overshoot and ringing.
+++++++++++
U62
To Expand the Color Burst Display
Equipment: NTSC color-bar generator. Scope with vertical amplifier having flat frequency response through 3.58-mhz.
Connections Required: Connect generator output cable to vertical-input terminals of scope.
Procedure: Carefully adjust the scope sync controls to display the burst on retrace.
Evaluation of Results: The expanded burst appears superimposed on the chroma information. However, details of burst waveform and number of cycles are made apparent.
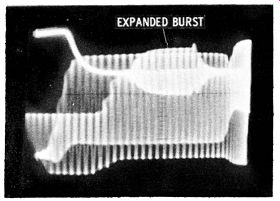
------ Expanded color burst display.
NOTE 83 Scope with Triggered Sweep
A few service scopes of the wideband type have triggered sweep. In such cases, the expanded burst can be further expanded without displaying the burst waveform on a background of chroma information.
Expanded burst displays are useful in checking the adjustments of a color-bar generator. However, an expanded display is not particularly useful for making receiver waveform tests.
NOTE 84
Need for Wide-Band Scope
In some scopes the high-frequency response is not flat through 3.58-mhz.
In this case, the burst frequency may be 3 db, or 6 db down. In such cases, chroma waveforms are distorted, and the subcarrier component is attenuated, as shown. For details concerning scope vertical-amplifier response, see the companion volume 101 Ways to Use Your Sweep Generator.
---- Wide-band scope pattern. Narrow-band scope pattern.
NOTE 85
Stagger-Peaked Scopes
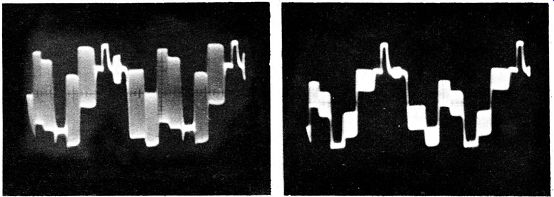
Some wide-band scopes are stagger peaked, with limited vertical-amplifier output capability (limited dynamic range). This causes either the low-frequency component of the chroma waveform to show compression or limiting before the high frequency component is affected, or vice versa. In such cases, the vertical amplifier should be operated below the distortion point in either the LF or HF portion of the waveform. (See the following photos.)
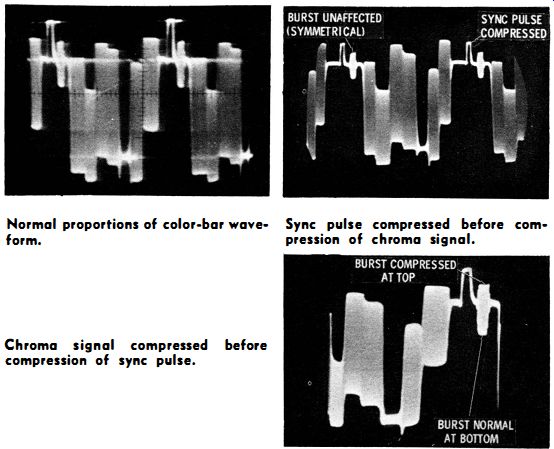
----- Normal proportions of color-bar waveform. Sync pulse compressed before
compression of chroma signal.
------ Chroma signal compressed before compression of sync pulse.
++++++++++++
U63
To Check the Output from a Keyed Rainbow Color-Bar Generator
Equipment: Keyed rainbow generator and wide-band scope.
Connections Required: Apply generator video-frequency output to vertical-input terminals of scope.
Procedure: Adjust scope controls for typical pattern as illustrated in the fo1l6wing. (Generator is adjusted to display a pattern with 11 bursts between horizontal sync pulses.) Evaluation of Results: Standard generators have 11 bursts between sync pulses. The first burst is for color sync lock. The remaining 10 bursts produce 10 color bars on the picture-tube screen of the receiver. The peak-to-peak voltage of the bursts is normally equal to the peak-to-peak voltage of the horizontal sync pulse. Generator adjustments are provided to obtain the correct waveform.
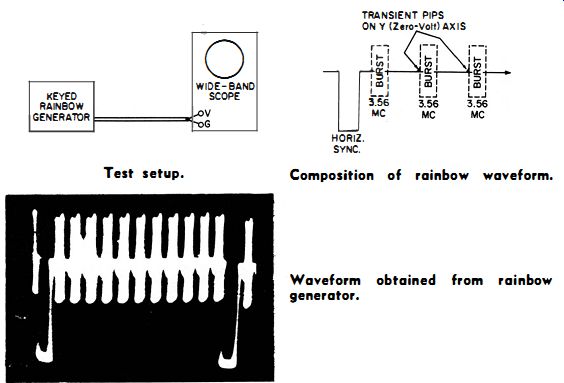
------- Test setup. Composition of rainbow waveform.
------- Waveform obtained from rainbow generator.
+++++++
U64
To Display the Color Signal at the Picture Detector Output (Either Black and White or Color Receivers)
Equipment: 10-to-1 compensated probe and wide-band scope.
Connections Required: Apply probe at signal: output point of picture detector. Connect probe cable to vertical-input terminals of scope.
Procedure: Adjust scope controls for typical pattern display, as shown.
Evaluation of Results: The burst voltage (peak-to-peak) should be equal to the peak-to-peak voltage of the sync-pulse tip.
This test depends upon the availability of an undistorted signal. Properly adjusted generators provide undistorted signals.
The color burst from a TV station is sometimes attenuated because of the receiving antenna characteristic or because of technical difficulties in network transmissions. Therefore, it is preferable to use a color-bar generator in this test. Note also that some color receivers have . vestigial color-sideband IF circuits. This type of IF amplifier normally attenuates the chroma 6 db (50%) .
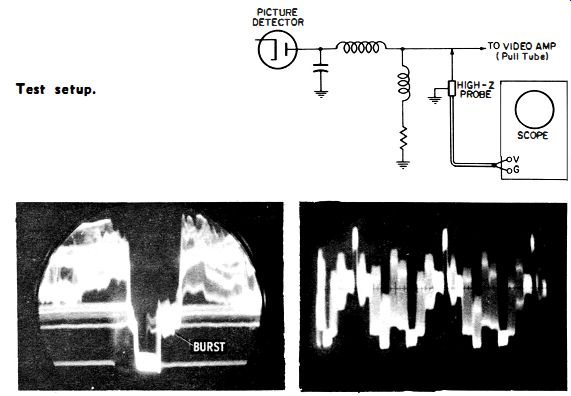
------- Test setup. ----- Burst waveform observed at picture detector from
color TV broadcast.
Cross talk in the color-bar signal at the picture-detector output.
NOTE 86
Precautions When Observing the Burst Signal
When checking the burst, scope connection must be made at point X. It is impossible to observe the burst across the picture-detector load resistor R (at point Y) because the low video frequencies only are developed across the load resistor. The high video frequencies are developed across the shunt peaking coil. Connection can be made across the load resistor for low-frequency tests only, 'as in sweep alignment procedures.
Note that the burst never appears as sharp and clean at the picture detector output as it does when the scope is fed directly from a color-bar generator. Moreover, the burst appears sharper at the picture detector when the receiver is driven from a color-bar generator than when it is driven by an antenna signal. Lack of sharpness is caused by interference components from other circuits and from noise. Compare the following illustration with preceding one.
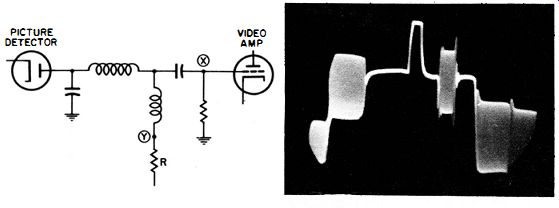
------ Video detector load circuit.
Burst waveform observed when colorbar generator is connected directly to scope.
NOTE 87
Nonlinearity Caused by Receiver Circuits
Color receiver circuits may introduce nonlinearity into waveforms, just as scope amplifiers may. The following illustrations show typical examples of amplitude distortion in a color-bar waveform caused by nonlinear IF amplifiers. Although distortion is present, most viewers do not complain about the resulting picture. Hence, the color-TV technician should determine whether or not certain waveform distortions are tolerable. In the first of the accompanying illustrations, a waveform processed through a linear IF amplifier strip is shown. The second illustration shows the waveform of the color-bar signal after passing through an IF amplifier strip having considerable amplitude distortion.
The burst is a handy guide to distortion of this type. In the third waveform, the opposite type of amplitude distortion appears. Here the sync pulse ( and top of the burst) is compressed instead of expanded.
Also note the ragged edges of the waveform, which show appreciable 920-khz beat voltage is present.
----------- Color-bar waveform processed through a linear IF amplifier
strip. Color-bar waveform showing amplitude distortion in the IF amplifier.
------------ Amplitude distortion with compression of the sync pulse.
+++++++++
U65
To Check the Signal Output from the Y Amplifier
Equipment: 10-to-1 compensated probe. Color-bar generator optional, but gives a steady signal for test, compared with color-TV broadcast signal.
Connections Required: Apply color signal input to antenna-input terminals of receiver. Apply probe at Y -amplifier output.
Connect probe cable to vertical-input terminals of scope.
Procedure: Adjust receiver and scope controls for typical pattern, as shown.
Evaluation of Results: The waveform should appear essentially the same as the Y output taken directly from the generator.
The corners should not be seriously rounded off, and compression should not appear at top or If the color-sub carrier trap is correctly adjusted, little or no chroma signal will appear in the waveform.
A wide-band scope is not required in this test. In most cases, there will be some waveform interference from other receiver circuits (principally the vertical-sweep circuit) . Severe interference often occurs if open test leads are used to the scope.
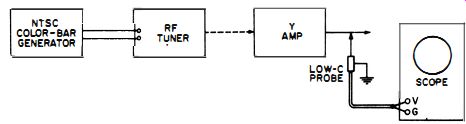
---- Test setup.
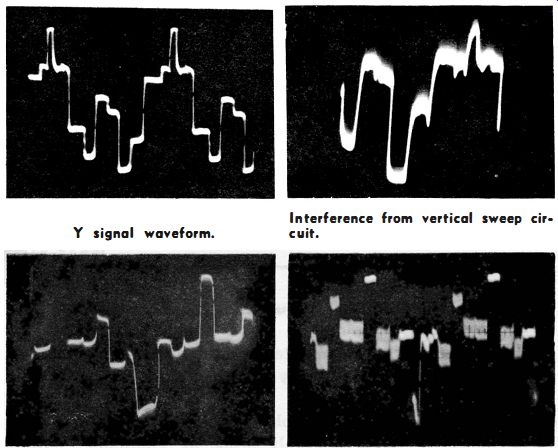
----- Y signal waveform. Y amplifier nonlinear; gray levels in correct.
Interference from vertical sweep circuit.
Y amplifier nonlinear; color-subcarrier trap misadjusted; gray levels incorrect; chroma signal passing through; waveform compressed at top; sync pulse distorted.
NOTE 88
Luminance Test Point
Some color receivers have a luminance test point, which is basically a VTVM test point. The series isolating resistor causes high-frequency attenuation when making scope tests. Make scope check on input side of the 47K-ohm resistor (point A) in the following diagram.
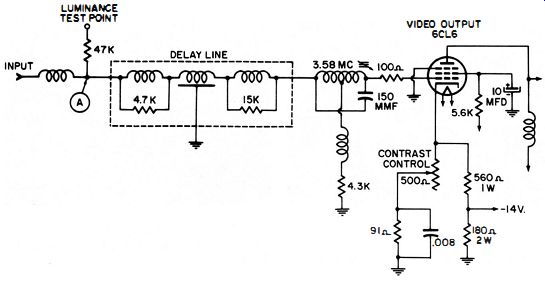
------ Video output circuit.
NOTE 89
60-Cycle Hum and Cross Talk Interference
The waveform at the Y-amplifier output can be greatly thickened, either by cross talk with other receiver circuits 'Or occasionally by 60-cycle hum. Hum voltage usually is caused by heater-cathode leakage in a tube. The following illustrations show the difference in appearance between the two types of interference.
-------- 60-cycle hum interference. Interference from cross talk.
NOTE 90
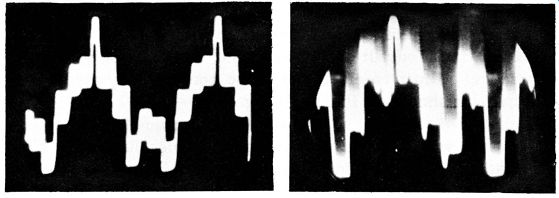
Ringing Caused by Insufficiently Damped Color-Subcarrier Trap
The color-sub carrier trap must be suitably damped with resistance, or it rings excessively on the burst and chroma bars. A trap with very little damping will also ring the sync pulse. (See following illustrations.)
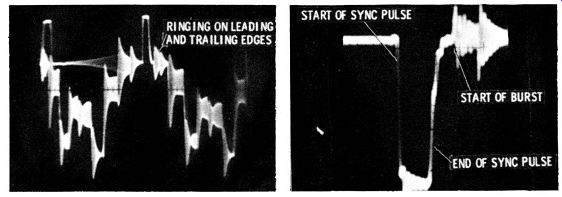
------- Ringing in burst and chroma bars. Ringing of sync pulse
and burst, caused by sharply-tuned subcarrier trap.
+++++++++++++
U66
To Display the Waveform at the Bandpass-Amplifier Circuit
Equipment: 10-to-1 compensated probe and color-bar generator (for steady signal) .
Connections Required: Apply generator output to antenna-input terminals of receiver. Connect probe at bandpass-amplifier output (arm of chroma control in following illustration). Feed probe output to vertical-input terminals of scope.
Procedure: Adjust receiver and scope controls for typical pattern, as shown in the following.
Evaluation of Results: Compare waveform and peak-to-peak voltage value with data in receiver service literature. Note that waveform should be symmetrical, without compression at top or bottom. Correct levels should appear for each chroma bar.
-------- Bandpass amplifier circuit.
--------- Waveform observed at arm of chroma control.
NOTE 91
Noisy Signal Circuits
Noisy signal circuits cause ragged and irregular edges to become quite apparent at the edges of the wave-form,· as shown in the following illustration.
------ Appearance of noise voltages in chroma signal.
+++++++++
U67
To Display the Color-Subcarrier Oscillator Voltage and to Measure Its Peak-to-Peak Value
Equipment: Low-capacitance probe and wide-band scope.
Connections Required: Apply probe between plate of subcarrier oscillator tube and chassis ground. Feed probe output to vertical-input terminals of scope.
Procedure. Adjust scope controls for display, as shown.
Evaluation of Results: If oscillator is dead, no waveform is obtained. A sine waveform shows the oscillator is operating.
Peak-to-peak voltage value should be within 20% of value specified in receiver service literature.
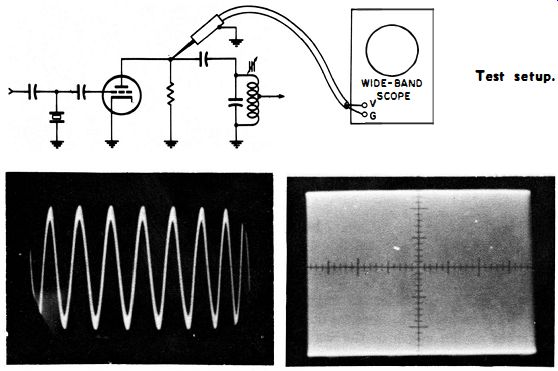
-------- Test setup.
---------- Pattern displayed at high-speed horizontal sweep. sweep speed.
Pattern displayed at lower horizontal
+++++++
U68
To Check the Burst-Gating Pulse and to Measure Its Peak-to-Peak Voltage
Equipment: Low-capacitance probe.
Connections Required: Apply probe between gated electrode of burst-amplifier tube and chassis ground. Feed probe output to vertical-input terminals of scope.
Procedure: Adjust scope controls for typical pattern shown in the following illustration.
Evaluation of Results: Check waveform and peak-to-peak voltage against data in receiver service literature. In some receivers, the gating pulse is applied to the cathode instead of to the screen, as shown in the following schematic.
NOTE: A wide-band scope is not necessary for this test.
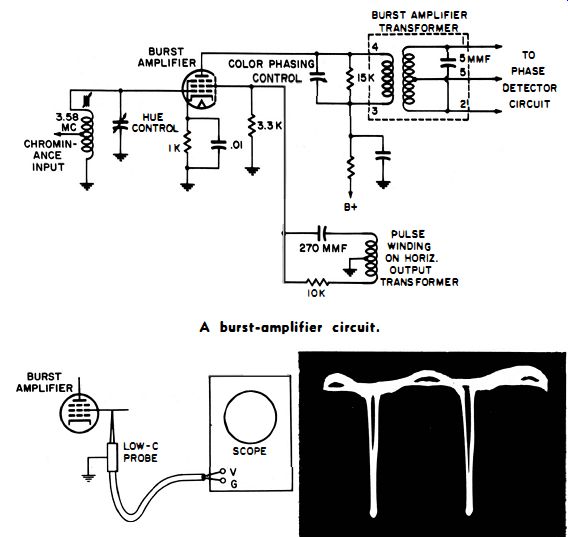
--- A burst-amplifier circuit. -------- Test setup. Appearance of the burst
gating pulse.
+++++++++
U69
To Display the Waveform at the Output of the Burst Amplifier and to Measure Its Peak-to-Peak Voltage
Equipment: Low-capacitance probe and wide-band scope.
Color-bar generator will supply a steady signal for test.
Connections Required: Apply color-bar generator output to antenna-input terminals of receiver. Connect probe between output terminal of burst amplifier and chassis ground. Feed probe output to vertical-input terminals of scope.
Procedure: Adjust receiver controls and generator for normal color-bar signal display. Adjust scope controls for typical burst pattern, as shown.
Evaluation of Results: The burst should appear free from chroma signal. The top should not be clipped diagonally. Amplitude nonlinearity is often apparent, but is not a cause for concern. Peak-to-peak voltage of the waveform should be within 20% of value specified in receiver service literature.
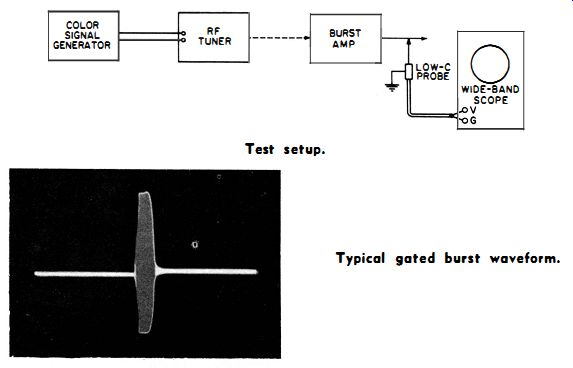
--------- Test setup. Typical gated burst waveform.
++++++
U70
To Check the AC Waveform at the Arm of the Burst-AFC Balance Control
Equipment: Low-capacitance probe. Rainbow or color-bar generator will supply a steady signal.
Connections Required: Apply generator output to antenna-input terminals of receiver. Connect probe between potentiometer arm and chassis ground. Feed probe output to vertical-input terminals of scope.
Procedure: Adjust generator and receiver controls for screen pattern on color picture tube as shown in the following.
AC waveform is found in this test when receiver is out of color sync. Adjust scope controls for typical pattern, as shown.
Evaluation of Results: Waveform must be evaluated on the basis of experience. Waveform can be subsequently checked through the burst-AFC output network to analyze certain faults causing loss of color sync.
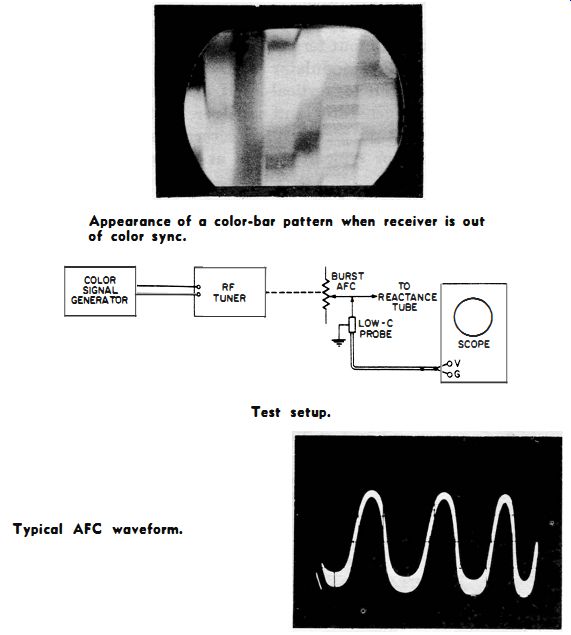
------ Appearance of a color-bar pattern when receiver is out
of color sync. ------ Test setup. Typical AFC waveform.
++++++++
U71
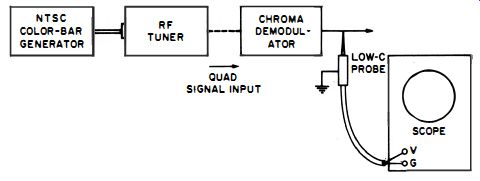
To Check the Output from a Chroma Demodulator with a Rainbow Signal Generator
Equipment: Rainbow generator (preferably crystal controlled) and low-capacitance probe.
Connections Required: Apply modulated RF output from generator to antenna-input terminals of receiver. Connect probe between chroma-demodulator output and chassis ground.
Feed probe output to vertical-input terminals of scope.
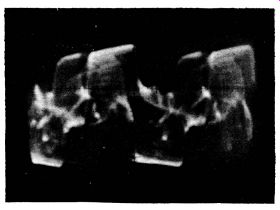
Procedure: Adjust generator and receiver controls for normal rainbow display on picture-tube screen, as shown. Adjust scope controls for typical pattern, as illustrated in the following.
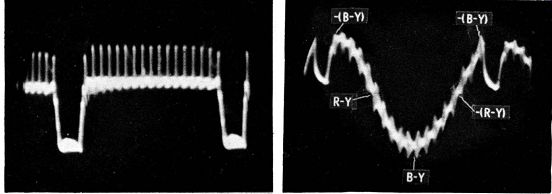
Evaluation of Results: A basic sine waveform is displayed, with either a blanking pulse or a boost pulse, depending upon the receiver design. The pulse marks the sync and burst interval and indicates the phasing of the demodulator axis.
The relative heights of the sine-wave patterns from the two demodulators show the chroma-channel gains. Check against receiver service data. The same test method applies to R-Y, B-Y; R-Y, G-Y; IQ; R-Y, Q; or XZ de-modulators.
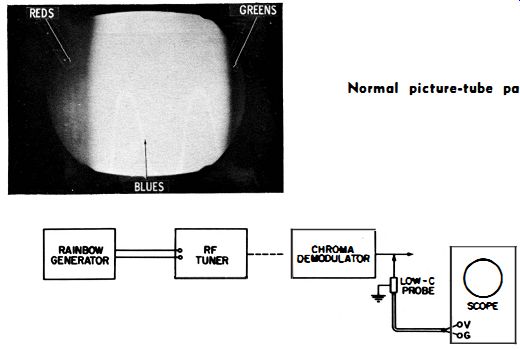
--------- Normal picture-tube pattern. Test setup.
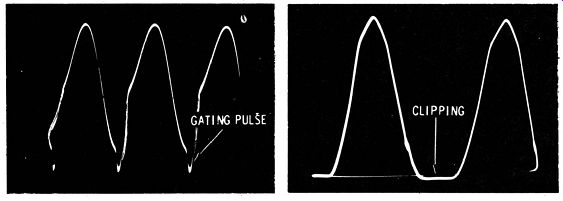
------ Correct rainbow signal output from a B-Y chroma demodulator.
NOTE: The gating pulse appears properly at the - (B-Y) phase.
Flattened (clipped) pattern which results if receiver signal circuits are overloaded.
NOTE 92
Connecting Probe at Output of Chroma Demodulator Circuits
Peaking coils in the chroma demodulator output circuits serve a filtering function, as well as maintaining the frequency response at the high end of the chroma response. If a wide-band scope is applied at the input side of the peaking coils, a large amount of 3.58-mhz voltage will be present. On the other hand, a clean demodulated wave-form is found on the output side of the peaking coils.
If the probe is connected to point A. in the following schematic, a suitable signal output for a narrowband scope is obtained. However, if a wide-band scope is connected to this point, excessive 3.58-mhz interference will appear in the waveform.
A wide-band scope should be connected to point B for checking the R-Y signal. At point B the 3.58-mhz signal has been filtered out by the choke coil. For the same reason, a narrow-band scope should be connected to point C and a wide-band scope should be connected to point D when checking the B-Y signal.
When checking the G-Y signal, the scope can be connected to either point E or point F, using either a narrow-band or a wide-band scope,
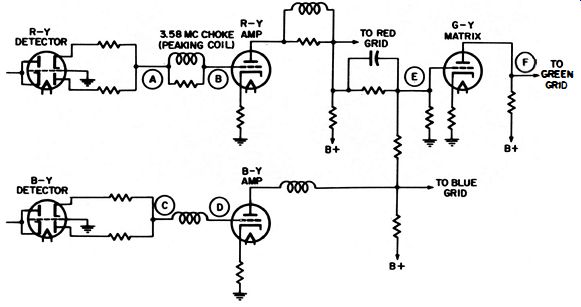
------ Chroma demodulator output circuit.
+++++++
U72
To Check Adjustment of the Quadrature (Subcarrier Phasing) Transformer with a Rainbow Generator
Equipment: Rainbow generator (preferably crystal controlled). Connections Required: Apply modulated RF output from generator to antenna-input terminals of receiver. Connect vertical input terminals of scope to output of R-Y channel in receiver. Connect scope horizontal-input terminals to output of B-Y channel in receiver.
Procedure: Adjust generator and receiver controls for normal rainbow pattern on screen of color picture tube. Adjust vertical- and horizontal-gain controls of scope to obtain a circular pattern, as shown in the first illustration.
Evaluation of Results: If inclined ellipse is displayed, adjust slugs in subcarrier phasing transformer until a nearly perfect circle can be obtained. Note that small distortions in the receiver circuits prevent display of a perfect circle, but distortion should not be excessive.
If the receiver is out of color sync, the pattern whirls and appears as shown in the second waveform. However, the pattern has the same contour and is equally as useful as a pattern in color sync for checking quadrature.
Overload of the signal circuits should be avoided. If the receiver signal circuits are overloaded, the pattern becomes distorted, as shown in the third illustration. This is a typical display obtained when the chroma circuits are over-loaded and color sync is lost.
Receivers using a G-Y detector must be checked through the B-Y matrix. For this type of receiver, connect horizontal-input terminals of scope to the output of the B-Y matrix.
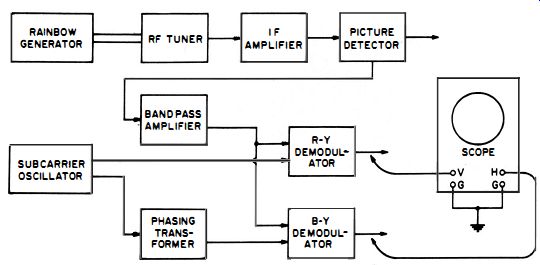
---------- Test setup.
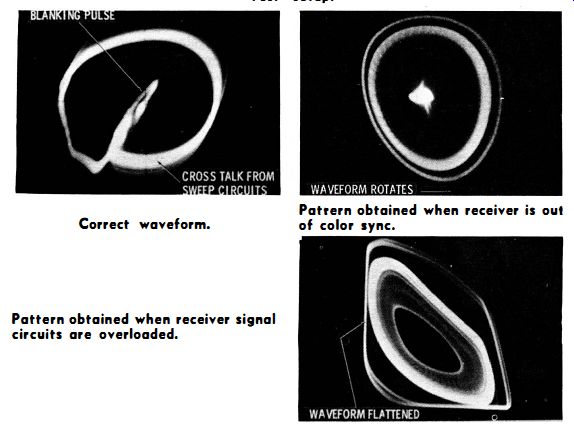
--------- Correct waveform.
Pattern obtained when receiver signal circuits are overloaded.
Pattern obtained when receiver is out of color sync.
NOTE 93
Appearance of a Burst-Boost Pulse
In some color receivers, a burst-blanking pulse does not appear in the patterns displayed at the outputs of the chroma demodulators.
Instead, a burst-boost pulse appears.
The burst-boost pulse has the appearance of a "blowout" from the circular or elliptical pattern, as shown in the following waveform.
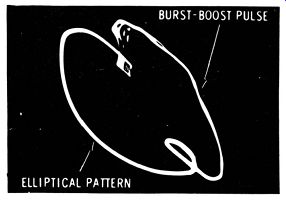
---------- Burst-boost pulse.
NOTE 94
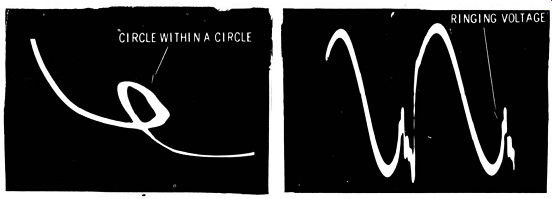
Ringing in Circle Pattern Tests
When making circle-pattern tests of chroma-demodulator output, circles within circles can sometimes be seen, as illustrated. The small circle or closed loop in the waveform is caused by ringing in the demodulator output signals. The ringing voltages are relatively small and, hence, form small circles or closed loops.
These voltages form perfect circles if their phase difference is exactly 90°.
---------
------ Appearance or ringing in circle-pattern tests.
+++++++
U73
To Check the Adjustment of the Quadrature (Subcarrier Phasing) Transformer with an NTSC Color-Bar Generator
Equipment: NTSC color-bar generator and low-capacitance probe.
Connections Required: Apply modulated RF output from generator to antenna-input terminals of receiver. Connect probe at chroma demodulator output. Feed probe output to vertical-input terminals of scope.
Procedure: Adjust generator and receiver controls for normal color-bar display on screen of color picture tube. An R-Y or B-Y demodulator can be checked with simultaneous R-Y B-Y bar output from generator. A G-Y demodulator is checked with a G-Y/90 ° signal. I and Q de-modulators are checked with a simultaneous IQ bar output.
R-Y and Q demodulators are checked with B-Y and I signals. X and Z demodulators must be checked indirectly.
Evaluation of Results: A chroma demodulator should null on a quadrature signal. Perfect nulls are not obtained. There is a transient disturbance at the beginning and at the end of the null signal.
Either positive or negative R-Y, B-Y, or G-Y/90° signals from the generator may be used for the null test.
------ Test letup.
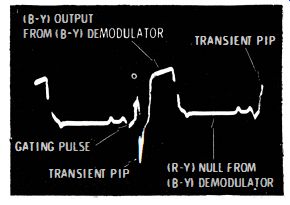
-------- B-Y demodulator output signal waveform.
NOTE 95
Lost Color Sync Gives Faulty Null Test with NTSC Signal
The receiver must be in color sync to obtain a useful null test when an NTSC-type generator signal is used. On the other hand, the receiver can be out of color sync and a useful test will be obtained when a rainbow signal is used. The following illustration shows the blurred and confusing pattern obtained with an NTSC signal when color sync is lost.
--- Pattern obtained with an NTSC signal when color sync is
lost.
NOTE 96
Clue to Signal. Circuit Alignment
The shape of the output waveform from the chroma demodulator often gives a clue concerning signal-circuit alignment. As shown in the following illustration, the chroma-bar output from an NTSC generator has flat tops and square comers, without overshoot or ringing. When the receiver signal circuits are properly aligned, the output waveform from a chroma demodulator is flat-topped.
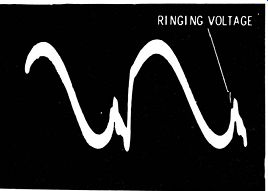
The comers of the waveform are somewhat rounded, but there is no ringing or overshoot. On the other hand, peaked signal circuits cause ringing and overshoot, as shown in the following illustration. When the chroma signal falls on a steeply sloped response curve, the resulting phase shift causes a tilt in the top of the demodulated waveform, as illustrated.
--------------152 Waveform from color-bar generator.
Overshoot and ringing, caused by sharply peaked signal circuits.
Ringing in demodulator output wave· form, caused by sharply peaked signal circuits.
Tilt in chroma demodulator waveform, caused by phase shift resulting from inaccurate alignment of signal circuits.
+++++++
U74
To Mark the Output from a Chroma Demodulator with a Rainbow-Crosshatch Generator
Equipment: Combination rainbow and crosshatch generator (such as Hickok 660) and low-capacitance probe.
Connections Required: Apply simultaneous rainbow and crosshatch from generator to antenna-input terminals of receiver.
Connect probe at chroma demodulator output. Feed probe output to vertical-input terminals of scope.
Procedure: Adjust generator and receiver controls for display of rainbow and crosshatch pattern on picture-tube screen.
Adjust scope controls for typical pattern, as shown in the accompanying waveforms.
Evaluation of Results: The crosshatch vertical bars feed through the bandpass amplifier as marker pips. The pips are useful landmarks for identification of basic chroma axes, as shown in the following illustration.
---- Pattern when color intensity control is turned down. Effect
on pattern when color intensity control is turned up.
NOTE 97
Checking the Output from the Chroma Matrix
The output from the matrix can be checked in the same manner as the tests outlined in U71, U73, and U74.
Connect the scope to the matrix output instead of to the demodulator.
The waveform observed will be the same as the corresponding wave-form in the demodulator circuit.
NOTE 98
Keyed-Rainbow Signal Used to Check Matrix Operation
A keyed-rainbow signal is used to check matrix operation in the same manner as for chroma demodulators.
Thus, the patterns shown in U75 apply to a G-Y matrix as well as to a G-Y demodulator. Likewise, the patterns apply to a B-Y matrix as well as to a B-Y demodulator.
++++++++++
U75
To Check the Output from a Chroma Demodulator with a Keyed-Rainbow Signal
Equipment: Keyed-rainbow generator and low-capacitance probe.
Connections Required: Apply output from generator to antenna-input terminals of receiver. Connect probe at chroma demodulator output. Feed probe output to vertical-input terminals of scope.
Procedure: Adjust generator and receiver controls for normal chroma-bar display on picture-tube screen. Adjust scope controls for keyed sine-wave pattern, as shown in the following diagram.
Evaluation of Results: Null points for the various types of chroma demodulators are indicated. If null is correct from one demodulator, but is incorrect from the other demodulator, the quadrature (or subcarrier phasing) transformer requires adjustment. The relative heights of the keyed sine waveforms indicate the relative output levels of the two demodulators. Compare levels with data in receiver service literature.
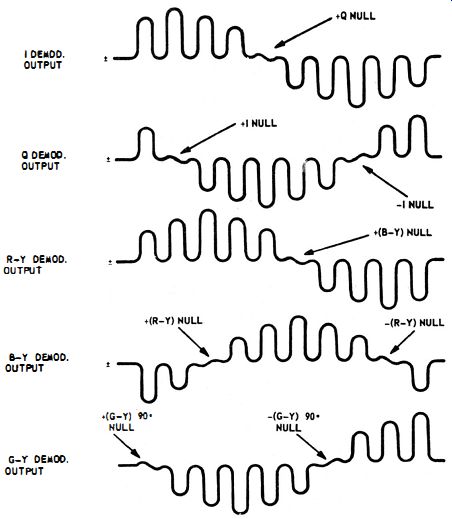
-------- Correct nulls for a standard 1 O-bar keyed rainbow signal.
NOTE 99
Null Checks of X and Z Demodulators
When making null checks of X and Z demodulators, proceed as for R-Y, B-Y, G-Y, I, or Q demodulators.
However, do not apply probe to the output of the X or Z demodulator.
Connect probe at output of R-Y, G-Y, or B-Y amplifier as shown in the following illustration (points A, B, and C) .
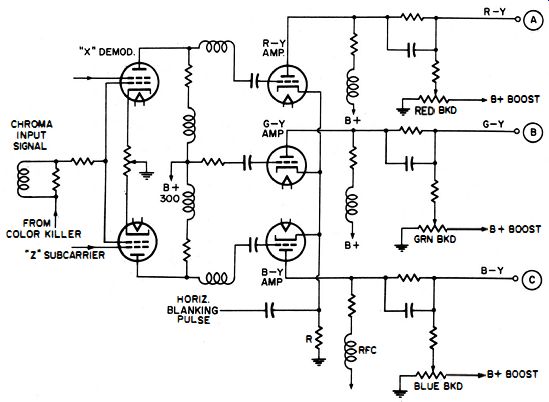
------- X and Z demodulator circuit.
NOTE 100
Checking the Chroma Circuits by Themselves
To check operation of the chroma circuits by themselves without taking the RF and IF circuits into account, inject the video-frequency output from the generator at the picture-detector output. NOTE: Correct polarity of video signal must be used; otherwise, bar patterns will have incorrect hues, and horizontal sync will be poor or absent. Some receivers, such as the Silvertone models, have separate Y and chroma detectors. In such cases, chroma tests are made by injecting the signal at the "chroma test point" provided in the chroma-detector output circuit.
On the other hand, luminance tests are made by injecting a signal at the "luminance test point" provided in the picture-detector output circuit. Where both chroma and luminance information are required, these two test points are connected, as specified in the receiver service literature. Hence, unless you know the receiver, consult the service literature before making video frequency tests.
++++++++
U76
To Check the Chroma Decoupling Circuits
Equipment: Low-capacitance probe and color signal generator.
Connections Required: Apply modulated RF output from generator to antenna-input terminals of receiver. Connect probe across decoupling capacitor in chroma circuit. Feed probe output to vertical-input terminals of scope.
Procedure: Adjust generator and receiver controls for normal display on picture-tube screen. Adjust scope controls for typical patterns, as shown.
Evaluation of Results: The peak-to-peak AC voltage across the decoupling capacitor should not exceed a maximum tolerable value. Values are not given in receiver service notes, but may be determined by comparison tests in a receiver of the same type and in good operating condition.

---------- Test setup.
-------- Ripple on B + lead to chroma section of a color-TV receiver. Change in ripple waveform on B + lead to chroma section when receiver is out of color sync.
+++