[adapted from 1996 Stereophile Guide to Home Theater (SGHT) article]
All of my comments on the three video projectors reviewed in this issue refer
to viewing them either as delivered (the Sony, with only minor tweaking of
the internal controls to correct for a slight but visible excess of green),
or as set up at our facility by a manufacturer’s representative (the Vidikron
and the Runco).
Toward the end of the review period, SGHT acquired a Philips color analyzer that includes a single-sensor head (for use with single-piece direct-view and rear-projection televisions) and a special three-sensor head designed for use with typical three-lens video projectors. Thus equipped, we set out to measure the color temperature produced by the projectors. In particular, we wanted to measure how consistently each projector’s color temperature tracked across the full gray scale, from bright-white to near-black.
Ideally, the color temperature of a video display should be 65000 Kelvin at al/levels of gray. In reality, few consumer display products, even after proper calibration, are capable of producing a truly flat gray scale; with most of them, the color temperature deviates above and below 6500° Kelvin at various levels of gray, producing a curve when graphed. A few, generally expensive consumer monitors can do surprisingly well—for example, the Toshiba CN35D90. But most video displays capable of near-perfect gray-scale tracking are professional direct-view monitors used in video production facilities. Unfortunately, such sets are limited to 19-inch screens and carry hefty 5-figure price tags.
Generally speaking, the gray scale tracking of even the most expensive video projector is not as consistent as a direct-view television capable of proper calibration. Given that projectors must operate at the edge of video technology just to get reasonably bright, sharp, viewable pictures on a big screen, this is not surprising.
There are also practical problems involved in measuring a two-piece video-projection system that do not exist with conventional direct-view and rear-projection sets. To understand the results presented in the reviews, it helps if you understand how the measurements were obtained.
-----Light output is measured with a highly accurate Minolta LS-100 foot-lambert
meter.
Analyzing the analyzer
When used with its single-head sensor on a one-piece television, the Philips color analyzer offers two display modes. The first is called RGB mode, which uses three bar graphs to show the amount of red, green, and blue light falling on the sensor. With the analyzer set for a white-level reference of 6500° Kelvin (more on this topic later), the bars should read equally for all three colors. (Actually, it’s a bit more complex than that. The amounts of red, green, and blue for the correct color temperature are not identical in value, but the analyzer “normalizes” them to identical values for ease of use. Also, there are different RGB bar- graph options other than a straight RGB display, wherein two of the primary colors are related to the third. But these details are not vital to understanding what follows.)
The second display mode is a 2-dimensional XY diagram with the target color reference shown as a small box. The regions of excess red, green, and blue are clearly shown on the diagram; an indicator dot gives the current position of the white level. The object here is to place the dot within the reference box. This is known as the CIE mode. (CIE stands for Commission Internationale de l’Eclairage, a committee that in 1931 developed a graphical method of quantifying light and color in mathematical terms. This is called the CIE Chromaticity Diagram, of which the X diagram in the CIE mode is a representation. The CIE diagram is actually three-dimensional—the Z-axis is intensity. But the most important information it provides lies in the XV plane, which is why it is usually seen as a two-dimensional graph.)
The CIE mode is by far the most intuitive to use. Furthermore—and this is an important point—it is the only mode that actually gives a direct read out of the color temperature. Used in conjunction with the single-cup sensor (which is simply placed against the center of the CRT or rear-projection TV screen), the CIE mode makes it straightforward to obtain color-temperature readings from direct-view or rear-projection TVs.

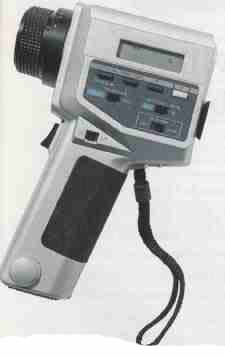
------The Philips color analyzer is shown here with the single-sensor head
used to measure one-piece TVs.
One additional point should be made here, which can be a bit difficult to grasp. On the CIE diagram, 6500° Kelvin is not a point, but a line. Obviously, we are aiming for a particular point on this line when we calibrate a 1-piece television or video projector. This reference point is known as D6500, and is specified by a particular set of CIE coordinates (X = 0.313, Y = 0.329).
Three-headed monster
Obtaining color-temperature readings from a two-piece video-projection sys tern is anything but straightforward. In the case of the most common front-projection setup, you can’t place the single- sensor head of the color analyzer directly against the screen—you’d be blocking out the light you want to measure! To obtain a reading, yon must measure the output of each of the three CRTs individually, which requires a special three-head sensor. However, the three-head sensor can only be used in the color analyzer’s RGB mode.
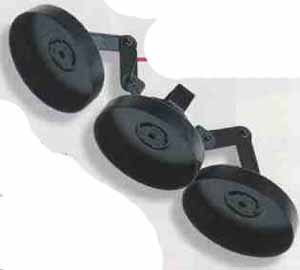
------The three-head sensor is used with the color analyzer to measure CRT type projectors
Okay, so we pop the three-head sensor over the projector lenses, tweak our internal controls (for the top end of brightness, three “drive” controls each for R, G, and B; for the bottom end, three “screen” controls each for R, C, and B), and we’re done, right?
Sort of. With a two- piece projection system, there’s an added complication: the screen. With one-piece direct-view and rear-projection sets, we can use the single-cup sensor to compare the white light coming off the TV screen against the analyzer’s internal white reference of D6500. We can do the same thing with a two-piece projection system using the three-cup sensor. However, placing the sensor over the projector’s lenses cuts the screen out of the equation, and the screen definitely affects the gray scale. What to do?
Before using the three-head sensor, the analyzer must have a new white reference, one that includes both the screen and the characteristics of the phosphors in the specific projector.
(The analyzer provides additional calibration memories for such user-established white references.) There are two ways to perform the white-reference calibration.
The first method uses an additional tool called a color comparator, which has its own internal D6500 light source. The comparator has a transparent window, through which both the internal light source and the screen image are visible simultaneously. The screen image is one of the mid- level, so-called “IRE” windows (a white rectangle on a black back ground) from the laserdisc A Video Standard.
Using the projector’s internal drive and screen controls, the projected white is matched as closely as possible to the calibrated white light generated inside the color comparator. This set ting is then memorized on the color analyzer as the “reference white.” Based on this reference, the analyzer automatically establishes the white level for all illumination levels.
The second method uses an accurately calibrated, direct-view TV in stead of a color comparator. After matching the white level on both the direct-view set and the projector using the same IRE window, this white reference is memorized in the color analyzer. (It is necessary to reduce the contrast of the direct-view set to the same level as the video projector, at which point the color temperature of the direct-view TV must be rechecked to ensure that it has not shifted from the desired value of D6500.)
An eye for color
It is clear from the preceding discussion that the entire calibration process with a two-piece projection system depends on the installer’s skill in matching the known white reference— color comparator or calibrated monitor—to the image on the screen. (Of course, it also depends on the accuracy of the “known” white reference itself.) The color analyzer is only as accurate as the new white reference calibrated into it. Any way you slice it, there is much more subjectivity and skill involved in setting the gray scale on a video projector than on a one-piece set.
I used both methods of establishing a white reference, but I ultimately preferred the results using an accurately calibrated direct-view TV as a reference—in this case a Toshiba CN35D90. Using the color comparator to calibrate the Runco (which had the best gray scale tracking of all the projectors here), there was a subtle but noticeable (and distracting) yellowish color shift, while nothing was visually amiss after calibration with the monitor-established white reference.
Presenting the results
When an installer sets up a projection system in a client’s home, once a white reference has been established, the projector can be accurately calibrated using the three bar graphs presented on the color analyzer in RGB mode. Our case is a little different. We are trying to present the results to you in a meaningful, quantitative fashion—in other words, plotted on a graph. Remember, the RGB bar-graph scale used with the three-head sensor does not provide actual color-temperature readings; it only gives the variance above or below the white reference level for that color. Although this information can be presented graphically, it is not as relevant or useful as a straightforward plot of color tempera ture, which is easily obtainable from one-piece TVs.
Our friends at the Imaging Science Foundation (ISF) suggested two methods to handle this predicament. First, take the readings from the red and blue bar graphs on the analyzer at each step of the gray scale. (The RGB mode we used relates the red and blue levels to the green, so the latter reading remains fixed in value). Although we won be presenting it in the magazine, I went ahead and recorded this data anyway; perhaps we’ll find a use for it in the future.
The second method suggested by the ISF uses the analyzer in the CIE mode with the single-sensor head attached. The sensor cup is held at the center of the screen and aimed back at the projector. With the appropriate IRE window displayed, and without any other sources of light in the room to affect the result, this should give a usable color-temperature reading. Note the use of the term “usable.” The result is not an accurate, absolute color-temperature reading for two reasons: the sensor was not designed to be used in this way, and the screen is not included in the measurement. Nevertheless, these readings provide useful information about how well the projector tracks the gray scale from one light level to the next. This is the result we have chosen to present graphically in our projector reviews, using a modified version of an ISF chart.
You will see no “before” results in our charts showing the grayscale tracking of two-piece, video-projection systems. [ will, however, print “before” curves whenever possible for 1-piece sets]. In the case of the Vidikron and Sony projectors reviewed in this issue, it was necessary to physically adjust several internal potentiometers to establish the new white reference needed to make the final, calibrated measurements. To measure the “before” condition, it would then be necessary to physically reset these pots to where they had been. It is impossible to do this without getting deeper into the circuitry than we felt it prudent to go.
In any event, proper calibration of any video projector during setup should be considered mandatory, making the as-delivered condition less important than how accurately it tracks the gray-scale after calibration. Not all installers take the rime to do this properly, but it’s worth the trouble to find one who will and who has the proper tools to do it right.

-----The optical comparator is used to set a new white reference that takes
the characteristics of the screen and CRT phosphors into account.
= = = Light Output = = =
All of the projectors reviewed in this issue were measured at a post-calibration light output of between 7 and 8 foot-lamberts, using a 4:3 image, 60 inches wide, centered on an 84-inch wide Stewart Studiotek 130 screen (gain 1.3). All of the projectors were capable of somewhat higher output than this, particularly the Runco, but with slightly degraded picture quality due to the gradual onset of blooming, Measuring the available light output from any one piece television or video. All of the projectors reviewed in this issue were measured at a post-calibration light output of between 7 and 8 foot-lamberts, using a 4:3 image, 60 inches wide, centered on an 84-inch wide Stewart Studiotek 130 screen (gain 1.3). All of the projectors were capable of somewhat higher output than this, particularly the Runco, but with slightly degraded picture quality due to the gradual onset of blooming.
Measuring the available light output from any one piece television or video projector, even with an accurate foot-lambert meter (we used the Minolta LS-100) is a very subjective business. Visible blooming does not happen instantaneously at a given light out put; there is almost always a broad range within which judgments must be made on light output vs. picture quality.
Although the light output used here might seem low, in a properly darkened room I was only occasionally tempted to push things a little harder to get a brighter image. With the Runco, but with slightly Although the light output degraded picture quality used here might seem low, due to the gradual onset of in a properly darkened blooming, room I was only occasionally tempted to push things a light output from any one- little harder to get a piece television or video brighter image. With the Runco, for example, even when changing to a widescreen, 16:9 image (which makes it harder for the projector to produce the same measured light output), I was able to get 10 foot-lamberts output at the center of the screen with no obvious image degradation. But on close observation, backing off the contrast a bit did make details in the picture a little sharper.
As an important aside, if you use a multi-aspect-ratio projector such as the Runco, you should set the maximum usable light output with a 16:9 image, then set the contrast with a 4:3 image to provide the same maximum out put (assuming the projector allows separate adjustment of these two parameters as the 980 does).The 4:3 image will be capable of more linear light output, but if you don’t push it, you will minimize the chances for premature wear or burn-in to the 4:3 area. (Any reasonable light meter can be used to do this; you are looking to match output levels, so only relative values are important.)
== == ==
[adapted from 1996 Stereophile Guide to Home Theater (SGHT) article]