3. Magnetic Heads
Although magnetic tape is covered in a later section, the following discussion of magnetic heads requires a few very simple assumptions regarding the composition and dimensions of the magnetic tape. First, assume that the magnetic coating consists of microscopic particles of magnetic materials that have been bonded to one surface of a thin plastic backing or substrate. Second, each magnetic particle is assumed to function as a small independent magnet, allowing patterns of varying magnetic polarity and intensity to be stored along the tape. Last, the thickness of the magnetic coating for the audio tape example will be assumed to be 0.6 mil (15 µm).
3.1 Geometric Characteristics
Most of the characteristics of magnetic heads are controlled by the geometry of the head and the magnetic tape. Since wavelength on tape is determined by the recorded frequency in hertz and the relative tape-to-head speed, there can be many combinations of frequency and speed that will result in the same effects in a head. For example, the wavelength of a 15 kHz tone on a mastering recorder at 15 in/s will have the same wavelength as a 240 kHz signal on a high-speed tape duplicator running at 240 in/s. The geometric considerations for both applications are identical, despite the 16:1 difference in tape speed.
Not all of the characteristics are geometric, however. Eddy current losses, for example, depend on the frequency in Hz rather than the wavelength.
3.1.1 Gap Length Loss
Each of the tiny magnetic particles on the surface of the tape produces a magnetic force or flux in the space surrounding the particle. This invisible magnetic effect, called a magnetic field, will interact with other nearby magnetic particles. To measure the strength of this field, a flux concentrator in the form of a reproduce head is scanned along the tape. The resulting electrical output from the head is dependent on the flux pattern recorded on the tape.
The reproduce head must be able to collect flux selectively from a very small span of tape. For example, flux patterns on a compact cassette may be as small as 100 millionths of an inch (100 × 10^-6 in or 2.5 µm) in wavelength. To achieve this fine resolution, a small gap must be created in a ring of magnetic material, as shown in FIG. 14A.
The length of the gap ranges from two ten-thousandths of an inch (2 × 10^-4 inch or 5 µm) for studio mastering recorders down to less than 30 millionths of an inch (30 × 10^-6 inch or 0.75 µm)-the wavelength of red light for cassette and high-density digital recorders.
Since no slicing technique is available to cut accurate gaps that short, the core is usually fabricated as two pole pieces that are fastened together with a shim spacer of the desired dimension inserted in the gap. FIG. 14B shows a typical studio head core drawn full size, with the critical gap area at the pole tips and adjacent tape magnified in FIG. 14C.
The operation of the gap, which serves as a sensing aperture, can be analyzed in terms of a flux pickup focused at the surface of the tape. The amount of flux picked up by the core, and thus made available to generate an output voltage in the winding, is determined by the net magnetic flux from pole tip to pole tip across the gap area. If the tape segment at the gap consists of a strong magnetization of only one polarity, the flux in the core will be maximized. If, on the other hand, the segment contains two strong portions of opposite polarity that cancel each other, the net flux in the core will be zero.
-----------------
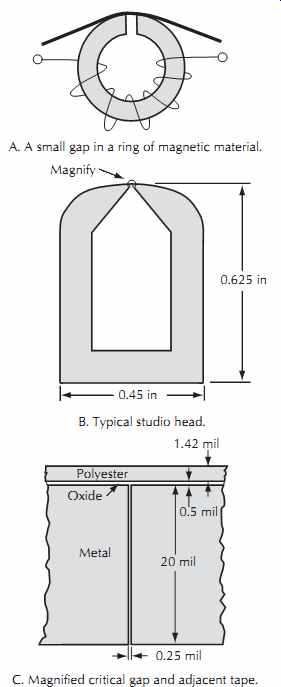
FIG. 14. Ideal and practical magnetic heads.
Metal Polyester Oxide
0.5 mil 1.42 mil 20 mil
0.25 mil Magnify
0.625 in
0.45 in C.
Magnified critical gap and adjacent tape.
A. A small gap in a ring of magnetic material.
B. Typical studio head.
----------------
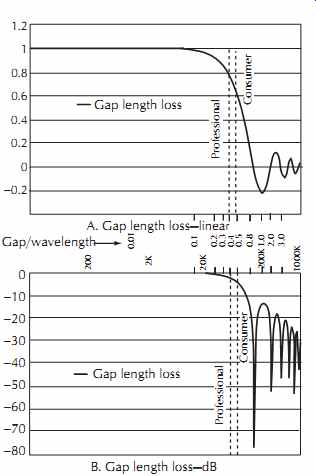
FIG. 15. Loss due to gap length and the ratio of gap length to wavelength.
--------------------
The efficiency of the gap due to this averaging effect is illustrated in FIG. 15. The output of the head declines, slowly at first, and then quite rapidly to zero as the wavelength decreases to the length of the gap. As the gap length becomes longer than the wavelength, an output of opposite polarity appears. When the wave length drops to half the gap length, another null will occur. This pattern of diminishing peaks of alternating polarity is repeated over and over, with nulls occurring at each wavelength that produces an odd or even number of complete cycles in the gap.
The example recorder at 15 in/s has only 1 dB of gap length loss at 40 kHz and 3 dB at 67 kHz, certainly not a dominating loss. At 30 in/s these losses become even more insignificant, with the _1dB and _3 dB frequencies doubling to 80 kHz and 134 kHz.
Audio recorders are seldom designed to operate beyond the dashed lines shown in FIG. 15. With this constraint, gap length loss for professional machines can be held below 1 dB or 2 dB by choosing an appropriate gap length for a given application and minimum wavelength. Mastering recorders operating at 15 in/s and 30 in/s and broadcast machines operating at 7.5 in/s have playback gaps ranging from 100-200 µinch, compact cassette machines operating at 1 in/s have gaps of 30-60 µinch.
Mastering recorders may also use the record head for playback in the sync mode. Since the record heads may have gaps ranging from 250 µinch to 1000 µinch, the sync response may suffer significant high-end loss. For example, a 1950s vintage recorder with a 1000 µinch record gap will reach its first null at 15 kHz for a tape speed of 15 in/s. As sync response became more important in the mid 1960s the recorder manufacturers tightened up the record gaps to 350 µinch or less to improve sync response.
If the gap length is inferred from the first measured null, this effective gap length may be 10% to 15% longer than the mechanical gap determined by the shim.
Various proposed explanations include magnetic degradation of the inner surfaces of the pole tips due to manufacturing stresses and pole tip saturation. When in doubt, add 10% to the optically measured length or shift the response points down to 91% (1/1.1) of the theoretical values. For the ATR100 example, the _1dB and _3 dB points would shift to 36 kHz and 61 kHz.
Use of an excessively short gap will cause an additional loss in overall head sensitivity due to shunted flux that jumps the gap rather than traveling through the core, as shown in FIG. 16. For this reason, the repro duce head gap length is usually chosen to give the largest acceptable loss at the shortest expected wave length.
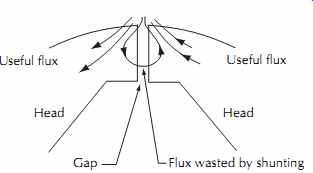
--------- FIG. 16. Gap shunting loss.
Useful flux Head Head Gap Flux wasted by shunting Useful flux
----------
3.2 Spacing Losses and Thickness
The recording process magnetically aligns groups of the tiny randomly oriented magnetic particles so that they act as if they were a single larger particle. We could visualize these groups as little bar magnets that have dimensions determined by the tape and signal. The track width defines the vertical direction and the tape coating thickness sets the depth. The length is determined by the wavelength of the recorded signal. To simplify the example, assume that a 1.5 kHz square wave is recorded at a tape speed of 15 in/s, yielding a wavelength of 10 mils or 0.010 in. The recorded image is similar to a series of bar magnets each 5 mils long with alternating polarity.
Actually, gap length loss and shunting loss are only a part of what determines the performance of an audio recorder. The most critical parameter is the relative thickness of the magnetic coating on the tape. The ratio of tape thickness to the shortest wavelength to be recorded has a profound effect on the frequency response, maximum output, noise, and signal-level fluctuations.
The magnetic particles at the surface of the tape are very tightly coupled to the core of the head, producing a maximum amount of playback flux in the core. Particles that are buried below the surface of the tape, however, produce a weaker flux in the core. The amount of flux that is lost depends on the spacing distance and the wavelength-just as a small font size is more difficult to read at a distance than a larger font. An approximate expression for this spacing loss is:
Spacing loss_dB = 55 x distance/wavelength
(eqn. 4)
One example of the use of this spacing loss formula is to determine the playback signal loss due to a piece of dirt on the surface of a reproduce head. Assuming a typical recording studio tape speed of 15 in/s (38 cm/s), a dirt speck only 0.0001 in (2.5 µm) high will produce losses at the following frequencies of
150 Hz spacing loss = 55 x 0.0001 / [15 / 150]
= 0.055 dB
1500 Hz spacing loss = 0.55 dB
15 kHz spacing loss = 5.5 dB
Note that this seemingly insignificant dirt particle has produced a serious loss in high frequencies.
Spacing loss due to dirt is not the major problem created by the "nearsightedness" of the gap since proper head cleaning will keep spacing distances to less than 10^-5 inch, which is (0.25 µm), producing virtually no error at studio tape speeds. The problem is eight times more severe for cassette speeds of 1 in/s (4.8 mm/s).
The major spacing problem arises within the tape itself since the magnetic coating thickness spaces most of the particles away from the head with other particles.
Consider the tape to be composed of several independent layers of oxide, as shown in FIG. 17. The average spacing loss for each layer, calculated using the midpoint of each layer to determine the spacing distance, is tabulated for the example with a typical 0.6 mil (15 µm) coating thickness.
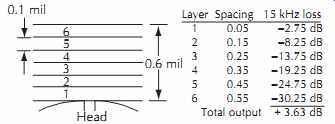
FIG. 17. Tape thickness loss.
The contributions of layers 2 through 6 fall off so rapidly due to spacing loss that their combined contribution is only equal to layer 1 by itself at this wavelength.
Indeed, shaving off layer 6, which constitutes 17% of the coating thickness, would produce a loss of only 2% or 0.18 dB in output at this wavelength.
This coating thickness loss can be expressed as:
Coating thickness loss_dB = 20log x/1-e-x
(eqn. 5)
where,
x is 2 pi × thickness/wavelength.
Although this expression yields a drop of 6 dB per octave, as shown in FIG. 18, this curve is not the same shape as the response of a low-pass filter made from a resistor and capacitor. The response in Fig. 18 is down 4 dB at the intersection of the asymptotes rather than the typical 3 dB for a single pole RC filter.
This difference in shapes means that a simple RC boost circuit will not properly correct for the thickness loss.
Depending on the choice of RC boost frequencies, the difference in shape will produce an error of 0.5-1.0 dB in the midband response.
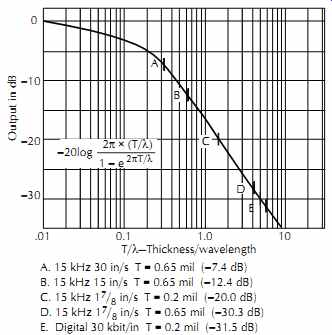
FIG. 18. Loss due to ratio of coating thickness to wavelength.
3.2.1 Equalization Boosts
This thickness loss of FIG. 22, must be corrected by applying compensating boosts in either the record or reproduce circuitry. Although this loss is a playback deficiency, the choice of whether to correct the loss during record or playback is somewhat arbitrary. The amount of record boost is limited by the magnetic saturation characteristics of the tape; playback boost is limited by the high-frequency noise characteristics of the tape and the reproduce head and associated circuitry.
The minimum amount of boosting required to achieve flat response can be considered to be a necessary equalization. The industry has developed a set of internationally recognized standards to promote compatibility of tapes. Each standard deals with the necessary and discretionary equalizations to define the exact characteristics of the recorded tape. Using the tape flux characteristics as a standard implicitly specifies the partitioning of equalizations between the recording and reproducing functions. Table 4 lists the commonly encountered standards.
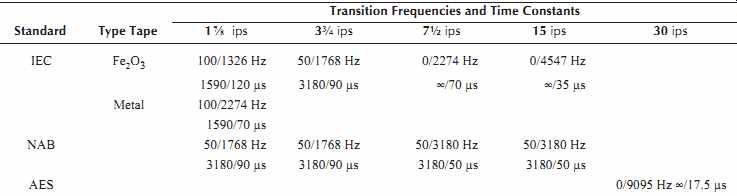
Table 4. Common Tape Record-Playback Equipment Equalization Standards.
Unlike the absolute nature of the reproduce characteristics, the record characteristics of the recorder must have enough flexibility to accommodate a number of different tape sensitivities and frequency characteristics.
Once the reproduce section has been calibrated to the standard with a standard alignment tape, all further adjustments are to produce a recorded tape on the machine that accurately matches the standard tape.
The amount of thickness loss can always be reduced by utilizing thinner coatings, but any decrease in thickness also causes an equal drop in low- and mid-frequency output and SNR. To preserve the existing standards, the tendency has been to adjust the coating thickness of new tapes to emulate the high-frequency losses of the older tape types while trying to achieve maximum low- frequency output. This somewhat self-defeating strategy has been overcome in recent thin-coat high-energy tapes that retain the low-frequency output capability of older tapes, but utilize new equalization curves optimized for the new tape thickness.
3.2.2 Fringing
Spacing loss is evident not only at high frequencies, but it also shows up at very long wavelengths. Magnetic information that is recorded off to the sides or fringes of the area normally scanned by the reproduce head core will begin to be sensed if the wavelength becomes longer than the separation distance. At studio operating speeds of 15 in/s and 30 in/s (38 cm/s and 76 cm/s), for which low-frequency wavelengths reach ½ inch and 1 inch (12.7 mm and 25 mm), this fringing leakage becomes very evident. For example, for the case of an oversized record track mentioned in Section 2.4.1, the signal level may rise by the ratio of the track width to the core width. A typical 24 track format on 2 inch (51 mm) tape would encounter a 1.3 dB rise at frequencies below 500 Hz for record and reproduce cores of 43 mils and 37 mils (1.1 mm and 0.9 mm).
A similar case arises when alignment tapes made with a single full-width record head are utilized for level and response checks. The sideways fringing will produce significant level and response errors. The actual amounts of error depend on both the track format and the playback head design. Some alignment tape manufacturers roll off the low frequencies in an attempt to offset the rise in a nominal head, but the amount of this fringing compensation is not absolutely correct for all head designs.
One additional pitfall to be avoided is the fringing differences between center tracks and edge tracks. Since the edge cores run very near the physical edge of the tape, these cores sense only one-half the amount of fringing flux sensed by the inner cores. During a frequency check from a full-width alignment tape, the two edge tracks should therefore be slightly lower in output at the low frequencies than the remainder of the tracks.
3.2.3 Contour Effect
At very low frequencies, the wavelength of the recorded signal may become as long as the magnetic core of the playback head. These long wavelengths enter the core at the gap and at the sides and rear of the core. The resulting flux in the core will consist of the desired flux from the gap plus additions and/or subtractions of the fringing flux leaking into the core at the sides and back.
The voltage output of the head, which is dependent on the net flux coupled into the windings, will undulate at low frequencies as the wavelengths create varying levels of constructive and destructive interference due to the fringing flux.
The response curve in FIG. 19 illustrates the nature of the undulations or head bumps for a typical mastering recorder at 15 in/s (38 cm/s) and 30 in/s (76 cm/s) using a reproduce head that has a 0.5 inch (12 mm) core face. Two well-defined head bumps are usually evident for such mastering heads. The bumps shift up an octave in frequency for each doubling of tape speed, creating an even more severe problem at 30 in/s (76 cm/s).
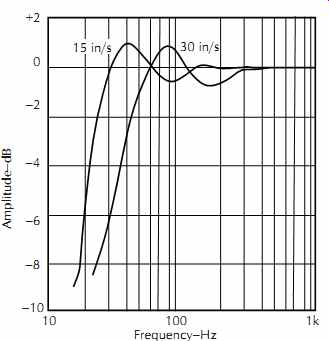
FIG. 19. Contour effect. Courtesy Sony Corporation of America.
Heads with either very small cores or only a small window in the head shielding at the gap area can produce numerous ripples in the low-frequency response. Such heads should be avoided unless the tape speed is slow enough to avoid serious problems within the normal band of audio frequencies.
The exact shape of the head bumps is determined by the size and shape of the reproduce core, surrounding shielding material, and angle of wrap of the tape. Since the user cannot adjust these parameters during the normal alignment procedure, the bumps can only be modified by adding an outboard equalizer, which cancels the bumps with an inverse response curve.
Recent improvements in the control of head bumps has reduced the magnitude of the bumps in present-day mastering recorders to less than 1 dB peak-to-peak at 15 in/s (38 cm/s) and 1.5 dB peak-to-peak at 30 in/s (76 cm/s). Beware that this level of error will be introduced each time the tape is rerecorded during mixdown and subsequent protection copying. The total error can easily reach 5 dB or more for a typical sequence of operations.
3.2.4 Crosstalk
Fringing also produces playback signal leakage or crosstalk between adjacent tracks at long wavelengths.
The unused area or guard bands between the cores of the head, which are nearly equal in width to the recorded track, usually provide enough of a physical gap to prevent flux from spilling from one track to the next. At long wavelengths, however, the fringing flux will jump the guard band, producing low-frequency crosstalk.
The crosstalk component due to fringing will initially decrease as the frequency is increased, but at midband the decrease will eventually bottom out. The remaining residual level of crosstalk is not due to fringing, but it is a direct transformer-like coupling of leakage flux between the adjacent cores in either the record or repro duce head. A layer of magnetic shielding material is typically placed between the cores of the head as a crosstalk shield to reduce this flux leakage.
3.3 Frequency Characteristics
3.3.1 Inductive Rise
Up to this point, most of the losses and response anomalies have been governed by the wavelength performance of the interface between the tape and the head. An additional set of characteristics due to the internal frequency-dependent operation of the head must also be considered.
The most striking characteristic in the frequency response of a conventional coil-and-core playback head is a continuous 6 dB/octave rise in output voltage with rising frequency. The core and winding of the head form an inductor in which the output voltage is proportional to the rate of change of the flux in the core as seen in the equation
head Vout = N Δ Φ / Δ t(eqn. 6)
where,
N is the number of turns in the winding,
Δ Φ is the change in flux,
Δt is the time interval.
Any ratio of the form Δx/Δt is called a differential with respect to time, and the device creating this rate of change is called a differentiator.
If a sine-wave signal of frequency f is used for testing the output voltage of a head, the voltage expression can be further simplified to:
head Vout = 2 pi Nf x fluxmax (eqn. 7)
3.3.2 Hysteresis Loss
The constantly changing magnetic flux in the core of the reproduce head gives rise to losses within the core of the head. One source of these losses is the amount of energy that is required to change the magnetization state of the core material. Every time the flux in the core reverses polarity, a small amount of energy is lost in overcoming the magnetic memory or hysteresis of the core material. The hysteresis power loss increases with both increasing flux magnitude and frequency.
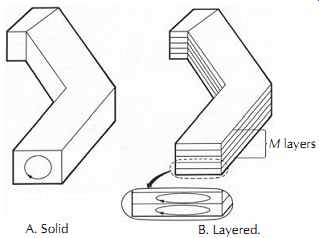
FIG. 20. Eddy current.
3.3.3 Eddy Current Loss
The changing core flux generates a voltage not only in the winding of the head, but also within the core itself.
If the core is metallic, this voltage will cause a current to flow within the core, as shown in FIG. 20. The core currents, referred to as eddy currents because of their similarity to swirling eddies in a stream of water, dissipate energy that should be going to the reproduce signal.
The amount of power (P) dissipated in the eddy currents is given by the general power equation:
P = V2 / R (eqn. 8)
= I 2 R
The previous discussion on the inductive rise of voltage with increasing frequency in the reproduce head also applies to these eddy components, producing a rapid rise in eddy current power loss.
The eddy currents of the solid core of FIG. 20A rise to an unacceptable level even before the upper limits of the audio band are reached. Fortunately, this drastic loss can be decreased by dividing the core into many thin insulated layers or laminations, as shown in FIG. 20B. For M laminations, each lamination would generate only 1/M of the core voltage and 1/M2 of the loss power produced by a solid core. The core resistance for each lamination drops only slightly since the width of the lamination remains unchanged. The net improvement for M laminations is a 1/M reduction in the eddy current power loss. (Professional audio heads, which are typically constructed with laminations 2 mils (50 µm) thick, will contain 20 to 120 laminations per track, depending on the track width.) Reducing the core size and using high-resistivity core materials such as ferrites can achieve even further improvements.
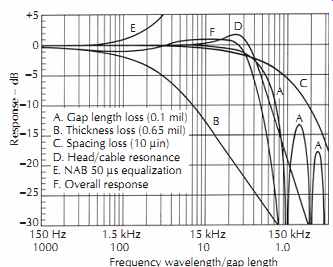
FIG. 21. Playback loss components at 15 in/s for 0.65 mil coating thickness.
3.4 Combined Characteristics
FIG. 21 illustrates some of the individual and composite effects of the foregoing reproduce head characteristics. The constant 6 dB/octave inductive rise of the head has been omitted in the illustration to accentuate the undesired departures from flat response.
Curves A, B, and C illustrate the gap length, tape thickness, and spacing losses, respectively.
Curve D represents a typical resonant rise due to head inductance and the capacitance of the head cable and head winding. The playback amplifier high-frequency response boost dictated by the National Association of Broadcasters (NAB) equalization standard for 15 in/s (38 cm/s) is represented by curve E. The combination of all of these effects in curve F yields a response that is flat within ±1 dB. This simplified model does not include relatively minor contributions at mastering speeds due to eddy currents and hysteresis, self-demagnetization effects, recording equalization, and the effects of nonuniform distribution of recorded flux due to coating thickness. In spite of these omissions, the dominant nature of the coating thickness loss is readily apparent. The equalization standards have been chosen primarily to offset this thickness loss.
The composite curve F represents the overall play back performance from an ideal tape of finite thickness.
All the indicated response anomalies within the audio band must be either corrected or tolerated. In some cases, one effect can be used to offset others, such as shaping the resonance curve to compensate for the gap length loss. (Unlike the resonance, the gap length loss increases with decreasing tape speed, upsetting the compensation at lower tape speeds.)
3.5 Noise
The useful range of signal levels that pass through the tape recorder is limited by the maximum signal at which all the magnetic tape particles become completely magnetized or saturated and also by the amount of noise that remains when the input signal is removed. Noise in tape recorders has many sources; the electronics, the tape, and the heads themselves all contribute to the residual noise.
The distortion content of the signal from a tape recorder rises so dramatically near tape saturation that the normal operating range must be limited to less-than-maximum levels. For the purpose of specifying and comparing tape recorders, the distortion-free maximum operating level is typically considered to be the output signal level at which the THD, which is dominated by third harmonic and other odd components, reaches 3%. The ratio of the level for 3% THD at medium wavelength to the residual noise is defined as the SNR of the recorder.
3.5.1 Track Width
The second factor is the loss in SNR in narrow-track consumer tape formats due to the dissimilar ways that random noise sources and coherent signals increase. The noise due to the tape, heads, and electronics is a random combination of many small independent noise bursts. If two equal and independent random noise sources of this type are added together, the noise power is doubled, producing an increase of 3 dB on a voltmeter.
Coherent sources, on the other hand, are merely duplicates of the same waveform. If two identical sources are added together, the value at each point on the output waveform is exactly twice the value of either of the input waveforms. In this case the output voltage is doubled, or a 6 dB increase.
Consider the case of two tracks of a tape recorder that have recorded the same signal. If the output signals of the two tracks are added, the noise will add randomly and the signals will add coherently. The combined tracks have 6 dB more signal and 3 dB more noise, yielding a net SNR improvement of 3 dB. Using a single track of double the original track width would produce the same result if the noise sources were statistically independent in nature.
The tape noise will follow the 3 dB per doubling rate if the reproduce amplifier noise is less than the tape noise. The reproduce amplifier noise typically remains nearly constant regardless of track width of the head.
The apparent noise will vary, however, as the gain of the amplifier is adjusted to compensate for changes in the head output due to increased or decreased track width.
When tracks are made narrower, the amplifier noise that functions as a coherent source will eventually dominate the tape noise, creating a signal-to-noise loss of 6 dB per halving of tape width.
FIG. 26 compares the output voltage and signal-to-noise variation for various track widths, assuming that all noise sources are truly random for a noiseless preamplifier and a typical preamplifier. When the amplifier noise begins to dominate the other noise sources, there is a rapid loss of SNR with decreasing track width.
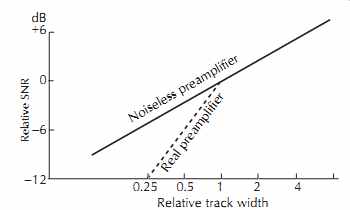
FIG. 22. Noise changes with track width.
3.5.2 Thermal Noise
Both the core and winding of the reproduce head contribute random noise to the output signal. For the winding, the noise source is due to the thermal agitation of the atoms in the copper wire. The amount of thermal noise is given by the expression:
TN = √ 4KTRB (eqn. 9)
= 1.82 x 10⁻⁸ √ R volts for a 20 kHz
bandwidth at room temperature
where, TN is the thermal noise, K is the Boltzmann's constant (1.38 × 10²³ joules/K), T is the absolute temperature in kelvin, R is the resistance in ohms, B is the measurement bandwidth in hertz.
A 100-ohm resistor will produce 0.182 µV of noise voltage. Depending on the core size and number of turns, a playback head may exhibit a resistance from 10-1000 ohm, yielding thermal noise contributions of 0.06-0.6 µV. The increase in noise due to more turns of finer wire in high-inductance heads is offset by a rise in head output voltage, producing little net change in SNR.
3.5.3 Barkhausen Noise
Another major noise source is Barkhausen noise, a noise due to jumps in the magnetic boundaries of the core material. The core metal consists of a collection of many microscopic magnetic zones or domains. When a magnetic field is applied to the core, the boundaries or walls of the domains will change as small domains merge to form larger domains. This merging occurs in discrete steps since the small domains act as single units that must each merge completely in one jump. The resulting step change in the magnetic field generates a noise burst in the head winding. Since the core contains millions of constantly switching domains, a statistically independent random noise is generated. Reducing the size of the basic domains will decrease the amplitude of the Barkhausen noise.
3.5.4 Magnetostrictive Noise
The magnetic core material also exhibits magnetostriction-a change in magnetic field due to stress. The microscopically rough surface of the magnetic tape will therefore produce a small magnetic field change in the core as the tape slides across the head. This field change generates a magnetostrictive noise component in the winding.
Both the Barkhausen and magnetostrictive noises are absent when no tape is moving over the surface of the head. The residual standby noise, which is measured under these conditions, is the absolute noise floor for the reproduce head and amplifier. The comparison of this standby noise level with the bulk-erased and biased noise levels is covered in the test and maintenance section.
3.6 Record Heads
The magnetic core and gap of a reproduce head obey the principle of reciprocity, which states that the roles of an excitation source and sensor can be interchanged.
For a head used in the reproduce mode, external flux at the gap produces a voltage across the head winding. If, instead, a voltage is applied to the head winding, a concentrated external flux field will be generated at the gap and can be used to record a signal on a piece of moving tape.
The shape and strength of the magnetic field at the gap is the basis for the operation of a recording head. The flux generated in the core by the current in the winding must jump across the gap to complete a closed magnetic path. The gap, which is a very poor magnetic path compared to the core, produces an obstruction that forces the flux to spread sideways, as shown in FIG. 23.
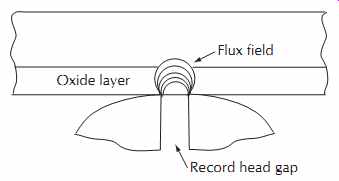
----- FIG. 23. Record head flux field
Flux field Oxide layer Record head gap
---------------
An analogous situation occurs with a crowd of people moving down a hallway. If the hallway widens for a crossing corridor or small lobby, the crowd will broaden out into the open area and then narrow down again to reenter the continuation of the hallway. The broadening will increase if the pressure within the hallway should increase due to an emergency such as a fire. The stress is greatest at the transitions between the wide and narrow spaces since this is where people are squeezing to try to change the shape of the flow.
A magnetic tape passing over a record head gap experiences a similar buildup and decline in the magnetic recording field as it moves across the gap. To produce a permanent recording on the tape, the flux must first rise to a level sufficient to overcome the magnetic memory force of the tape, which normally keeps the magnetic particles on the tape from changing state spontaneously. In the central zone of complete excitation, the tape particles will follow any change in the input signal driving the head. As the tape particles exit the strong central zone, a well-defined point will be reached at which the driving flux drops below the memory force, leaving a fixed magnetic image impressed on the tape. This transition region in which the image freezes at the trailing edge of the gap is called the trapping plane.
The shape of the trapping plane depends primarily on the gap size and the thickness and magnetic characteristics of the tape. Since trapping planes that are narrow and vertical will produce short-wavelength recordings that are more easily reproduced, several techniques have been developed to sharpen the transition zone, as shown in FIG. 24.
---------------
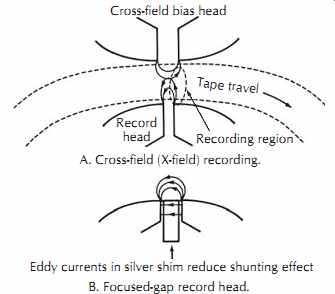
FIG. 24. Focused-gap and cross-field (X-field) head.
Cross-field bias head A. Cross-field (X-field) recording.
Tape travel Recording region Record head B. Focused-gap record head.
Eddy currents in silver shim reduce shunting effect
--------------
The focused-gap technique in FIG. 24B uses a highly conductive gap shim made of silver to serve as a barrier to flux jumping straight across the gap. Eddy currents in the shim force the flux away from the shim, squirting the flux deeper into the tape. The reduction in shunted flux raises the efficiency of the head by requiring less drive power.
The conductive shim is only effective at high frequencies at which large eddy currents are generated in the shim. As a result, focused gap recorders utilize bias frequencies that are approximately ten times higher than conventional systems.
In practical use the silver shim proved to be a major problem because the soft silver would smear onto the trailing pole piece of the head and short the head's laminations together.
A second technique, which yields similar results, is the crossed field or X-field, FIG. 24A. This method typically places a second bias-only head on the back side of the tape to create a shaped bias flux field jumping from one head to the other.
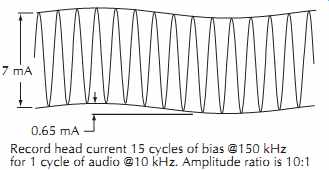
FIG. 25. Record head current.
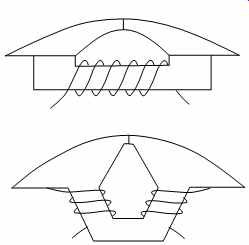
FIG. 26. Hammerhead cores.
3.6.1 Biased or Anhysteretic Recording
The magnetization of the tape particles is not easily changed due to the memory force or hysteresis of the particles. In fact, the particles have a form of inertia that must be overcome if a linear transfer is to be achieved.
If a rapidly varying signal of sufficient amplitude to just begin magnetizing the particles is added to the audio flux signal, the magnetic particles will more readily conform to changes in the audio waveform. The high-frequency biasing signal produces a hysteresis-free or anhysteretic recording.
FIG. 25 shows a typical waveform of the current in a low impedance Ampex record head that is recording 10 kHz at a level of 250 nW/m. The bias component of 7 mAp-p is approximately ten times larger than the 10 kHz component at 650 µA. (The voltage waveform across the record head would be totally dominated by the bias component due to the 6 dB/octave rise in head impedance with increasing frequency, in this case 35 V of bias versus 500 mV of 10 kHz or 70:1.) The audio and bias signals must be added together in a linear manner without generating any of the sidebands that are present in either amplitude or frequency modulation techniques. The short- wavelength bias signal can therefore be easily filtered out during playback by the gap and thickness losses so that only the audio signal remains. (The high level of bias signal transformer crosstalk that is present during sync/overdub operation requires a sharp notch filter in the playback preamplifier to remove the bias signal.) Typical bias frequencies range from 100 kHz for slow-speed recorders to over 10 MHz for high-speed tape duplicators. Although high bias frequencies are desirable to permit easy filtering and thorough tape excitation, a practical upper limit for mastering recorders is reached at 500 kHz due to a combination of increased eddy current and hysteresis losses in the core and the increase in bias drive voltage required due to the inductance of the head.
Head losses can be reduced by using a very small core to reduce hysteresis losses and by choosing either thin laminations or a ferrite material to reduce eddy current losses. If, however, the record head will also be used for the reproduce function during sync/overdub, a small core will cause serious long-wavelength contour effects. The compromise hammerhead design shown in FIG. 26 improves the playback performance of the small core by adding extensions to the face of the core.
The tips function only to play back low-frequency signals for which core losses are insignificant.
The bias voltage required to drive a record head doubles each time the bias frequency is doubled due to the inductance of the record head. To keep the required bias voltage within the range of common integrated circuits, the inductance can be lowered either by reducing the number of turns in the winding or by lengthening the gap. Reducing the number of turns once again degrades the sync/overdub performance by reducing the playback voltage generated by the head.
Heads with very low inductance typically require a step-up transformer to achieve adequate playback SNRs, but the transformer will also contribute some additional small amounts of distortion, noise, and frequency response anomalies.
Lengthening the record head gap will reduce shunting and give better bias penetration into the tape, but the short-wavelength sync/overdub response will suffer greatly.
A more straightforward approach to optimize the record head for both recording and playback is to use separate flux paths or windings for each of the functions. One simple method of switching windings and flux paths is to use parallel paths that can be selectively blocked. As shown in FIG. 27, when the high-inductance playback winding is shorted, flux will be blocked from the playback shunt magnetic leg of the core, effectively eliminating this path and thereby forcing all of the flux from the low-impedance bias winding to the front of the head. During reproduce, when the bias winding is shorted, the flux picked up from the tape will pass only through the reproduce winding. Although the cost of this dual-winding head is significantly higher than for a conventional single-path design, each coil can be optimized for its intended function without the need for compromise, yielding playback-to-record inductance ratios of up to 1000:1.
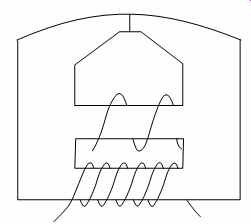
FIG. 27. Dual winding record head.