Above: AD----110V-1000W Hot-Air BGA Rework Soldering Station Motherboard-Repair-Station (click image for more details)
Physical measures of the sound fields in rooms are important because they can help us to understand the perceptual dimensions of speech, movies, and musical performances that we enjoy in those rooms. As in all psychoacoustic endeavors, not all physical measures are equally useful, however correct they may be in strictly physical terms. Also, a correlation does not imply causality, so although some measures may correlate with perceptions, they may not be the root cause of the effect. All of these measures form the foundation upon which the science of architectural acoustics has developed, and it’s important to examine them even though some will turn out to be only of passing interest.
Nobody would pretend that small rooms for sound reproduction are intimately related to concert halls and that the same criteria for excellence apply.
However, one of our goals is to reproduce the auditory illusions of concert hall experiences in our homes and cars. It’s therefore necessary to understand the basic metrics of excellence for concert venues so that with multichannel record/ reproduce systems, we may be able to optimize the experience in small listening spaces.
1. LARGE PERFORMANCE SPACES: CONCERT HALLS
Explanations of sound fields in concert halls begin with notions of ray (geometrical) acoustics, showing direct sound and discrete reflections from large surfaces.
The rules are simple: The angle of incidence equals the angle of reflection. Greek and Roman open-air theaters relied solely on a few reflections to support the direct sound. In enclosed performance spaces, a new phenomenon appears: reverberation, which is caused by sounds being repeatedly reflected from all surfaces and objects in the room. If the sound source produces a sustained sound, a steady-state reverberant sound field builds up to a level where the sound energy is absorbed at the same rate at which it’s being created. When the sound source ceases, the reverberant sound field decays. The time it takes to decay by 60 dB is called the reverberation time (RT).
In the abundance of reflections that we collectively call reverberation, there are so many individual events that it has been common to think of them as a statistical entity distributed randomly in time and space. As a result, classic concert hall acoustical theory often begins with the simplifying assumption that the sound field throughout a large relatively reverberant space is diffuse. In technical terms that means it’s homogeneous (the same everywhere in the space) and isotropic (with sound energy arriving at every point equally from all directions). That theoretical ideal is never achieved because of sound absorption at the boundaries, by the audience, and in the air, but it’s an acceptable starting point.
====
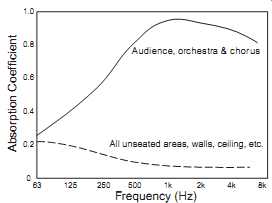
FIG. 1 The absorption coefficients for areas of a concert hall that
are occupied by the audience and musicians and for all other areas. From
Beranek, 1969, FIG. Absorption Coefficient Audience, orchestra & chorus
All unseated areas, walls, ceiling, etc.
====
CALCULATING REVERBERATION TIME
In large, highly reflective rooms, the reverberation time is often well predicted by the original Sabine formula:
RT = .049V/A, where V is the total volume in ft^3 and A is the total absorption in the room in sabins. The total absorption, A, is calculated by adding up all of the piecemeal areas (carpet, drapes, walls, etc.) of the boundaries multiplied by their individual absorption coefficients:
A=(Sa+Sa +Sa 11 22 3 3…), where S is the area in square feet and a is the absorption coefficient for the material covering that area. Absorption coefficient is a measure of the percentage of sound that is absorbed when sound reflects from the material. The product of S and a is a number with the unit sabins. The absorption of some items, such as people or chairs, is sometimes quoted directly in sabins.
The metric equivalent of the Sabine formula is RT = 0.161V/A, where the volume is in m^3 and areas are in m^2 and A is in metric sabins.
As rooms get more absorptive and smaller and as the materials on the room boundaries begin to differ more from one another (e.g., wall-to-wall carpet on the floor), this equation becomes progressively less reliable. Over the past 100 years, several increasingly more complex equations have been developed to accommodate asymmetry in rooms and the fact that the sound field is not diffuse; Fitzroy (1959) and Arrau-Puchades (1988) contributed some of them. However, all of them, to be practical, make assumptions. Dalenbäck (2000) says, "These two formulas give a better estimate than the classical formulas [Sabine and Eyring] in some cases, but here a central question is: How can one be sure they are better in a particular case? So far, no equation with universal applicability has been shown" [his emphasis]. Fortunately, as we will see, in small rooms for sound reproduction, high precision is not required. If it were, it’s likely that a computerized room model would be needed. In the meantime, the simple Sabine formula provides estimates that are adequate for our purposes in small listening rooms.
===

FIG. 2 The structure of the steady-state sound field in an idealized
large performance space. The dotted draw-away curve indicates the declining
sound level that, in some form or other, is seen in real halls. Based
on Schultz, 1983, Figure 10.
Distance from an omnidirectional source
Sound Level (10 dB/division)
===
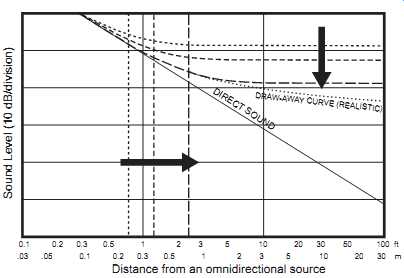
FIG. 3 The large arrows indicate trends resulting from increasing amounts
of absorption in the idealized room: the steady-state reverberation level
decreases and the critical distance increases. Again, the dotted curve
shows the additional effect that in real rooms the sound level falls
with distance.
Sound Level (10 dB/division) Distance from an omnidirectional source
===
Absorption in these large performing spaces is minimized to conserve the precious acoustical energy from musical instruments and voices. An active reflected sound field ensures the distribution of that energy to all seats in the house. The challenge is to preserve the sound energy in the reflections without obscuring the temporal details in the structure of music and speech. This is why reverberation time remains the paramount acoustical measure in performance spaces.
It’s important to note that in the calculations of reverberation time, it’s assumed that the acoustical activity-reflection, absorption, and scattering-- occurs on the room boundaries and that the volume of the room is empty. In a concert hall, the height is such that the audience is essentially treated as a "layer" of material with a certain average absorption coefficient placed on the floor or distributed throughout the hall. FIG. 1 shows representative absorption coefficients for areas occupied by audience, orchestra, and chorus, and for all other areas (Beranek, 1969). Obviously, audiences absorb a great deal of middle- and high-frequency energy. Consequently, to achieve the reverberation times necessary for music (typically 1.5-3 s), halls must have "other areas," such as walls and ceilings, that are much greater than the audience area. This requirement leads to high ceilings and, for large audiences, large volumes.
FIG. 2 shows a familiar portrayal of idealized behavior in one of these halls. In this depiction, an omnidirectional sound source is located well away from the room boundaries, such as the center front of the stage. As a function of distance from the source, the level of the direct sound follows the inverse square-law rate of decay (-6 dB per double distance, dB/dd) until it encounters the underlying steady-state reverberant sound field that is assumed to extend uniformly throughout the space (Beranek, 1986; Schultz, 1983). The distance from the source at which the direct sound equals the level of the reverberation is known as the critical distance (also known as reverberation distance or reverberation radius). The dashed-curve sum of these is what would be measured by a sound level meter as it’s moved away from the source-a draw-away curve.
In the ideal hall, the curve is horizontal at large distances, but in real halls it falls with distance, as shown by the dotted curve.
Because of sound absorption by the audience, the air (increasingly significant above about 1500 Hz), and the room boundaries, the level of the reverberant sound field varies in absolute level and with distance. FIG. 3 shows that, as the amount of absorption in the room increases, the level of the reverberant sound field drops, and the critical distance increases. In reality, the level of the reverberant sound field gradually falls with increasing distance, as energy is dissipated, a trend suggested by the dotted curve. The rate of decline with distance depends on several factors: the size and shape of the hall, orientation of large reflecting surfaces, placement of the audience within it, and so forth.
In addition, individual voices and instruments don’t obey the simplifying assumption of omni-directionality, so the sound field at different listening positions will be different for different instruments (Meyer, 1993; Otondo et al., 2002). FIG. 4 shows what happens when the directivity of the sound source is increased in the direction of the listener: The critical distance increases. We hear this at symphonic concerts in the contrast between the penetrating clarity of brasses that deliver a higher proportion of direct sound compared to the open and airy strings that radiate their collective energy more widely. This is difficult for recordings to capture and reproduce in a way that parallels the live experience.
=====

FIG. 4 The large arrows indicate trends resulting from increasing sound
source directivity in the direction of the listener: the direct sound
curve is elevated and the critical distance increases. The level of the
steady-state reverberation is unchanged because the sound power output
is constant in this example. DI (directivity index) is a common measure
of directivity. A DI of 0 dB describes an omnidirectional source. In
consumer and professional "cone and dome" loudspeakers, woofers
typically exhibit DIs of 0 dB at frequencies below about 100 Hz, midrange
drivers tend to be slightly directional at around 4 dB, and tweeters
can reach 9 dB or more at the highest frequencies. Whether the sound
source is a loudspeaker or a musical instrument, those with different
DIs will project their sounds differently into rooms, and listeners will
experience different proportions of direct and reflected sounds-different
perceptions. Inspired by Beranek, 1986, Figure 10.23.
Sound Level (10 dB/division)
Distance from the source
=====
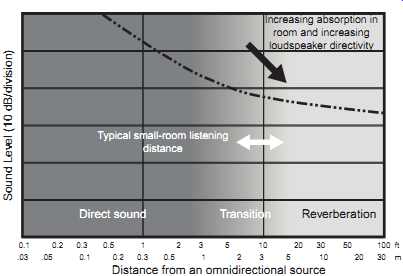
FIG. 5 An artistic interpretation of the transition from direct-sound
dominance at short distances to reverberant-sound dominance at large
distances. The transition region in between, where both are influential,
appears to be that within which we find ourselves in small listening
rooms because they are acoustically relatively absorbent and employ loudspeakers
that are relatively directional.
Sound Level (10 dB/division)
Reverberation
Increasing absorption in room and increasing loudspeaker directivity
Transition Direct sound
Typical small-room listening distance
Distance from an omnidirectional source
===
Directional control is critical in designing sound reinforcement systems, the purpose of which is to deliver sound to the audience without exciting excessive reflections and reverberation within the room itself. The challenge is to put more of the audience in a predominantly direct sound field, precisely the opposite of a live concert hall experience.
In loudspeakers for sound reproduction, it will later be shown that constant, or at least only gradually changing, directivity over most of the frequency range is a desirable trait. FIG. 4 shows one of the reasons. It’s necessary to maintain a relatively constant direct-to-reflected sound proportionality as a function of frequency.
Combining the effects of increased absorption, increased source directivity, and a realistic attenuation with distance of the steady-state reverberant sound field, FIG. 5 shows a hypothetical draw-away curve for a small room, assuming that no other factors are involved. It shows that at typical listening distances, listeners may find themselves within the untidy transition region. This is interesting, but it isn't the final statement; we need to investigate further.
1.1 Reverberation Time and the Perception of Speech and Music
When a source of sound stops radiating energy, whatever reverberant sound field that exists begins to decay. Because reverberation has the effect of prolonging all acoustical events, reverberation time is an obvious influence on how we hear speech and music. Rapid changes in sound are difficult to hear when each sound is stretched in time by the reverberant decay. Although RT is defined for a 60 dB decay, it’s the first 20 dB or so that matters most with the sounds we care about. What happens in the later portion of the decay has other effects, both desirable and undesirable. Consequently, there are several measures that attend to what happens in the early and late stages of the decaying sound field (Beranek, 2004; Long, 2006).
Speech intelligibility benefits from some control of reverberation time, so rooms for speech communication, such as classrooms, tend to have short RTs, around 0.5 s. However, there is more to the story. In terms of speech intelligibility in large spaces, it has long been recognized that the early reflections that are a component of the early portion of reverberation are important aids to speech intelligibility. Later reflections contribute nothing useful. In rooms where speech intelligibility is important, therefore, it’s more important to pay attention to the reflection pattern in the room than to reverberation itself. Increased early reflection energy has the same effect on speech intelligibility scores as an equal increase in the direct sound energy (Bradley et al., 2003; Lochner and Burger, 1958; Soulodre et al., 1989).
Opera houses have typical reverberation times of about 1-1.5 s, which is considered an acceptable compromise for understanding the spoken dialogue and singing, while providing some assistance to the instrumental accompaniment. However, this is considered a bit too "dry" for much of the classical music repertoire, so most dedicated concert halls are designed to have RTs in the 1.5-3 s range. The very long reverberation times in cathedrals, 5 s or more, allow a choir to effectively sing with itself, generating layers of harmonizing but severely limiting the musical repertoire suitable for the space. This is, of course, a great simplification, because in addition to these mostly temporal considerations, there are those related to perceptions of direction and space.
1.2 The Seat-Dip Phenomenon
Most of us think of live performances in good concert halls as "reference" experiences-not only greatly enjoyable but an opportunity to recalibrate our perceptual scales. That is because there are no technical devices to get in the way-no microphones, recordings, and loudspeakers. But that does not guarantee unimpaired sound transmission. There are acoustical phenomena, one of which has come to be known as the "seat-dip effect," wherein low-frequency sounds passing over an audience at low incident angles generate a substantial dip in the frequency response as measured at the head location. The exact nature of the dip is related to the geometry and acoustical treatment of the cavity formed by the rows of seat bottoms, backs, and the floor. Schultz and Watters (1964) and Bradley (1991), among others, have measured the effect as a function of source elevation, source and seat location, horizontal angle, and so on; the effect is not trivial, as shown in FIG. 6. Not only is the dip 10-15 dB deep, but it’s wide; showing significant attenuation over more than two octaves at the lowest incident angle.
The effect exists primarily in the direct and early-arriving sounds. Later reflections that arrive from other angles appear to alleviate the effect somewhat, but it remains an audible effect in the early-sound field in typical auditoriums.
There is a suggestion that the preference for elevated RT at low frequencies is, at least in part, to compensate for the seat-dip losses (Beranek, 1962).
Davies et al. (1996) have measured detection thresholds for the dip of -3.8 dB for 0-80 ms early energy. It appears not to be influenced by reverberation, but it does seem to be less severe in halls with strong overhead reflections or steeply raked seating (Bradley, 1991). Holman (2007) found pronounced dips in the room curves of cinemas even with the elevated incident angle produced by raked stadium seating. Here the deliberate absence of reverberation and strong reflections would be an aggravating factor.
Naturally, in addition to a panoramic view, there is no seat-dip effect in the front mezzanine and balcony rows. Are these the "audiophile" seats? Just five rows back, however, the dip is very evident (Schultz and Watters, 1964).

FIG. 6 The seat-dip effect for four angles of incidence of direct sound.
From Bradley, 1991, FIG.
1.3 The Effects of Early and Late Reflections
It’s beyond the scope of this guide to delve into the complex elements of acoustics and psychoacoustics of large concert venues. Beranek (2004) and Long (2006) provide excellent historical and contemporary perspectives. Still, it’s important to understand what the important variables are because, ultimately, it’s our goal to reproduce them for a few listeners in small rooms. In general, the main factors have to do with where reflections come from and when they arrive, early or late.
Several of the measures related to pleasurable perceptions in concert halls are related to the angles of incidence of reflected sounds relative to the direct sounds from the stage. In particular, those reflections arriving from the sides have been found to be especially useful contributors to what was originally called "spatial impression." Now it’s recognized that there are two components to spatial impression (Bradley and Soulodre, 1995):
¦ Apparent source width (ASW)-a measure of perceived source broadening and defined as the width of a sound image fused temporally and spatially with the direct sound image (Bradley et al., 2000). Before 1990, this is what the literature generally referred to as spatial impression (Barron, 2000). It’s associated with the level of early (<80 ms) lateral reflections, as measured by either a lateral energy fraction (LF) of the sound field or by interaural cross-correlations (IACC). It’s also influenced by overall sound level.
¦ Listener envelopment (LEV)-a sense of being surrounded by a diffuse array of sound images that are not associated with particular source locations. It’s associated with reflections arriving after about 80 ms.
According to Bradley et al. (2000), "It has been shown that all reverberant or late-arriving sound can influence LEV, but that late-arriving sound from the side of the listener is more important for creating a strong sense of LEV."
FIG. 7 illustrates the concepts.
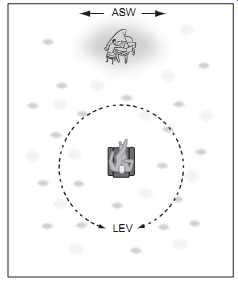
FIG. 7 An artistic impression illustrating apparent source width (ASW)
and listener envelopment (LEV). Inspired by Morimoto, 1997, FIG.
In typical halls, both ASW and LEV coexist in proportions related to the specific acoustics. In examinations of 16 halls, LEV was estimated to be the stronger influence. Bradley et al. (2000) report, "The highest values of both quantities are found in more reverberant smaller halls that would tend to have both strong early and late lateral sound energy." As we adjust our focus to concentrate on sound reproduction in small rooms, it will be seen that various interpretations of ASW, image broadening, will be contributed by the room itself, but the sound levels and delays required for LEV, envelopment, must be delivered through multichannel audio systems.
As noted here , forsyth (1985) pointed out the importance of matching the size of the orchestra and the hall:
When an orchestra plays at forte level in a compatible-sized room, strong sound reflections can be heard from the side walls and to some extent the ceiling as the music "fills the hall." (p. 15)
This is the highly desirable illusion that is missing in many performances, both live and reproduced. When I had the good fortune to attend rehearsals and performances of a symphony orchestra in Vienna's Musikverein, one of the most celebrated halls in the world, I was frankly not ready for the intensity of the spatial impression-the hall was indeed "full" and the envelopment was pro found. It was greatly pleasurable, but for a person habituated to more modern, larger, halls and after many years of exposure to two-channel reproduced sound, the first impression was one of surprise. It occurred to me that I and my audiophile acquaintances would probably consider such an illusion to be artificially overdone if we were to hear it through a multichannel audio system.
2. OFFICES AND INDUSTRIAL SPACES
Occupying the middle ground between large, high-ceilinged performance spaces and domestic rooms are those with large floor areas and lower ceilings: offices, factories, and the like. Most such spaces have significant amounts of absorption, much of it on the ceiling or floor, or both. They also have large sound absorbing and scattering objects distributed throughout the floor area, desks, people, office cubicles, machines, production lines, and so on. If the objects in these spaces are significantly large relative to the height and volume of the rooms, they cannot be treated as a "layer" of sound absorbing material on the floor. Sounds propagating across such spaces behave distinctively. At short distances from a source, the objects are obstacles to propagation, reflecting some portion of the sound back toward the source and causing the sound level to be higher than it otherwise would be. The objects themselves contribute to absorptive losses, as well as reflect and scatter sound into other absorbing surfaces. The result is an increase in overall sound attenuation with distance compared to what might be expected in concert halls.

FIG. 8 Two predictive models showing anticipated shapes of draw-away
curves in offices and industrial spaces. One predicts a progressive decline
with distance at a rate of approximately -3 dB/double-distance (varying
with frequency and the nature of the room). The other model, by Peutz,
shows a similar trend but predicts a rapid decline beyond a distance
of about three times the room height. The horizontal scale applies to
the Peutz prediction. Adapted from Schultz, 1983, and Hodgson, 1998.
Distance from an omnidirectional source (multiples of room height); Sound
Level (10 dB/division)
Different dimensional ratios, differing deployment of absorbing materials, and scattering objects all result in different sound propagation characteristics.
However, there are some strong common features. Close to the sound source, sound backscattered from objects in the space can cause the sound level to exceed that of the direct sound, especially at high frequencies. Over much of the distance, the draw-away curve falls at a rate of approximately -3 dB per double distance (at least for combined middle and high frequencies). Hodgson (1998) discusses several models for predicting the actual rate, which is frequency dependent. At longer distances, this trend may continue, or, depending on the room geometry, the distribution of absorbing material, and the presence of significantly large scattering objects, the rate of decay can accelerate (Hodgson, 1983). FIG. 8 shows two simplified theoretical predictions for the tendencies of draw-away curves: the popular -3 dB/dd and a more elaborate prediction by Peutz (1968) as compiled and reported by Schultz (1983) in a very insightful document. Continuing to speculate what may happen in small listening rooms, the range of typical listening distances is shown.
Real draw-away curves measured by Hodgson (1983) in several industrial spaces exemplify both trends, with a fair amount of scatter caused by differing behavior at different frequencies, FIG. 9.
Late reflections are rapidly attenuated with distance from the source. Over almost the entire draw-away distance, including the range of listening distances typical of small rooms, listeners are in what can best be described as a prolonged transitional sound field, neither direct nor reverberant. This means that critical distance is not an appropriate concept in these spaces.
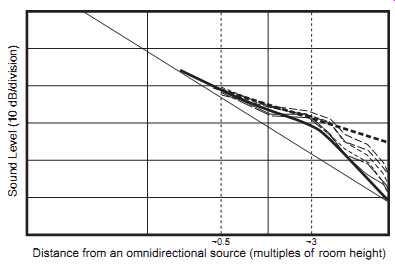
FIG. 9 Measured draw-away curves (thin lines) by Hodgson (1983) in
one of his several investigations. These are from an industrial space
45 m by 42.5 m with an average height of 4 m and are shown for octave
bands in the range of 125 Hz to 4 kHz. All fall between or close to the
predictive dark lines from FIG. 8. Distance from an omnidirectional source
(multiples of room height); Sound Level (10 dB/division)
3. DOMESTIC LISTENING ROOMS AND CONTROL ROOMS
When the floor area shrinks from office/factory to domestic dimensions, it seems probable that this behavior will continue because key features of the commercial spaces are present. Large portions of one or more surfaces have significant absorption in the form of carpet, drapery, and, perhaps, acoustical ceilings. There are also sound-absorbing and scattering objects, such as sofas, chairs, tables, cabinets, and vertically stepped arrangements of bulky leather chairs in custom home theaters, all of which are large relative to the ceiling height in typical homes.
All of this continues the theme of reflected sounds filling the space with a sound field that has high diffusivity. We conceptualize what is happening using the notion of ray acoustics, geometric acoustics, separable direct and reflected sounds, and so forth. At middle and high frequencies, where wavelengths are short compared to the room dimensions, this is appropriate. However, as rooms shrink, the dimensions become significant when compared to wavelengths at low frequencies. At 20 Hz, the wavelength is 56.5 ft (36.7 m); at 50 Hz, it’s 22.6 ft (6.9 m); at 100 Hz, it’s 11.3 ft (3.45 m); and so on.
At these low frequencies, the behavior of small rooms is dominated by resonances (a.k.a. modes, eigen frequencies, etc.) and the associated standing waves.
This is best described in terms of sound waves, not rays. As frequency increases, there is a transition from the region in which wave motion and room resonances dominate to the region within which ray/geometric acoustics and reflections are better able to describe acoustical events. Consequently, the following discussion of the sound field in listening rooms is broken into three categories: events above the transition region, events within the transition region, and events below the transition region. First, though, it’s necessary to identify at what frequency this transition takes place.
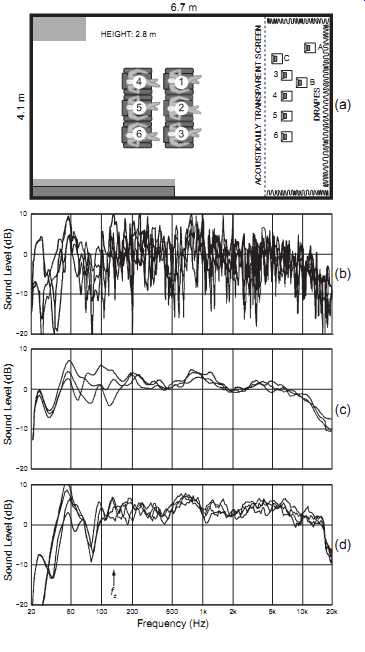
FIG. 10 (a) Measurements were made in the prototype IEC 268-13 (1985)
room.
(b) Loudspeaker "X," located at position C, is measured at listener positions 1, 3, 4, and 6. 1/20-octave resolution.
(c) Loudspeaker "X" at each of the locations A, B, and C averaged over all six listener locations, 1/4-octave smoothed.
(d) Loudspeaker "Y," a different loudspeaker, averaged over loudspeaker locations 3 through 6, measured at each of the listener locations 1, 3, 4, and 6. 1/4 octave smoothed.
The Schroeder crossover frequency (fc) for this room is shown. All data from Toole, 1986.
3.1 One Room, Two Sound Fields-The Transition Frequency
Ultimately, we are interested in knowing how loudspeakers interface with small rooms, so let us begin by putting a loudspeaker into a typical room and measuring what happens. FIG. 10a shows the floor plan of the prototype IEC 268- 13 (1985) listening room, indicating several possible loudspeaker locations and six listener locations. Because this room was used for subjective evaluations of loudspeakers, the mission was to find locations for both listeners and loudspeakers that would allow for reasonably equitable comparisons to be made between different products.
FIG. 10b shows frequency responses measured at each of four listener locations for a loudspeaker in position C. This is a measurement with high (1/20-octave) resolution, so it shows a great deal of complexity (or "grass," as engineers call it), especially above about 200 Hz. This is acoustical interference between and among the numerous reflections arriving from many different directions at many different times. It’s normal, but it’s not instructive, especially because, as we will see later, we don't hear these details. Looking carefully, one can discern a central tendency among the curves, suggesting an underlying character that is more similar than is given by the first impression. Consequently, it’s normal to spectrally average, or smooth, such curves. It’s important to choose the smoothing function carefully because if it’s too broad, one loses even the underlying trends and certainly the ability to examine what is happening in the simpler undulations at low frequencies. Although 1/3-octave smoothing is common, it’s too broad for some purposes; 1/4-octave smoothing was used here. Notions that the smoothing must be associated with critical bands or other psychoacoustic measures of loudness summation are irrelevant here, as we are looking for technical explanations of what is happening.
FIG. 10c shows frequency responses for the same loudspeaker placed in locations A, B, and C. Each curve is the 1/4-octave-smoothed average of measurements made at all six listener locations. Below about 300 Hz, the frequency response is dominated by loudspeaker position, whereas at higher frequencies, the measurements follow a similar pattern. The fact that the loudspeaker positions each differ in distance to the side and end wall causes considerable variation up to at least 200 Hz. However, the very long wavelength of the first-order length mode, the bump at 26 Hz, is immune to these positional variations.
Obviously, A, B, and C were not useful loudspeaker locations, as the balance and timbral quality of the bass would be dominated by which position the loudspeaker occupied. As can be seen, it ranged from inadequate to well balanced to boomy. Positions 3-5 were much more useful because they maintain a constant relationship with the end wall/length modes (not shown; see Toole, 1986).
However, where the listener sits also matters. FIG. 10d confirms that reciprocity applies in these situations by showing measurements averaged over loudspeaker locations 3 through 6 for each of four well-separated listening locations, 1, 3, 4, and 6. Again, what happens at low frequencies is determined by location-this time it’s the listener location-and, again, the curves follow a similar pattern at higher frequencies. The pattern is different from that in (c) because a different loudspeaker was used. The amount of bass around 50 Hz is dominated by front row versus back row listener locations interacting with the second-order length mode in the room; front row seats are close to the pressure peak, and the back row seats are approaching the null. Still, some side-to-side asymmetry can be seen. The consistent dip is the result of the loudspeakers all being at a constant distance from the end wall, close to 1/4 wavelength at 80 Hz, affecting the acoustic output because of destructive interference (an adjacent boundary effect; see SECTION 12), and failing to excite the third-order mode at 3 × 26 = 78 Hz (a standing-wave effect).
The acoustical explanation is the dominance of relatively isolated room modes and standing waves at low frequencies and of a complex collection of overlapping modes and reflected sounds at high frequencies. As will be explained in more detail in SECTION 13, room modes are the result of reflections that rein force each other in an orderly fashion, but here we make a distinction because, at higher frequencies (shorter wavelengths), geometric and acoustic irregularities in the boundaries of normal rooms (doors, windows, fireplaces, furnishings, etc.) disrupt the orderly reflections necessary for the creation and support of room modes. As a result, as frequency increases, it becomes progressively less useful to think about regular patterns of standing waves in rooms but rather to think in terms of irregular patterns of constructive and destructive acoustical interference caused by numerous reflections traveling in many directions.
In between the orderly low-frequency room resonances and the disorderly higher-frequency acoustical behavior is a transition zone, the middle of which, in large rooms such as concert halls and auditoria, would be defined as the Schroeder frequency or, as Schroeder himself calls it, the "cross-over frequency fc" (Schroeder, 1954, 1996).
f_c = 2000 __/ T/V where T is the reverberation time in seconds, and V is the volume of the enclosure in cubic meters. The multiplier constant changed from the original 4000 to 2000 in the 1996 paper.
Calculation of the Schroeder frequency assumes meaningful reverberation times, a strongly diffuse sound field, and an unimpeded volume. As we know, in small rooms, especially those with large furnishings, these are mismatched concepts, so the calculated value may be in error, as noted by Baskind and Polack (2000). For the room used in the measurements in FIG. 10, the Schroeder frequency is 129 Hz (T = 0.32 s, V = 76.9 m^3 ). This would seem to be on the low side because the large undulations in the curves have not diminished, especially in FIG. 10c, although some of these variations are likely to be associated with adjacent-boundary effects. However, no matter how it’s identified or what it’s called, the transition region is real, and it’s necessary to take different approaches to dealing with acoustical phenomena above and below it.
FIG. 11 gives us more insight into this topic. Here are shown, using an expanded frequency scale, high-resolution frequency-response measurements from each of the five loudspeakers in a surround-sound system at the prime listening position. The room is geometrically symmetrical, but differences in the curves reveal that it’s not acoustically symmetrical. A door in one end wall causes it to flex more than the other one at certain frequencies, and a concrete wall behind, but not touching, one of the side walls gives it more stiffness than the opposite wall. The result is asymmetry in the standing wave patterns. Five identical loudspeakers are arranged in the ITU-R BS.775-2 (2006) recommended arrangement, and measurements were made at the listener's head location.
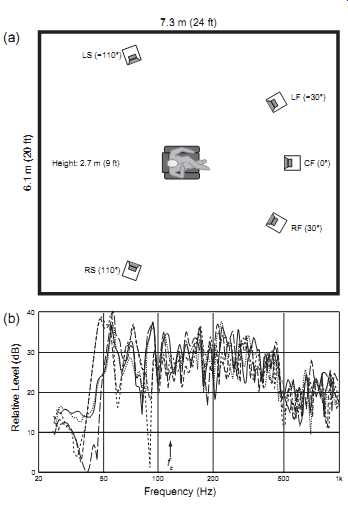
FIG. 11 (a) A listening arrangement according to ITU-R BS.775-2. (b)
1/20 octave steady-state measurements for each of the five loudspeakers,
measured at the listening position. The Schroeder crossover frequency
(fc) is shown.
===
Sound Level (dB)
TRANSITION Smaller rooms Larger rooms Movement of transition frequency WAVE ACOUSTICS MODAL REGION GEOMETRIC/RAY ACOUSTICS STATISTICAL REGION
FIG. 12 An artistic interpretation of the transition between the low-frequency region dominated by room modes and the high frequency region dominated by reflected sounds. Also shown is the effect of room size on the position of the transition region in the frequency domain.
===
The standing waves cause huge variations at low frequencies, covering the full 40 dB range of the display. Above about 100 Hz, the variations are attenuated, and above about 200 Hz, they seem to settle down even more. Looking at the details, below about 200 Hz, in spite of some obvious variations related to the very different loudspeaker locations, one can see evidence of relatively independent resonant peaks at clearly identifiable frequencies. Above 200 Hz, the pattern becomes less orderly, and the peak-to-peak variations are smaller. Yet, an underlying trend is visible, including the step at 500 Hz, which is obviously a characteristic of the loudspeaker, a large woofer running without a low-pass filter. The Schroeder (crossover) frequency (fc) is 111 Hz (T = 0.4 s, V = 128 m^3), which again seems to be too low; a better estimate for this room would be 200 Hz, or even slightly higher.
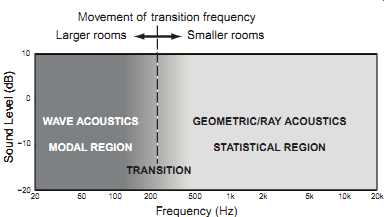
FIG. 12 is a stylized portrayal of this situation, indicating a region
within which wave acoustics and room resonances are dominant factors,
a region within which geometric/ray acoustics and reflections are dominant
factors, and a transition region within which the two factors mingle
in differing proportions at different frequencies. The position of the
transition region on the frequency scale is dependent on room size, among
other things, and this is shown. In very large auditoriums and concert
halls, room resonances cease to be a problem.
Conversely, in very small spaces, like the interior of a car, the cabin resonances can be influential to much higher frequencies.
It may or may not be possible to find a simple calculation that will allow us to identify the "center" of the transition region, but it’s a convenient concept, so further discussions of the phenomenon will often refer to the "transition frequency" as if it were a definable quantity. Right now, it’s not. It’s an empirical observation with a logical rationale, and finding it for a particular listening room requires acoustical measurements and visual inspection of the data.
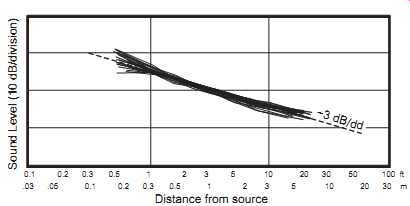
FIG. 13 Draw-away curves measured in four living rooms using four approximately
omnidirectional sound sources (Schultz, 1983). Combined with these are
measurements by the author using five loudspeakers with different directivities
in two domestic listening rooms. All curves were adjusted to a similar
mid-distance sound level to reveal the shape and slope tendencies. Distance
from source; Sound Level (10 dB/division)
3.2 Above the Transition Frequency
Picking up the story where it was left at the beginning of Section 4.3, let us continue to examine the behavior of steady-state sound fields as a function of distance from the source. Schultz (1983) measured draw-away curves in several living rooms. He used A-weighted measurements of broadband, omnidirectional or at least widely dispersing noise sources: an ILG fan (a calibrated noise source), a blender, a saw, and a drill. The sound field was found to decline at a rate of approximately -3 dB per double-distance. This was confirmed in draw-away measurements done by the author in two entertainment rooms using loudspeakers of various directional characteristics: omnidirectional, bipole, dipole, and forward firing.
The combined data from nine sound sources in six rooms are shown in FIG. 13. The monotonic decline in sound level shown in all of the draw-away curves indicates a source-to-sink energy flow at increasing distance from the source, a confirmation of what was anticipated in Figures 8 and 9.
Variations in the curves at short distances are probably near-field effects caused by being so close to the sources, some of which (the electrostatic dipole loudspeakers especially) were quite large (the meaning of "near field" is discussed in Section 18.1.1). At the other end of the curves, some of the measurements were made close to the back wall of the listening space where boundary effects may be expected. There may be rooms, unusually live or dead, or loudspeakers of sufficient directivity that could result in draw-away curves that fall outside this range, but that is precisely what would be expected in the real world, as was found and well noted by Hodgson (1983). In the cases shown here, the surprise is that the curves exhibit such similarity in spite of some real differences in source directivity and rooms.
The shapes and slopes of the draw-away curves suggest what may be going on in a room, but by themselves they are not proof of anything. Considering the distances at which we listen in our entertainment spaces and control rooms, it’s clear that we are in the transitional region, where the direct and early reflected sounds dominate and late-reflected sounds are subdued and progressively attenuated with distance. The sound field is not diffuse, and there is no critical distance, as classically defined. If we were to speculate at this early stage about loudspeaker performance in these rooms, it would seem that a combination of direct and early-reflected sounds would figure prominently in their potential sound quality and that sound power would not be the dominant factor.
===
THE LANGUAGE OF DIFFUSION
Diffusion is a property of a sound field. A perfectly diffuse sound field is isotropic: At any point within the sound field, sounds may be expected to arrive from all directions with equal probability. It’s also homogeneous: It’s the same everywhere in the space. Small listening and control rooms cannot have diffuse sound fields. In fact, true diffusion exists only as an academic ideal. Reverberation chambers used to measure the absorption of acoustical materials are designed to be diffuse and can come close, but as soon as a test sample of material is introduced into the space, it ceases to be. The result is measured absorption coefficients that exceed 1.0. Diffusion can be improved by using sound scattering devices, irregular, curved and angled surfaces, and especially designed devices, often called diffusers.
Perceptually, a diffuse sound field sounds spacious and enveloping. However, a diffuse sound field is not a requirement for the perception of spaciousness and envelopment.
Much simpler sound fields also work, especially if multi channel sound reproduction is involved, because then it’s possible to deliver sounds to the ears that are perceived to have those qualities-with or without a room.
===
3.3 Measuring the Lack of Diffusion in Small Rooms
Gover et al. (2004) provide hard evidence of what is going on in the sound fields in some small rooms. Using a novel spherical steerable-array microphone, the authors explored in three dimensions the decaying sound field in several small rooms. None of them exhibited isotropic distributions at the measurement locations. Strong directional features were associated with early reflections. Small meeting rooms and a videoconferencing room with reverberation times of 0.36-0.4 s, in the range of typical listening rooms, had anisotropy indices and directional diffusion measures that fell roughly halfway between anechoic and reverberant conditions. Moreover, the values changed with time. Later sound showed increased anisotropy and even changed orientation in the room according to the surfaces that were more reflective (see FIG. 14). This is interesting because, in physical terms, it means that in the initial interval after the source ceased output, there was a predominant front-back orientation to reflections in the room. However, in the decaying sound field, it can be seen that there is less overall sound absorption on the sides of the room, so, after a short interval, the reflection activity shifts 90° to a side-to-side orientation, and this pattern becomes even clearer with time.
None of this is necessarily bad. A highly diffuse sound field may be a worthy objective for performance spaces and recording studios, where the uniform blending of multiple sound sources and the reflected sounds from those multi directional sources are desired. However, it’s conceivable, indeed probable, that such a sound field may not be a requirement for sound reproduction through multiple, somewhat directional, loudspeakers surrounding and directed toward a listener. This becomes especially so when it’s considered that, in popular applications like movie and television sound tracks and traditional music recordings, all of the loudspeakers are not allocated equivalent tasks. Front loudspeakers predominantly create real and phantom "soundstage" images, whereas side and rear loudspeakers provide occasional directional cues but are mainly utilized to create enveloping ambient and spatial illusions. This notion might need rethinking if "listener-in-the-middle-of-the-band" recordings become the norm.

FIG. 14 Diffusivity measurements made in a videoconferencing room (7.23
m ¥ 8.33 m ¥ 3.01 m) with a mid-frequency RT of 0.4 s. The omnidirectional
source and the measurement microphone array were 2.03 m apart. The shapes
across the bottom of the figure are the horizontal plane diffusivity
patterns. The loudspeaker symbol shows the orientation of the direct
sound. A perfectly diffuse sound field would show a circular pattern.
The pattern on the left is for the entire time record, shown in the upper
right. It shows prominent lobes for the direct sound, first-order lateral
reflections, and a rear wall reflection. The middle and right patterns
represent diffusivity of the later portions of the impulse response:
The diffusivity rotates to a side-to-side orientation. From Gover et
al., 2004.
3.4 What Is a "Small" Room?
Diffuse-field theory may not apply perfectly to concert halls, but it applies even less well to other kinds of rooms. In the acoustical transition from a large performance space to a "small" room, it seems that the significant factors are a reduced ceiling height (relative to length and width), significant areas of absorption on one or more of the boundary surfaces, and proportionally large absorbing and scattering objects distributed throughout the floor area.
Different combinations of these characteristics result in basically similar acoustical behavior in large industrial spaces (Hodgson, 1983, 1998) and, with minor adjustment, in domestic listening spaces. Sound radiating from a source is either absorbed immediately on its first encounter with a surface or object or the objects redirect the sound into something else that absorbs it. Thus, the late reflected sound field is greatly diminished with distance from the source. These are not Sabine spaces, and it’s not appropriate to employ calculations and measurements that rely on assumptions of diffusivity. Schultz (1983) states, "The amount of sound-absorbing material in the room cannot be accurately determined by measurement, either with the decay-rate (reverberation time) method or the steady-state (reference sound source) method. . . . One cannot trust the predictions of the Diffuse Field Theory for a non-Sabine room." In the small listening rooms of interest to us, another distinguishing factor exists: the dominating presence at low frequencies of room modes. They are a major problem when attempting to communicate low-frequency musical sounds with important information in both the time and frequency domains.
3.5 Conventional Acoustical Measures in Small Listening Rooms
A measurement of reverberation time in a domestic-sized room yields a number.
When the number is large, the room sounds live, and when the number is small, the room sounds dead. The implication is that there should be an optimum number. In spite of this, many thoughtful people believe that RT is unimportant or irrelevant (D'Antonio and Eger, 1986; Geddes, 2002; Jones, 2003; Kuttruff, 1998). The numbers measured are small compared to those in performance spaces, and so the question arises if the late-reflected sound field in a listening room is capable of altering what is heard in the reproduction of music. Yet, RT is routinely included as one of the measures of small listening and control rooms for international standards, even to the point of specifying allowable variations with frequency.
Reverberation time is a property of the room alone, and a correct measurement of it should employ an omnidirectional sound source capable of "illuminating" all of the room boundaries. The reason for this is that it’s assumed that the boundaries consist of areas of reflection and absorption and that the central volume of the room is empty. The several formulae by which we estimate RT confirm this, and the values of absorption coefficient for the materials are "random incidence" values, meaning that there is an assumption of some considerable diffusivity in the sound field. Some practitioners incorrectly use conventional sound-reproduction loudspeakers as sources. The directivity of these is such that the resulting reflection patterns and decays are not properties of the room but of the room and loudspeaker combination-a very different situation. Also, as we will see in SECTION 20, absorption at specific angles is quite different from random-incidence absorption. FIG. 15 illustrates the fundamental difference between a proper RT measurement and what it’s that we listen to.
The result of a correct RT measurement is a number or a set of numbers for different frequency bands that describes the decay rate over a range of sound levels, maybe 20 or 30 dB (usually limited by background noise), and then extended by multiplication to give a number for a 60 dB decay. It’s common to look at the mid-frequency reverberation time and the variations with frequency. The former is a measure of the suitability of a performance space for different styles of music. The variations with frequency are important because it’s undesirable to change the spectral balance of voices and musical instruments by excessive absorption in narrow frequency bands. This is critical in large performance spaces because almost all of the listeners are in a sound field dominated by reverberation.
In a small listening room, we are in a transitional sound field that consists of the direct sound, several strong early reflections, and a much-diminished late-reflected sound field. What we hear is dominated by the directional characteristics of the loudspeakers and the acoustic behavior of the room boundaries at the locations of the strong early reflections. RT reveals nothing of this. As a measure, it’s not incorrect, but it’s just not useful as an indicator of how reproduced music or films will sound. Nevertheless, excessive reflected sound is undesirable, and an RT measurement can tell us that we are in the ballpark, but for that matter, so can our ears or an "acoustically aware" visual inspection.
This transitional sound field appears to extend over the entire range of listening distances we commonly employ in small rooms. It’s therefore necessary to conclude that the large-room concept of critical distance is also irrelevant in small rooms. This said, there is still a perceptible transition that occurs as a function of distance, beyond which the front soundstage-real and phantom images-appear to change. Because critical distance is not the appropriate measure, a new one is needed. A reasonable hypothesis is that it’s related to the ratio of direct to early-reflected sound and the extent to which laterally reflected sounds, especially, contribute to a perception of ASW, image broadening, frontal spaciousness, and so on.
===
OMNIDIRECTIONAL SOUND SOURCE OMNIDIRECTIONAL MICROPHONE (a) (b)
FIG. 15 (a) How RT should be measured, using an omnidirectional source aiming its sound at all of the room surfaces, and an omnidirectional microphone. Typically, several different setups would be used and the results averaged. (b) How we listen. A moderately directional loudspeaker directs most of its sound toward the audience and some of its sound toward some of the room surfaces and furnishings.
===
All of the other acoustical measures employed in evaluating performance spaces: early/late-decay rates, energy ratios, lateral fractions, and others having to do with impressions of articulation, direction, image size, apparent source width, and spaciousness, could be applied to sounds reproduced over a multi channel reproduction system. However, in doing so, one is also evaluating the recording and the manner in which it captured or was processed to simulate those attributes. That is a worthy topic for investigation, and it could conceivably lead to improvements in recording technique and multiple-loudspeaker configurations. But, again, so far as the performance of the listening space itself is concerned, these are more traditional acoustical measures that find themselves in the wrong place.
The numbers produced by traditional acoustical predictions and by measuring instruments, while not totally irrelevant, are simply not direct answers to the important questions in small rooms used for sound reproduction. What, then, are the important questions? The accumulating evidence suggests that they have to do with reflections but not in a bulk, statistical, sense. We need to understand the influences of early reflected sounds. This means that the knowledge base must include the directivity and off-axis frequency responses of loud speakers and the directional reflective, diffusive, and absorptive characteristics of materials at the points of first reflections. Only with this information can we predict the sounds that might arrive at listening locations in rooms, and only with careful experimentation can we understand the perceptual effects that they cause. This is very different from traditional acoustics.