Above: AD----110V-1000W Hot-Air BGA Rework Soldering Station Motherboard-Repair-Station (click image for more details)
2. A REFLECTION IN THE PRESENCE OF OTHER REFLECTIONS
Working with a single reflection allows for intensely analytical investigations, but, inevitably, the tests must include others to be realistic. A long-standing belief in the area of control room design is that early reflections from monitor loudspeakers must be attenuated to allow those in the recordings to be audible.
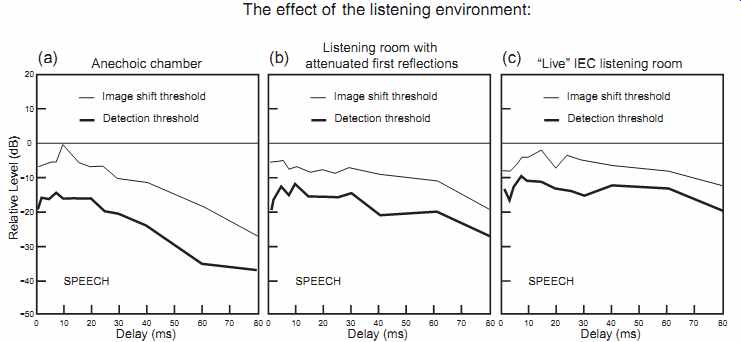
FIG. 8 Detection and image-shift thresholds as a function of delay for a single
reflection auditioned in three very different acoustical circumstances: (a)
Anechoic. (b) A normal room in which the first-order reflections were attenuated
with 2-in. (50 mm) fiberglass board. (c) The same room in a relatively reverberant
configuration (mid-frequency reverberation time = 0.4 s). From Olive and Toole,
1989.
Consequently, embodied in several standards, and published designs, are schemes to attenuate or eliminate the first reflections from a loudspeaker using deflecting reflectors, absorbers, or scattering surfaces (diffusers).
Olive and Toole (1989) appear to have been the first to test the validity of this idea. FIG. 8 shows the results of experiments that examined the audibility of a single lateral reflection simulated in an anechoic chamber with 3 ft (1 m) wedges. For the second experiment, the same physical arrangement was replicated in a typical small room in which the first wall, floor, and ceiling reflections had been attenuated using 2-in. (5 cm) panels of rigid fiberglass board. A third experiment was conducted in the same room with most of the absorption removed (mid-frequency reverberation time = 0.4 s). The idea was to show the effects, on the perception of a single reflection, of increasing levels of natural reflected sound within a real room.
The large changes in the level of reflected sound had only a modest (1-5 dB) effect on the absolute threshold or the image-shift threshold of an additional lateral reflection occurring within about 30 ms of the direct sound. At longer delays, the threshold shifts were up to about 20 dB, a clear response to elevated late-reflected sounds in the increasingly live rooms. This is a good point to remember, as we will see it again: the threshold curves become more horizontal when the sound-in this case, speech-becomes prolonged by reflected energy (repetitions).
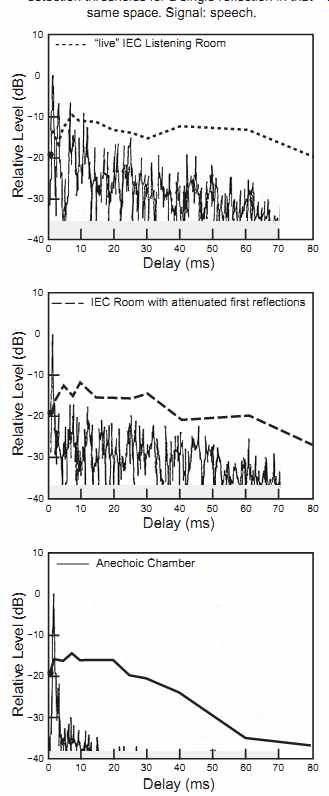
FIG. 9 A comparison of the absolute thresholds shown in FIG. 8,
with measured energy-time curves (ETCs) for the three spaces within which
the tests were done. All data from Olive and Toole, 1989.
FIG. 9 shows a direct comparison of the thresh olds with the ETC (energy-time curve) measured in each of the three test environments. Here the huge variations in level of the reflections can be clearly seen, in contrast with the relatively small changes in the detection thresh olds within the first 30 ms or so. Sub-section 6 [below] explains why.
2.1 Real Versus Simulated Rooms
In a large anechoic-chamber simulation of a room of similar size, Bech (1998) investigated the audibility of single reflections in the presence of 16 other reflections, plus a simulated "reverberant" sound field beginning at 22 ms. One of his results is directly comparable with these data. The figure caption in Bech's paper describes the response criterion as "a change in spatial aspects," which seems to match the image shift/image spreading criterion used by Olive and Toole. FIG. 10 shows the image-shift thresholds in the "live" configuration of the IEC room for two subjects (the FT data are from FIG. 9; the SO data were previously unpublished) and thresh olds determined in the simulated room, an average of the three listeners from Bech (1998). The similarity of the results is remarkable considering the very different physical circumstances of the tests. It suggests that listeners were responding to the same audible effect and that the real and simulated rooms had similar acoustical properties.
Bech separately examined the influence of several individual reflections on timbral and spatial aspects of perception. In all of the results, it was evident that signal was a major factor: Broadband pink noise was more revealing than male speech. In terms of timbre changes, only the noise signal was able to show any audible effects and then only for the floor reflection; speech revealed no audible effects on timbre.
Looking at the absorption coefficients used in modeling the floor reflection (Bech, 1996, Table II) reveals that the simulated floor was significantly more reflective than would be the case if it had been covered by a conventional clipped pile carpet on a felt underlay. Further investigations revealed that the detection was based mainly on sounds in the 500 Hz-2 kHz range, meaning that ordinary room furnishings are likely to be highly effective at reducing first reflections below threshold, even for the more demanding signal: broadband pink noise.
In terms of spatial aspects, Bech (1998) concluded that those sounds above ~2 kHz contributed to audibility and that "only the first-order floor reflection will contribute to the spatial aspects." The effect was not large, and, as before, speech was less revealing than broadband noise.
Again, this is a case where a good carpet and underlay would appear to be sufficient to eliminate any audible effect. See FIG. 21.3 for data on the acoustical performance of floor coverings.
In conclusion, it seems that the basic audible effects of early reflections in recordings are well preserved in the reflective sound fields of ordinary rooms. There is no requirement to absorb first reflections to allow recorded reflections to be heard.
2.2 The "Family" of Thresholds
FIG. 11 shows a complete set of thresholds, like those shown in FIG. 5, determined in an anechoic chamber but here determined in the "live" IEC listening room.
The curves are slightly irregular because the data were based on a small number of repetitions. As expected, the curves all have a more horizontal appearance than for speech auditioned in an anechoic environment. It is significant that all the curves have the same basic shape from detection at the bottom to the Haas-inspired equal loudness curve at the top.
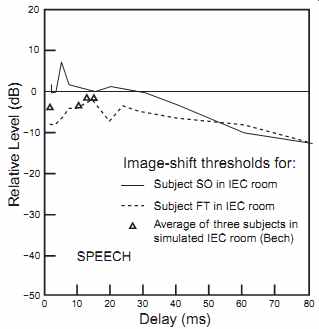
FIG. 10 Image-shift thresholds as a function of delay for two listeners
in the "live" IEC room (FT data from FIG. 8) and averaged
results for three listeners in a simulation of an IEC room using multiple
loudspeakers set up in a large anechoic chamber (Bech, 1998).
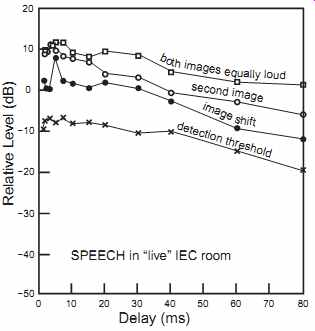
FIG. 11 The full set of thresholds, as shown in FIG. 5, but
here obtained while listening in a normally reflective room rather than
an anechoic chamber. One listener (SO). Unpublished data acquired during
the experiments of Olive and Toole, 1989.
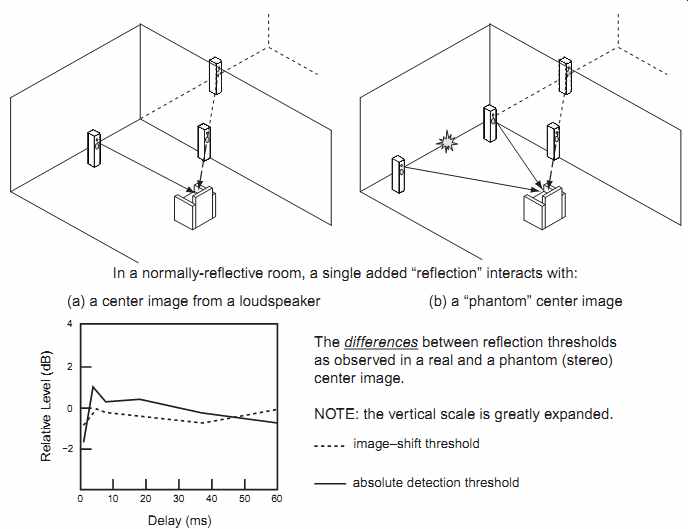
FIG. 12 An examination of how a real and a phantom center image
respond to a single lateral reflection simulated by a loudspeaker located
at the right side wall. The room was the "live" version of
the IEC listening room used in other experiments. Note that the vertical
scale has been greatly expanded to emphasize the lack of any consequential
effect. The signal was speech.
3. A COMPARISON OF REAL AND PHANTOM IMAGES
A phantom image is a perceptual illusion resulting from summing localization when the same sound is radiated by two loudspeakers. It is natural to think that these directional illusions may be more fragile than those created by a single loudspeaker at the same location. The evidence shown here applies to the simple case of a single lateral reflection, simulated in a normally reflective room with a loudspeaker positioned along a side wall, as shown in FIG. 12. When detection threshold and image-shift threshold determinations were done first with real and then with phantom center images, in the presence of an asymmetrical single lateral reflection, the differences were insignificantly small. It appears that concerns about the fragility of a phantom center image are misplaced.
Examining the phantom image in transition from front to surround loud speakers (±30° to ±110°), Corey and Woszczyk (2002) concluded that adding simulated reflections of each of the individual loudspeakers did not significantly change image position or blur, but it did slightly reduce the confidence that listeners expressed in the judgment.
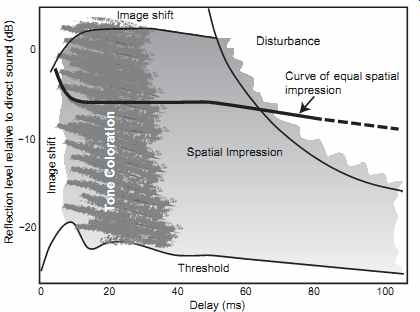
FIG. 13 Subjective effects of a single reflection arriving from
40° to the side, adjusted for different delays and sound levels. An important
unseen effect is an increase in loudness, which occurs when the reflected
sound is within what is colloquially called the "integration interval":
about 30 ms for speech and 50 ms or more for music, all depending on
the temporal structure of the sound. In this figure, the lowest curve
is the hearing threshold. Above this, at short delays, listeners reported
various forms of image shift in the direction of the reflection. At all
delays larger than about 10 ms, listeners reported "spatial impression" wherein "the
source appeared to broaden, the music beginning to gain body and fullness.
One had the impression of being in a three-dimensional space" (Barron,
1971, p. 483). Spatial impression increased with increasing reflection
level, a fact illustrated in the figure by the increased shading density.
The "curve of equal spatial impression" shows that at short
delays, levels must be higher to produce the same perceived effect. At
high levels and long delays, disturbing echoes were heard (upper right
quadrant). At intermediate delays and at all levels, some degree of tone
coloration was heard (darkened brushstrokes). The areas identified as
exhibiting "image shift" refer to impressions that the principal
image has been shifted toward the reflection image. At short delays,
this would begin with summing localization-the stereo-image phenomenon
in which the image moves to the leading loudspeaker. At longer delays,
the image would likely be perceived to be larger and less spatially clear.
Finally, at longer delays and higher sound levels, a second image at
the location of the reflection would be expected to add to the spatial
illusion. From this presentation it is not clear where these divisions
occur. From Barron, 1971, Figure 5, redrawn.
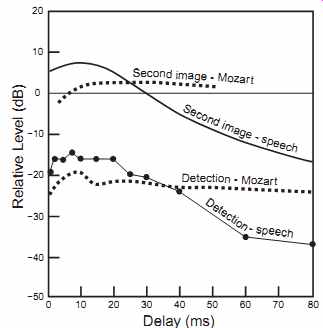
FIG. 14 Data from FIG. 6a showing thresholds obtained using
speech and data from FIG. 13 showing thresholds obtained using Mozart.
The upper curve for music was described as that at which the "apparent
source moved from direct sound loudspeaker toward reflection loudspeaker." This
could be interpreted as being equivalent to the Olive and Toole "image
shift" threshold, but the pattern of the data in the comparison
suggests that it is more likely equivalent to the "second image" criterion.
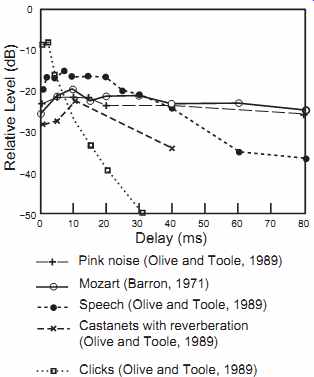
FIG. 15 Detection thresholds for a single lateral reflection, determined
in an anechoic chamber for several sounds exhibiting different degrees
of "continuity" or temporal extension.
4. EXPERIMENTAL RESULTS WITH MUSIC AND OTHER SOUNDS
A good introduction to investigations that used music is FIG. 13, the widely reproduced illustration from Barron (1971), in which he combines several subjective effects for a single lateral reflection simulated in an anechoic chamber using a "direct sound" loudspeaker at 0° (forward) and a "reflected sound" loud speaker at 40° to the left, both at 3 m distance. For different electronically introduced delays, listeners adjusted the sound level of the "reflection," reporting what they heard while listening to an excerpt from an anechoic-chamber recording of Mozart's Jupiter symphony. They heard several identifiable effects, as shown in the figure and described in the caption. There is more to this matter, but this important paper provides a good summary of research up to that point and some new data contributed by Barron.
There is a lot of information in this diagram, but most of it is familiar from the discussions of perceptions in experiments using speech. In the Barron paper, much emphasis is placed on spatial impression because of the direct parallel with concert hall experiences. These days, discussions of spatial impression would be separated into listener envelopment (LEV) and apparent source width (ASW). The discussions here appear to relate primarily to ASW, but the quote in the caption includes the remark "the impression of being in a three-dimensional space," indicating that it is not a hard division. In any event, Barron considers spatial impression to be a desirable effect, as opposed to "tone coloration." On the topic of "tone coloration," it was suggested that a contributing factor may be comb filtering, the interference between the direct and reflected sound, but Barron further noted that this is mostly a "monaural effect" because "the effect becomes less noticeable as the direct sound and reflection sources are separated laterally." The "tone coloration ... will frequently be masked in a complex reflection sequence," meaning that in rooms with multiple reflecting surfaces, tone coloration is not a concern. More recent evidence supports this opinion.
We will discuss the matter of timbre changes later, and we will see that tone coloration can be either positive or negative, depending on how one asks the question in an experiment. Again, we will go back to the quote in the caption that with the addition of a reflection, "the music [begins] to gain body and fullness," which can readily be interpreted to be tonal coloration but of a possibly desirable form.
4.1 Threshold Curve Shapes for Different Sounds
It is useful to go back now and compare the shapes of the threshold contours determined by Barron for music with those shown earlier for speech, both in anechoic listening conditions. FIG. 14 shows such a comparison, and it is seen that curves obtained using the anechoically recorded Mozart excerpt are much flatter than those for speech.
These data suggest two things. First, it appears that the slower paced, longer notes in the music cause the threshold curves to be flatter than they are for the more compact syllables in speech. This "prolongation" appears to be similar in perceptual effect to that occurring due to reflections in the listening environment (FIG. 8). Second, it appears that the slope of the absolute threshold curve is similar to that of the second-image curve, some thing that was foreshadowed in FIG. 11.
FIG. 15 shows detection thresholds for sounds chosen to exemplify different degrees of "continuity," starting with continuous pink noise and moving through Mozart, speech, castanets with reverberation, and "anechoic" clicks (brief electronically generated pulses sent to the loudspeakers). The result is that increasing "continuity" produces the kind of progressive flattening seen in Figures 6.8 and 6.9. The perceptual effect is similar if the "continuity" or "prolongation" is due to variations in the structure of the signal itself or due to reflective repetitions added in the listening environment.
In any event, pink noise generated an almost horizontal flat line, Mozart was only slightly different over the 80 ms delay range examined, speech produced a moderate tilt, castanets (clicks) with some recorded reverberation were even more tilted, and isolated clicks generated a very compact, steeply tilted threshold curve.
Assuming that the patterns seen in previous data for speech and Mozart apply to other sounds as well, FIG. 16 shows a compilation and extension of data portraying detection thresholds and second-image thresholds for Mozart, speech, and clicks. To achieve this, the second-image curve for clicks had to be "created" by elevating the click threshold curve by an amount similar to the separation of the speech and music curves. Absolute proof of this must await more experiments, but it is interesting to go out on a (strong) limb and speculate.
Looking at the 0 dB relative level line-where the direct and reflected sounds are identical in level-it can be seen that the precedence-effect interval for clicks appears to be just under 10 ms. According to Litovsky et al. (1999), this is consistent with other determinations (<10 ms), and the approximately 30 ms for speech is also in the right range (<50 ms). They offer no fusion interval data for Mozart, but it is reasonable to speculate based on the Barron data that it might be substantially longer than 50 ms. The short fusion interval for clicks suggests that sounds like close-miked percussion instruments might, in an acoustically dead room, elicit second images.
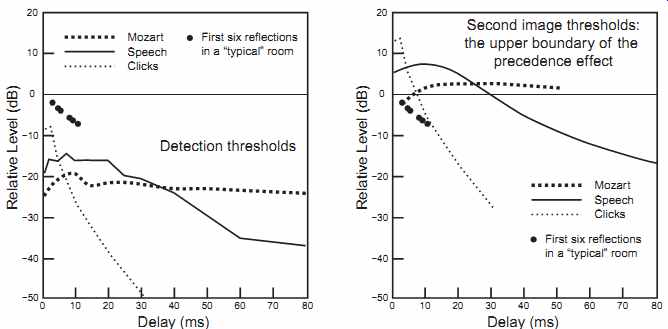
FIG. 16 Using data from Figures 16 and 17, this is a comparative
estimate of the detection thresholds and the second image thresholds
(i.e., the boundary of the precedence effect) for clicks, speech, and
Mozart. The "typical room reflections" suggest that in the
absence of any other reflections, the clicks are approaching the point
of being detected as a second image. However, normal room reflections
would be expected to prevent this from happening because the threshold
curve would be flattened (see Figures 8 and 9).
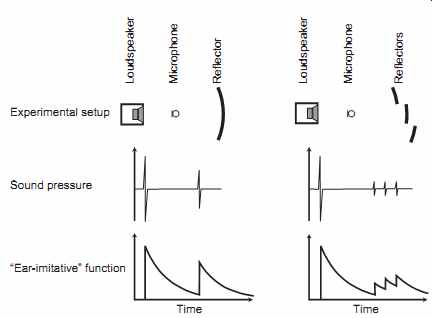
FIG. 17 A comparison of a single large reflection with a sequence
of three lower-level reflections. From Cremer and Müller, 1982, Figure
1.16.
5. SINGLE VERSUS MULTIPLE REFLECTIONS
So far, we have looked at some audible effects of single reflections when they appear in anechoic isolation and when they appear in the presence of room reflections. Now we will look at some evidence of how a sequence of reflections is perceived.
Cremer and Müller (1982) provide a limited but interesting perspective. FIG. 17 shows a microphone picking up the direct sound from a loudspeaker and either a single large or three smaller reflections in rapid sequence. The middle layer of images displays sound pressure, showing the direct sound followed by the reflections. The bottom layer of images portrays what Cremer and Müller call an "ear-imitative" function, which is a simple attempt to show that the ear has a short memory that fades with time-a relaxation time.
The point of this illustration is that events occurring within short intervals of each other can accumulate "effect," whatever that may be. The sequence of three smaller reflections can be seen to cause the "ear-imitative" function to progressively grow, although not to the same level as that for the single reflection.
However, when the authors conducted subjective tests in an anechoic chamber, they found that the sequence of three low-level reflections and the large single reflection were "almost equally loud." The message here is that if we believed the impulse response measurements, we might have concluded that by breaking up the large reflecting surface, we had reduced the audible effects.
This is one of the persistent problems of psychoacoustics. Human perception is usually nonlinear, and technical measurements are remarkably linear.
Angus (1997, 1999) compared large, single lateral reflections from a side wall with diffuse-multiple small-reflections from the same surface covered with scattering elements. There were no subjective tests, but mathematical simulations showed some counterintuitive results-namely that although the amplitudes of individual reflections were attenuated (as seen in an ETC), the variations in frequency responses measured at the listening position were not necessarily reduced. If the Cremer and Müller perceptual-summation effect is incorporated, the multiple smaller reflections seen in the ETC may end up being perceived as louder than anticipated. It is suggested, however, that a diffuse reflecting surface may make listening position less critical.
So there are both subjective and objective perspectives indicating that breaking up reflective surfaces may not yield results that align with our intuitions. It is another of those topics worthy of more investigation.
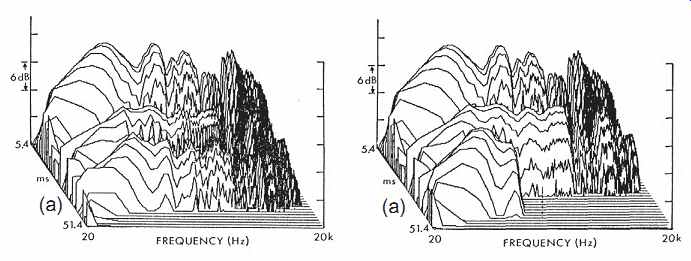
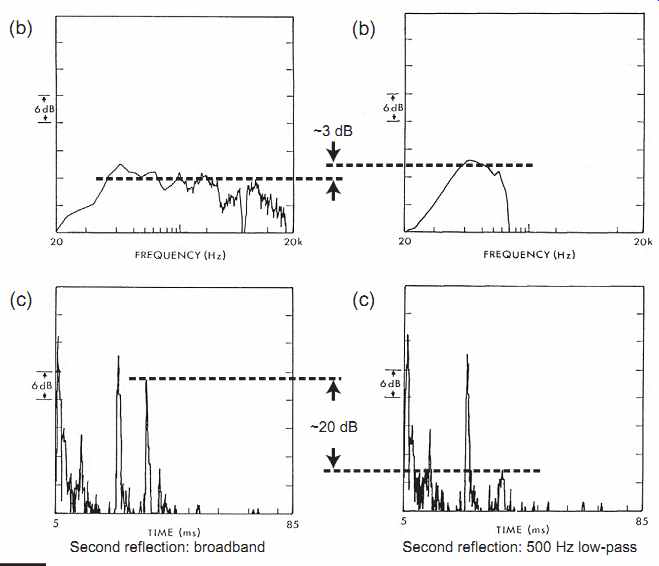
FIG. 18 The left column of data shows results when the second of
a series of reflections was adjusted to the threshold of detection when
it was broadband; the right column shows comparable data when the reflection
was low-pass filtered at 500 Hz. (a) Shows the waterfall diagram, (b)
the spectrum of the second reflection taken from the waterfall, and (c)
the ETC measured with a Techron 12 in its default condition (Hamming
windowing). The signal was speech. The horizontal dotted lines are "eyeball" estimates
of reflection levels. From Olive and Toole, 1989, Figures 18 and 19.
6. MEASURING REFLECTIONS
It seems obvious to look at reflections in the time domain, in a "reflectogram" or impulse response, a simple oscilloscope-like display of events as a function of time or, the currently popular alternative, the ETC (energy-time curve). In such displays, the strength of the reflection would be represented by the height of the spike. However, the height of a spike is affected by the frequency content of the reflection, and time-domain displays are "blind" to spectrum. The measurement has no information about the frequency content of the sound it rep resents. Only if the spectra of the sounds represented by two spikes are identical can they legitimately be compared.
Let us take an example. In a very common room acoustic situation, suppose a time-domain measurement reveals a reflection that it is believed needs attenuation. Following a common procedure, a large panel of fiberglass is placed at the reflection point. It is respectably thick-2 in. (50 mm)-so it attenuates sounds above about 500 Hz. A new measurement is made, and-behold!-the spike has gone down. Success, right? Maybe not.
In a controlled situation, Olive and Toole (1989) performed a test intended to show how different measurements portrayed reflections that, subjectively, were adjusted to be at the threshold of detection. So from the listener's perspective, the two reflections that are about to be discussed are the same: just at the point of audibility or inaudibility.
The results are shown in FIG. 18. At the top, the (a) graphs are waterfall diagrams displaying events in three dimensions. At the rear is the direct sound, the next event in time is an intermediate reflection, and at the front is the second reflection, the one that we are interested in. It can be seen that the second reflection is broadband in the left-hand diagram and that frequencies above 500 Hz have been eliminated in the right-hand version. When that particular "layer" of the waterfall is isolated, as in the (b) displays, the differences in frequency content are obvious. The amplitudes are rather similar, although the low-pass filtered version is a little higher, which seems to make sense considering that slightly over 5 octaves of the audible spectrum have been removed from the signal. Recall that these signals have been adjusted to produce the same subjective effect-a threshold detection-and it would be logical for a reduced bandwidth signal to be higher in level.
In contrast, the (c) displays, showing the ETC measurements, were telling us that there might be a difference of about 20 dB in the opposite direction; the narrow-band sound is shown to be lower in level. Obviously, this particular form of the measurement is not a good correlate with the audible effect in this test.
The message is that we need to know the spectrum level of reflections to be able to gauge their relative audible effects. This can be done using time-domain representations, like ETC or impulse responses, but it must be done using a method that equates the spectra in all of the spikes in the display, such as bandpass filtering. Examining the "slices" of a waterfall would also be to the point, as would performing FFTs on individual reflections isolated by time windowing of an impulse response. Such processes need to be done with care because of the trade-off between time and frequency resolution, as explained in Section 13.5. It is quite possible to generate meaningless data.
All of this is especially relevant in room acoustics because acoustical materials, absorbers, and diffusers routinely modify the spectra of reflected sounds.
Whenever the direct and reflected sounds have different spectra, simple broad band ETCs or impulse responses are not trustworthy indicators of audible effects.