By Joseph J. Carr, CET
Spot-tests of patients blood pressures usually are done by the "cuff" method. Long-term monitoring of blood pressure requires sophisticated electronic equipment, including pressure transducers and amplifier/readout modules. The information supplements our continuing coverage of industrial electronics, and gives us a glimpse into the fascinating world of medical electronics.
A History Of Blood-Pressure Measurements
One of the most frequent measurements made by doctors is "taking" the patients blood pres sure. This uncomplicated test is made possible by one important fact: human hearts do not pump in a smooth stream, but the heartbeat creates a pulsatile blood flow through the arteries. The changing pressure can be felt at the wrist, neck, and other areas of the body.
Stephen Hales, an Englishman, is credited with taking the first direct measurements of arterial pressure.
About 1773, he inserted a thin manometer tube directly into one of the neck arteries of an unanesthetized horse. Of course, most people would object to such a method for them. The modern indirect method (without incision), using the familiar blood-pressure cuff, was in vented in 1905 by N. S. Korotkoff.
The sounds heard during the test have been named in his honor.
But, the technique was not verified for general clinical use until the early 1930s.
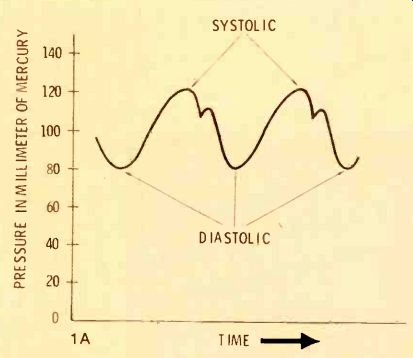
---------Figure 1 Normal human blood pressure waveforms resemble the
typical ones in (A). Korotkoff sounds (B) first are heard when the "cuff" pressure
drops to the systolic pres sure, and they disappear when the cuff pressure
is below the diastolic pressure. Therefore, blood pressure is indicated
by a double number, such as 120/80.
Blood-Pressure Waveform
Figure 1A shows a typical human arterial blood-pressure waveform for a person whose pressure is "120 over 80," or "120/80." After the heart contracts, the arterial pres sure rises to the maximum value (systolic), and then falls to the resting value (diastolic) between heartbeats.
For the indirect "cuff" method of measuring blood pressure, a cuff (bladder) is wrapped around the patient's arm. It is equipped with a rubber squeeze ball, used for inflating the cuff with air pressure.
A mercury column (or a gauge) reads the air pressure inside the cuff. This equipment is known as a "sphygmomanometer."
Measuring Blood Pressure With the Cuff
In typical operation, the cuff is wrapped around the patient's arm, and the doctor or nurse places a stethoscope downstream (usually at the inside of the elbow) While listening with the stethoscope, the operator pumps up the cuff pres sure until it is high enough to stop the flow of all blood in the artery that's being monitored. Now, the cuff pressure is allowed to leak slowly (about 3 millimeters of mercury per second is considered best), while the operator watches the mercury column or spring-loaded gauge that shows the cuff pressure.
When the systolic pressure is just sufficient to overcome the cuff pressure, the operator will hear in the stethoscope the characteristic "Korotkoff sounds (crashing, turbulent sounds). These sounds continue until the cuff pressure drops to the level of the patient's diastolic pressure, as shown by the drawing of Figure 1B.
It's fascinating to analyze the Korotkoff sounds by comparing them to a similar electronic condition. Assume an amplifier stage using a NPN transistor, plus a circuit to vary the DC forward bias from zero up to the normal positive voltage. Also, we must specify an input sine wave signal, having a peak amplitude that's less than the required DC bias. (The peak amplitude corresponds to the blood pressure between the systolic and diastolic points, and the DC bias is representative of the cuff pressure.) Starting with the DC bias at zero voltage, the transistor will have no gain and no output (the cuff pressure is greater than the systolic pressure). When the cutoff is reduced (by increasing the forward bias) the input tips of the sine waves act as bias, strengthening the DC bias, and the output has weak pulses. Further reduction of cutoff allows amplification of about half of each sine wave; therefore, stronger pulses are produced at the collector. Both of these conditions result in a distorted signal, which has many extra harmonics, and the output sound is a loud buzz. (These correspond to the loud Korotkoff sounds; they also are heard mostly because the jagged waveform has high harmonics that fall within the pass band of the stethoscope.) Additional reduction of the transistor cutoff reduces the distortion, allowing the sine waves to show only a slight clipping of the negative peaks. Finally, with nor mal bias, the output at the collector has perfect sine waves, which sound weaker because the harmonics are gone, and the result is a smooth hum. (When the cuff pressure drops below the diastolic pressure, the stethoscope is trying to repro duce a 1-Hz to 1 1/2-Hz near-sine wave. But this is below the cutoff frequency of the stethoscope, so the operator hears little sound.)
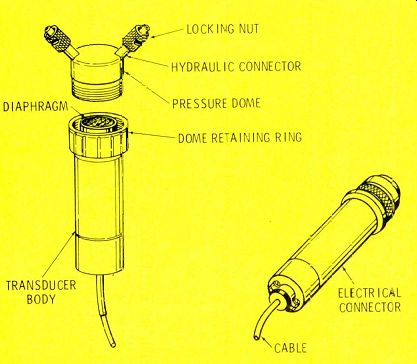
Figure 2 (A) A Hewlett-Packard 1280-series blood-pressure transducer
is shown by the drawing. (B) The picture shows the appearance of a
Statham transducer. (Courtesy of Statham Instruments)
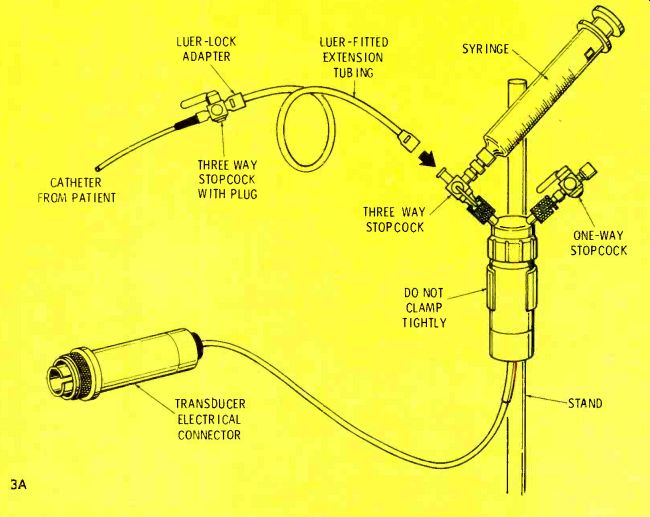
Figure 3 A typical bed side setup for measuring blood pressure is
shown at (A). A calibration method (B) for Hewlett-Packard transducers
uses a squeeze bulb and a gauge.
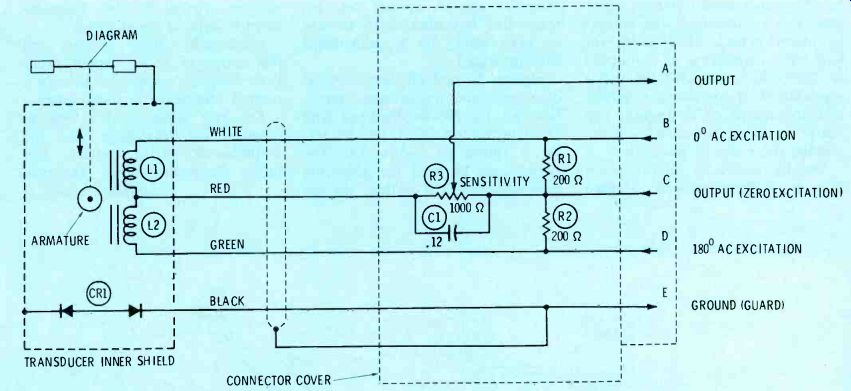
Figure 4 This is the internal circuit of Hewlett-Packard 1280-series
blood-pressure transducers. The three resistors are mounted inside
the large connector. Included is a graph of pressure versus output
voltage.
Continuous BP Monitoring
The cuff method of checking ,blood pressure requires a minimum of equipment, and it is very useful for short spot measurements. However, it is cumbersome and subject to many errors when used for long-term monitoring in a hospital or clinic. For example, the whole attention of an operator is required, and the noises of a hospital can mask the faint Korotkoff sounds, making the readings uncertain.
Usually, long-term monitoring is done by a direct method, adapted from the Hales method of two centuries ago. A special pressure transducer is connected to an arm or wrist artery by a saline-filled catheter (tube).
Figures 2A and 2B show medical blood-pressure transducers manufactured by Hewlett-Packard and Statham, while a typical bedside set up is shown in Figure 3A. The syringe can be used for delivering medications to the patient via the catheter, or for withdrawing blood samples needed for lab measurement of arterial blood gases.
Incidentally, these syringes are the source of many service problems; they are capable of ruining a normal transducer in short order! For best accuracy, it's best to calibrate the transducer and the amplifier for it at bedside, just before the measurement. The procedure (Figure 3B) should be done only after the nurse or physician has disconnected the transducer from the patient's arterial line (called the A-line).
The individual manufacturers use different techniques for simplifying the calibration procedure, while preventing excessive loss of ac curacy. For example, some provide hand-selected transducers that meet a rigid specification. This works fine for a time, but the rugged environment of the hospital soon ruins the calibration, and the manometer must be used.
Other manufacturers provide a "scale factor" or "calibration factor" for each transducer. The factor is dialed into the pressure amplifier (usually it's just a gain adjustment that allows the amplifier to produce a standard output for a given pressure. These calibration factors are valid only for a short time after they are calculated, and afterwards the manometer must be used to re-determine the correct setting.
Another approach is to include a sensitivity control inside either the transducer or its connector (see Figure 4). This control should be adjusted so a specified output signal amplitude is obtained for a standard applied pressure.
Balanced Bridges
Most late-model blood-pressure transducers are variations of the Wheatstone bridge. For example, the Statham transducers consist of a four-element resistive strain gauge that's bonded to a thin metal diaphragm where the pressure is applied. When pressure moves the diaphragm, the resistances are varied in opposite values. Either AC or DC excitation is applied across two opposite ends of the bridge, and the output signal is taken from the other pair of opposing connections.
Circuit of the Hewlett-Packard model 1280 blood-pressure transducer is shown in Figure 4. The resistors R1 and R2, and the inductors L1 and L2 are the four arms of a bridge. AC excitation is applied between pins B and D, while the output is taken from pins A and C. Most Hewlett-Packard pressure amplifiers supply an ex citation of S-volts RMS at 2400 Hz.
When the pressure is zero (that is, the transducer is at atmospheric pressure), the diaphragm is at rest, with the core armature positioned equally in L1 and L2. This makes the inductive reactances equal in value, the bridge is balanced, and no output AC signal appears be tween pins A and C.
However, as pressure is applied, the armature moves, and the inductors no longer are matched. An output voltage is produced, because the bridge now is unbalanced.
The Hewlett-Packard transducer comes equipped with a large electrical connector (see Figure 2A) that houses R1, R2, and R3. Potentiometer R3 is the sensitivity-calibration adjustment, mentioned be fore.
Transducer sensitivity
If we know the excitation voltage and the applied pressure, the sensitivity specification of a transducer allows a calculation of the output level. Sensitivity is given in units of µV/V/MM Hg. Thus, a typical transducer might have a sensitivity of 10 µV/V/MM Hg.
Then, if the excitation is 10 volts, and the applied pressure is 120 MM of Hg, the output will be 10 x 10 x 120 µV = 12,000 µV (or 12 millivolts).
Such a small output voltage requires amplification, and some times other processing, before it is displayed on a meter or on a graphical device such as an oscilloscope or a strip-chart recorder.
Commercial Monitoring Systems
The Statham patient-monitoring system (Figure 5A) contains a strip-chart recorder, an electro cardiograph (ECG) amplifier, a blood-pressure amplifier, and a two-channel non-fade scope. Incidentally, this kind of scope is very popular because it allows the waveform to remain on the screen long enough to permit a detailed visual analysis. In fact, the trace can be frozen indefinitely. These scopes have a digital data-storage system to hold the trace. An analog-to-digital converter digitizes the analog waveform, and stores it in a computer-like memory. Then, a digital-to-analog converter re-converts the digital signal to the original analog signal for the vertical amplifiers of the scope.
Figure 5B shows the Hewlett Packard mainframe that contains (in this particular case) an ECG preamplifier/heart-rate module, and a pressure-amplifier module. In the H-P system, a series of half-rack module cabinets are used.
Some instruments, such as a scope, take up an entire half rack. Others, such as a strip-chart recorder, require a full rack. But, most are the quarter-rack type, as shown in the picture.
A different type of pressure-monitoring system is shown in Figure 5C. It is a complete physiological monitoring system manufactured by "Electronics for Medicine" (E-for-M). Model VR-6 is used extensively in medical and life-sciences research, or clinically in cardiac catheterization laboratories. The right side of the upper deck contains the scope and its controls, while the left side is a preamplifier rack. This particular system has two pressure amplifiers (3 and 4), and several other types.
A scope-trace recording device is on the lower section. A light sensitive roll of paper is passed in front of a CRT that shows the same trace as that on the upper scope.
This type of recording is required when high-frequency (over a few hundred Hertz) features of the waveform must be recorded. Pens simply can't follow the fast motion of such signals.
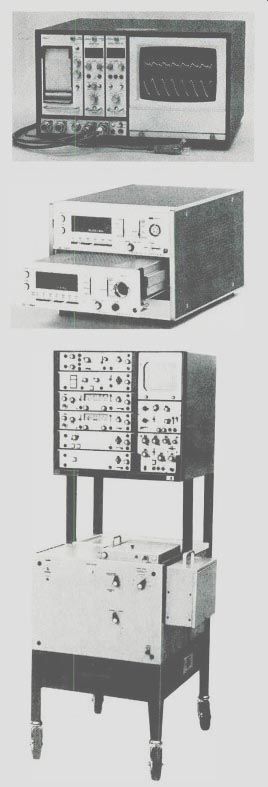
Figure 5A This Statham bedside monitor has (from left to right) a
strip-chart recorder, heart-rate module, blood-pressure module, and
a scope, with a P23 ID transducer in front. (Courtesy of Statham)
Figure 5B A Hewlett-Packard main frame for bedside monitoring can have any of several modules. In this case, the top unit is an ECG preamplifier and heart-rate module, and at the bottom is a blood-pressure module. (Courtesy of Hewlett-Packard)
Figure 5C A complete model VR-6 physiological monitoring system by "Electronics For Medicine" includes two blood-pressure amplifiers with meters, plus a scope for viewing most of the waveforms from the various instruments. At the bottom is a strip-chart recorder, for permanent waveforms. (Courtesy of Electronics For Medicine)
Transducer Amplifiers
Two basic types of transducer amplifiers are used in the measurements of pressures. They are: DC; and AC carrier. Each DC amplifier has a differential input to accommodate the output terminals of the transducer, and balance out most of the hum pickup. But, the other stages are single-ended. Operational amplifiers (op-amps) often are used in such circuits.
The other type of transducer amplifier employs an AC carrier, as found in Hewlett-Packard models.
Carrier amplifiers can operate either from resistive or inductive transducers, although they usually are designed for inductive transducers. Amplitude of the signal is proportional to the pressure in the system, while the phase of the signal indicates whether a pressure or a vacuum is being measured.
Either the carrier amplifier will accept excitation from the main frame, or it will generate its own AC carrier, depending on the model. As mentioned, H-P uses 2.4-KHz carriers, but others use a 1-KHz or a 5-KHz carrier, of a power sufficient to drive a 100-ohm load at the rated output (usually 5-volts RMS).
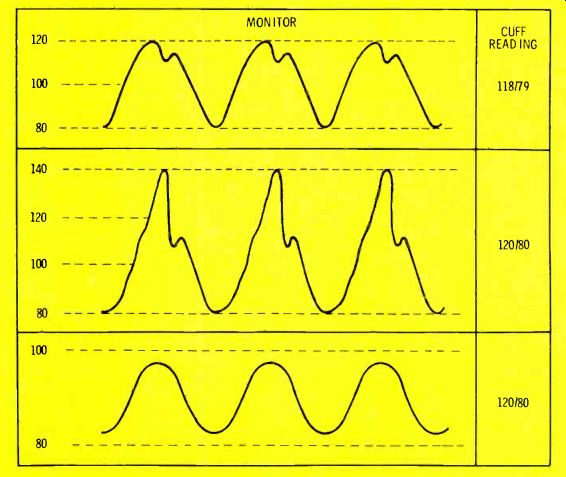
Figure
6 Pressure readings from cuffs and from pres sure amplifiers normally
are not identical, but they are close. Equipment troubles can cause
some of the wrong waveforms shown here. (A) This is a normal waveform
giving a 118/79 cuff reading. (B) Stretching of the peaks can be caused
by tubing resonances (ringing), giving a false 140/80 reading. (C)
Air or blood in the catheter line produces a damped waveform. In all
three cases, the cuff reading is the most correct.
Following amplification of the carrier, a synchronous detector (demodulator) is used to convert the transducer carrier signal to a DC voltage whose value varies according to the pressure at the transducer. One port of the detector receives the amplified AC signal, while the other is supplied with a sample of the carrier.
After detection, the DC output is filtered to remove any hash or residual carrier, and it will have the waveshape shown in Figure 1A.
This waveform can be displayed on a scope or a strip-chart recorder, usually calibrated in millimeters-of-mercury. Also, a numerical readout usually is provided, such as an analog or digital voltmeter plus a special processing circuit.
The processor has a peak-holder for systolic readings, and a peak-holder driven by an inverting amplifier for diastolic. H-P uses a scale factor of 10 mV/MM Hg, so the output voltage can be directly converted to pressure units of similar numbers.
Many pressure amplifiers also provide an optional mean-pressure readout. Mean-pressure is a mea sure of the time average (area under the curve) of the pressure wave. In electronic terms, it is the average pressure reading that's taken from the waveform.
However, medical people rely on an approximation calculated from the diastolic and systolic pressures (1/3 of the difference between the two pressures, plus the diastolic reading). I have found that medical people trust their approximation more than they do the electronic machines. Quite often they will ask you to "repair" the "defective" module. The solution is to "fix the customer" (that is, explain to them), but to do so very tactfully.
Discrepancies
There always will be a small discrepancy between cuff pressure and the monitor reading. But when the difference is large, however, something is wrong.
One possible source of error is hydrostatic pressure of the saline solution in the catheter on the transducer diaphragm; usually resulting from improper placement of the transducer.
The transducer diaphragm should be aligned mechanically so it is located about 10 CM above the patient (assuming that the patient is lying on his back). If the system has been balanced (zeroed and calibrated) with the transducer in another position, large errors are likely to result.
In Figure 6, two erroneous wave forms are shown, along with the correct typical one for comparison.
The effect of resonance (acoustic ringing) is shown in Figure 6B. If the catheter tubing finds resonances, then the rising edge of the waveform will tend to overshoot and ring. This is similar to the ringing of a tuned circuit in electronics. The cure for such ringing is to change the diameter of the tubing, the length, or the type of tubing. Another possibility is to reposition the catheter.
Some nurses have been known to "cure" ringing by introducing a small air bubble inside the transducer done. This wrong practice should be discouraged vigorously.
Air is a gas, so it is compressible. Liquids are non-compressible. Therefore, the introduction of air into a liquid pressure-measuring system will produce large errors.
A damped pressure signal (Figure 6C) is formed when blood or air bubbles get into the catheter line. A preventative method used by most hospitals is to have a constant flush of a solution through the system.
Hypotensive patients (those with low blood pressure) also might produce a smoother waveform, such as the one of Figure 6C, but the nurses usually know about low pressure from previous cuff measurements, and thus make allowances.
Strained transducers
Occasionally, you might see "strained" transducers that indicate a pressure or a vacuum, even when open to the atmosphere. Often, it is caused by the syringe mentioned before. Most transducers can't tolerate much of a vacuum, or too much overpressure. Typically, they operate up to a pressure of +400 MM Hg, but down only to-50 or-100 MM Hg without some damage or change of calibration. If the stopcocks are in the wrong positions when a nurse attempts to withdraw a blood sample for gases analysis, a vacuum will be applied to the diaphragm. The small 3-CC syringes are the worst offenders, for they can generate either high pressures or a high vacuum.
Test simulator
A simulator (that replaces the transducer during tests of a blood-pressure system) either can be purchased (Med-Search Systems, Inc., Chevy Chase, Maryland), or you can build a less-accurate version (Figure 7). Construct the circuit inside a shielded box, and use a connector that's compatible with the system you are trouble shooting.
The four resistors form a bridge.
Although the precise resistances are not critical, they must be matched closely, perhaps by using or selecting 1% (or better) tolerance resistors.
When switch S1 is open to simulate zero pressure, the bridge is balanced. The other two switch positions unbalance the bridge by different amounts, to simulate various unbalances. One of the resistors should select a value duplicating a 0-to-30 MM Hg venous pressure range, and the other should simulate the arterial range of 0-to-300 MM Hg.
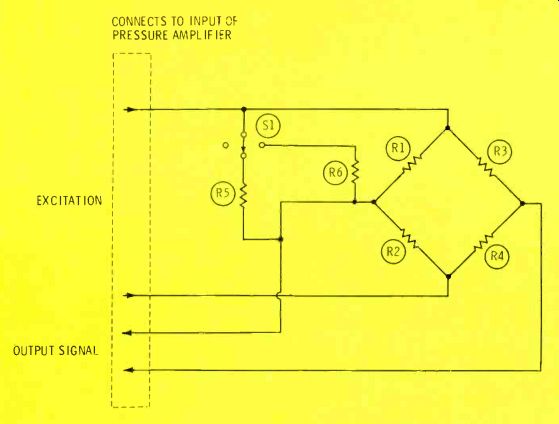
Figure 7 A simulator (for testing pressure transducers and amplifiers)
can be purchased or constructed.
The resistance bridge (made of 1%-or better matched resistors for R1, R2, R3, and R4) simulates a zero reading in the atmosphere. Switching in R5 or R6 should produce a reading that's typical for venous or arterial pressures.
Note: this information about electronic blood-pressure monitors (plus factory manuals of each machine) can help you get started repairing similar equipment. However, we urge you to obtain further training before you actually begin such repairs. With medical equipment, human lives can be endangered by substandard work; therefore, your responsibility as a technician is enormous. Prepare wisely.
Also see: Over the Cups of Coffee--A practical philosophy of troubleshooting