By Sam Wilson, CET
A model is a simplified way of looking at a component, circuit, or system. An example is electron flow in a circuit.

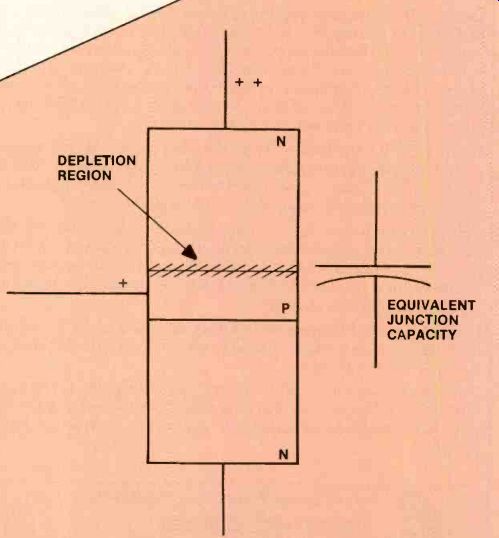
Figure 1. At a semiconductor PN junction, holes and electrons combine, forming
a depletion region. EQUIVALENT JUNCTION CAPACITY
By assuming that electric cur rent is a flow of electrons, we can analyze circuit behavior. Actually, it is just as easy to assume the current to be positive charges and go through the circuit in the opposite direction.
Regardless of which direction you go, you are using a model that simplified the job of understanding the circuit. Actually, the current probably goes both directions at the same time. But, knowing that wouldn't be much help if you are trying to figure out how a differential amplifier (or any other circuit) will work for various input signals.
There is nothing wrong with models. They're great to live with, but don't marry them. The older they get the harder they are to live with and the harder they are to get rid of.
High voltage bipolar transistor circuits
As an example, consider the idea that solid-state circuits are operated with low voltages. Students today go through technical schools working with transistors, FETs and integrated circuits that work at a maximum of 24V. That protects the school from problems that can occur if a student should get zapped accidentally.
I often wonder how long they are out of school before they poke their fingers into a high-voltage solid state circuit. They get complacent working with the nice (safe?) circuits on their proto boards.
A bipolar (NPN or PNP) transistor is normally operated with the base-collector junction reverse biased. An exception is in switching circuits in which the emitter -base and collector -base junctions both can be forward biased.
In this discussion, however, let's assume that the transistor is being used for a high frequency or very broad range of frequencies.
The model of Figure 1 shows that there is a depletion (insulating) region between the base and the collector. During the normal operation of the transistor in an amplifier, the reverse bias in creases this depletion region.
The junction capacity that is formed by the depletion region and the P and N materials can be very troublesome at high frequencies.
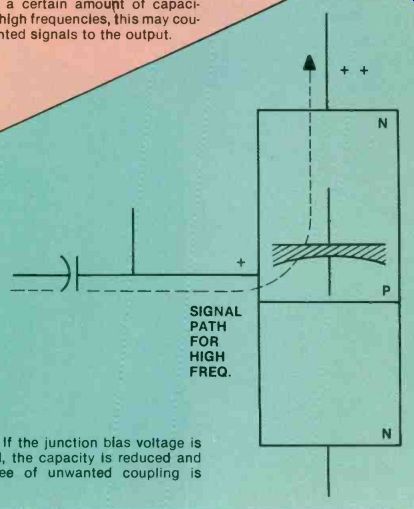
As shown in Figure 2, the high -frequency signal sneaks through the capacity so it appears at the output without being measured.
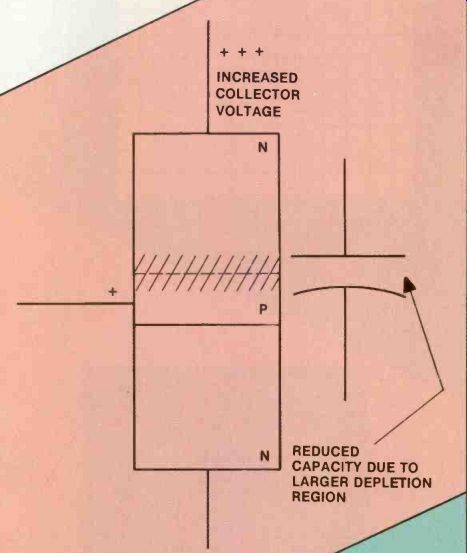
By greatly increasing the collector voltage, as shown in Figure 3, the depletion region is increased.
That has the effect of moving the capacitor plates apart and lowering the junction capacity. The overall result is that the high frequency capability is improved...
and so much for the idea that transistors are always connected into low-voltage circuits.
High-voltage MOSFETS Depletion-type MOSFETS are usually connected into low-voltage circuits. However, enhancement MOSFETS can be another story altogether.
-----------

Figure 2. The PN junction has as a characteristic a certain amount of capacitance.
At high frequencies, this may couple unwanted signals to the output.

Figure 3. If the junction bias voltage is increased, the capacity is reduced
and the degree of unwanted coupling is reduced.
--------------

Figure 4. This family of curves for an RRF-430 MOSFET implies that the power-supply
voltage in a circuit using it could easily be above 150V.

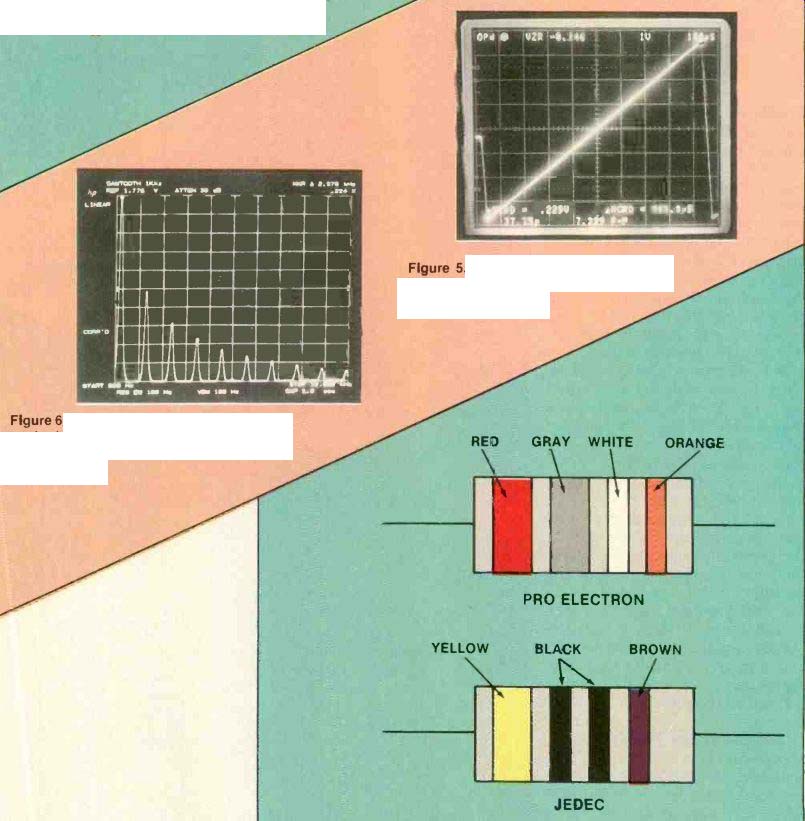
Figure 5. Here's a very linear sawtooth created in the lab
Figure 6. This photo shows the harmonic content of the sawtooth in Figure 5. The bright spot on the fourth harmonic is a delta marker.
Figure 7. Two color codes are current; in use for semiconductor diodes: JEDEC and PRO ELECTRON.
--------------
Consider, for example, the family of curves in Figure 4 for an RRF-430 MOSFET. This curve was taken from an RCA catalog.
Note the high voltages on the voltage axis. The power -supply voltage in a circuit using this MOS FET could easily be above 150V! This is another example of a high -voltage, solid-state circuit.
Letter from a reader
For many years reader Ramon Valdes has been sending comments, suggestions and a few criticisms. In one of his letters he sent pictures of his laboratory. He is well equipped for experimenting.
At the present time Mr. Valdes is experimenting with the use of a sawtooth waveform (instead of a square wave) for analyzing amplifiers.
Figure 5 shows a photograph of a very linear sawtooth that he has generated in his lab; Figure 6 shows the harmonic content of the sawtooth displayed on his equipment. The bright spot on the fourth harmonic is a delta marker.
Although he experimented with a sawtooth test, he doesn't consider it to be very useful. Here is a direct quote from his letter:
"Your article `Tests for Low -Frequency Amplifiers' in the September and October 1986 issue of Electronic Servicing and Technology states the following: "Having presented the case for the sawtooth waveform test, the next question is: Why is it seldom used?' The answer is that there are automatic distortion analyzers on the market that will quantify distortion instantly and without eyeballing. Tektronix, Hewlett Packard, Amber, Sound Technology, Krohn-Hite and probably others make analyzers that not only have automatic nulling but also auto-input ranging. If you do warranty work, the unit you repair must meet specifications as to output voltage, distortion, bandwidth, etc. Therefore, sawtooth or square wave testing might be an excellent empirical test procedure if you have sophisticated test gear, but very impractical for routine servicing.
Even the use of a function generator for judging at what frequency an amplifier is down to 70.7% is awkward because all of these distortion analyzers can be set to relative zero dB settings; al you do is vary the frequency until the meter reads - 3dB." My comment I agree with what Mr. Valdes says about better equipment being available for quantitative tests. I have never advocated the use o the sawtooth or square wave test for that type of application.
The sawtooth or square wave should be used for a qualitative test. In other words, it requires a judgment and experience to be useful. You don't get a number, such as a frequency value, to tel the bandwidth. Instead, your experience must be used to evaluate the resulting display.
It is a quick test that utilizes low cost test equipment. Think of the sawtooth and/or the square wave as a troubleshooting tool and no as a method of testing an amplifier against specifications.
Diode color codes It is a good idea to review various color codes of components as a memory refresher. There are two diode color codes being used:
JEDEC and PRO ELECTRON.
Both are shown in Figure 7.
The wide band for the JEDEC code shows where to start reading (hold the diode so the wide band is on the left as shown in the illustration). A 1N is assumed to precede the code, and the bands are the identifying number. For the example shown, the diode is a type 1N4001.
Table 1 shows the code for the PRO ELECTRON type. The example shown is a BA Y 93.
--------------
TABLE 1
Broad bands
First Second band
band
Small bands
Serial number AA - brown BA - red Z- white Y- grey X- black W- blue V- green T-yellow S - orange
0- black 1- brown 2 - red 3-orange 4 -yellow 5 -green 6-blue 7 - violet 8- grey 9-white
Also see: