AMAZON multi-meters discounts AMAZON oscilloscope discounts
Objectives
This Section will help you understand the need for documentation and become familiar with the use of symbols in process control flow diagrams.
The following are covered in this Section:
_ Alarm and trip systems and documentation
_ Programmable logic controller (PLC) documentation
_ Interconnection symbols and flow line abbreviations used in piping diagrams
_ Instrument Society of America (ISA) list of standard symbols
_ Standard instrument symbols and identification letters
_ Standard functional actuator symbols
_ Control loop numbering system and pipe and identification (P and ID) drawings
1. Introduction
Documentation covers front-end engineering and detailed engineering drawings.
Of the overwhelming amount of documentation needed in a plant, the only documentation that will be introduced is limited to documentation you may encounter and need to use, such as alarm and trip Systems, PLC documentation, and pipe and identification diagrams (P and ID). Of these the P and ID is the detailed documentation covering instruments, their location, process control loops, and process flow details. Documentation standards and symbols have been set up and standardized by the ISA in conjunction with the American National Standards Institute (ANSI).
2. System Documentation
2.1 Alarm and trip systems
Alarm and trip system information and implementation is given in ANSI/ISA 84.01-1996-Application of Safety Instrumented Systems for the Process Control Industry. The purpose of an alarm system is to bring a malfunction to the attention of operators and maintenance personnel, whereas that of a trip system is to shut down a system in an orderly fashion when a malfunction occurs, or switch failed units over to standby units. The elements used in the process control system are the first line of warning of a failure. The sensors and instruments used in the alarm and trip system are the second line of defense and must be totally separate from those used in the process control system.
The alarm and trip system or Safety Instrumented System (SIS) has its own sensors, logic, and control elements so that under failure conditions it will take the process to a safe state to protect the personnel, facility, and environment. To ensure full functionality of the SIS, it must be regularly tested. In the extreme with deadly chemicals, a second SIS system and redundancy can be used in conjunction with the first SIS system to ensure 100 percent protection. The sensors in the SIS will usually be of a different type than those used for process control.
The control devices are used to accurately sense varying levels in the measured variable, whereas the SIS sensor is used to sense a trip point and can be a much more reliable rugged device. The use of redundancy in a system must not be used as a justification for low reliability cheap components. A common SIS system is the dual redundancy system that consists of the main SIS with two redundant systems. In this case, a two out of three logic monitoring system determines if a monitor has failed or the system has failed by correlation between the outputs.
A two out of three logic circuit is shown in FIG. 1a. The truth table is shown in FIG. 1b; the inputs are normally low (0). If one input goes high (1) it would indicate a monitor failure and the monitor failure output would go from 0 to 1 but the system output would remain at 0. If 2 or more inputs go high it would indicate a system failure and the system failure output would go from 0 to 1 as shown.
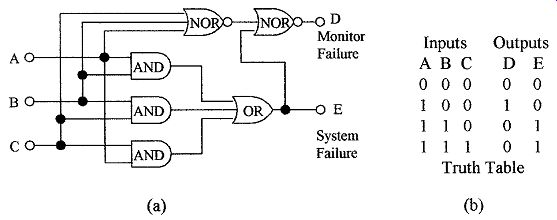
FIG. 1 Monitor and (a) two out of three failure indicator and (b)
truth table.
In SIS systems failure analysis, the rate of component failure is as follows:
Logic 8%
Sensors 42%
Control devices 50%
2.2 Alarm and trip documentation
Good up-to-date documentation is a must in alarm and trip systems. All SIS devices should be clearly marked and numbered. System drawings must show all SIS devices using standard symbols, their location, function, and set limits. Drawings must include lock and logic diagrams.
The types of information required in alarm and trip documentation are as follows:
1. Safety requirement specifications
2. Logic diagram with functional description
3. Functional test procedures and required maintenance
4. Process monitoring points and trip levels
5. Description of SIS action if tripped
6. Action to be taken if SIS power is lost
7. Manual shut down procedures
8. Restarting procedures after SIS shut down
2.3 PLC documentation
As with all technical devices detailed engineering records are essential. Without accurate drawings, changes and modifications needed for upgrading are extremely difficult or impossible. Every wire from the PLC to the monitoring and control equipment must be clearly marked at both ends and shown on the wiring diagram to facilitate wiring changes and diagnostics. The PLC must have complete up-to-date ladder diagrams (or other approved language). Every rung must be labeled with a complete description of its function.
The essential documents in a PLC package are as follows:
1. System overview and complete description of control operation
2. Block diagram of the units in the system
3. Complete list of every input and output, destination, and number
4. Wiring diagram of I/O modules, address identification for each I/O point, and rack location
5. Rung description, number, and function
3. Pipe and Identification Diagrams
3.1 Standardization
The electronics industry has standard symbols to represent circuit components for use in circuit schematics and similarly the processing industry has developed standard symbols to represent the elements in a process control system.
Instead of a circuit schematic the processing industrial drawings are known as pipe and identification diagrams (P and ID) (not to be confused with PID) and represents how the components and elements in the processing plant are inter connected. Symbols have been developed to represent all of the components used in industrial processing and have been standardized by ANSI and ISA. The P and ID document is the ANSI/ISA S5.1-1984 (R 1992)-Instrumentation Symbols and Identification Standards. An overview of the symbols used is given in this Section but the list is not complete. The ISA should be contacted for a complete list of standard symbols.
P and IDs or engineering flow diagrams were developed for the detailed design of the processing plant. The diagrams show complete details of all the required piping, instruments and location, signal lines, control loops, control systems, and equipment in the facility. The process flow diagrams and plant control requirements are generated by a team from process engineering and control engineering. Changes to the P and ID are normally the responsibility of process engineering and must be approved and signed off by the same. These engineering drawings must be correct, current, up-to-date, and rigorously maintained. Every P and ID change must be approved and recorded. If not, time is lost in maintenance, repair, and modifications, not to mention the catastrophic errors that can be made by using obsolete drawings.
P and ID typically show the following types of information:
1. Plant equipment and vessels showing location, capacity, pressure, liquid level operating range, usage and so on
2. All interconnection lines distinguishing between the types of interconnection, i.e., gas or electrical and operating range of line
3. All motors giving voltage and power and other relevant information
4. Instrumentation showing location of instrument, its major function, process control loop number, and range
5. Control valves giving type of control, type of valve, type of valve action, fail save features, and flow plus pressure information
6. The ranges for all safety valves, pressure regulators, temperatures, and operating ranges
7. All sensing devices, recorders, and transmitters with control loop numbers
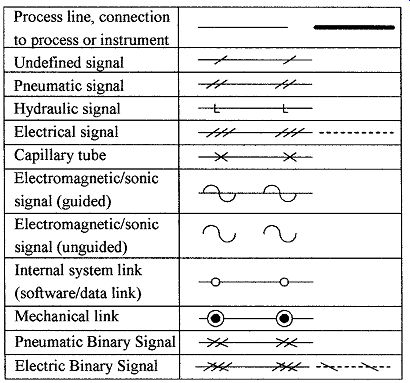
FIG. 2 Symbols for instrument line interconnection.
3.2 Interconnections
The standard on interconnections specifies the type of symbols to be used to represent the various types of connections in a processing plant (see FIG. 2).
The solid bold lines are used to represent the primary lines used for process product flow and the plain solid lines are used to represent secondary flows such as steam for heating. Abbreviations for secondary flow lines are given in Table 1.
The abbreviations are placed adjacent to the lines to indicate their function as shown in FIG. 3.
In the list of assigned symbols for interconnect lines given in FIG. 2, one symbol is undefined and can be assigned at the users discretion for a special connection not covered by any of the assigned interconnection symbols. The binary signals can be used for digital signals or pulses. It is also necessary to show on the P and ID the signal's content and range. For example, electrical interconnections can be either signal current or voltage and would be marked as 4 to 20 mA or 0 to 5 V, examples of signal lines with the signals content and range marking are shown in FIG. 3.
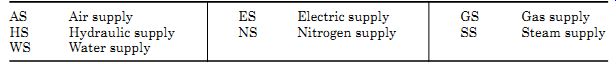
TABLE 1 Abbreviations for Secondary Flow Lines

FIG. 3 Method of indicating the signal content of a line.
3.3 Instrument symbols
FIG. 4 shows the symbols designated for instruments. Discrete instruments are represented by circles, shared instruments by a circle in a rectangle, computer functions by hexagons, and PLC functions by a diamond in a rectangle. A single horizontal line, no line, dashed line, or double line through the display is used to differentiate between location and accessibility to an operator, i.e., a line through an instrument may indicate the instrument is in a panel in the control room giving full access, no line could mean the instrument is in the process area and off limits to the operator, a double line means the possibility that the instrument is in a remote location but the operator can obtain access, whereas a dashed line means not available by virtue of being located in a totally inaccessible location.
3.4 Instrument identification
Instrument symbols should also contain letters and numbers. The letters are a shorthand way of giving the type of instrument, its use in the system, and the numbers identify the control loop. Usually 2 or 3 letters are used. The first letter identifies the measured or initiating variable, the following is a modifier, and the remaining letters identify the function. Table 2 shows some of the meaning of the assigned instrument letters.
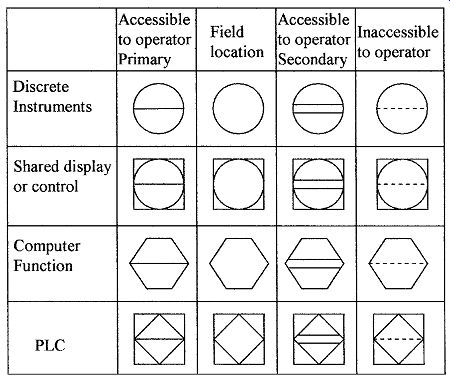
FIG. 4 Standardized instrument symbols.
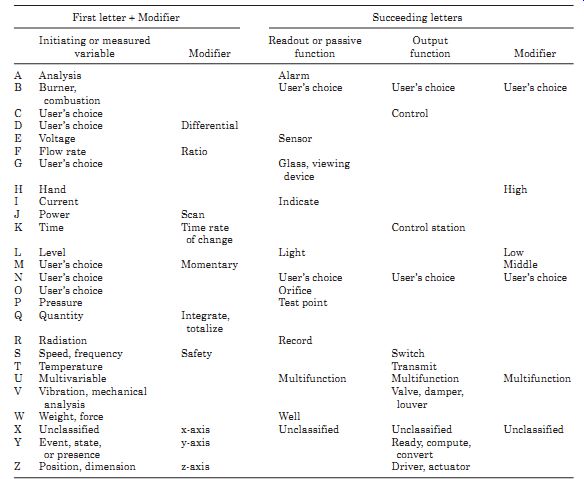
TABLE 2 Instrument Identification Letters
Examples of instrument identification are shown in FIG. 5, by referring to Figs. 2, 3, and Table 2, the instrument identification can be deter mined as follows:
a. The first letter T indicates that the instrument is in temperature loop number 178. The second letter Y denotes conversion, which from the line description gives the conversion from a current of 4 to 20 mA to a pressure of 3 to 15 psi. The instrument is a discrete instrument located in the field.
b. The designation of F indicates flow, R is for recorder, and C is a controller indicating a recording flow controller in loop 97. This is an accessible computer function.
c. The letter P denotes pressure, R is recorder, and the third letter T is transmitter, giving a recording pressure transmitter in loop 89 which is located in a secondary accessible location and is a PLC function.
d. The first letter L stands for level, A indicates alarm, and H is high, which is an alarm for high liquid levels located in loop 222 and is not accessible.
4 Functional Symbols A number of functional symbols or pictorial drawings are available for most P and ID elements. A few examples are given here to acquaint the student with these elements. They have been divided into actuators, primary elements, regulators, and math functions for clarity.
4.1 Actuators
The first row of examples and the last three drawings shown in FIG. 6 are the basic sections used in some of the actuator diagrams. The other drawings show how these basic sections can be combined to form families of actuators.
For instance, the hand actuator and the pneumatic actuator are shown combined with the control valve symbol to give a representation of a hand operated valve and a pneumatic operated valve in the second row. Note should also be taken of the arrows to represent the state of the valve under the system "fail" conditions.
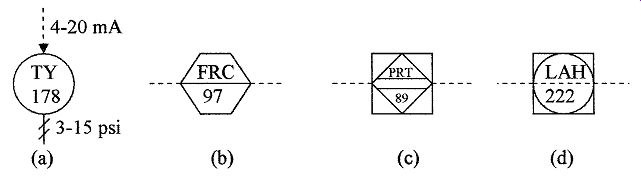
FIG. 5 Examples of the letter and numbering codes.
4.2 Primary elements
By far the largest numbers of elements used in P and ID are the primary elements; a sampling of these elements is given in FIG. 7. Lettering and numbers are included in the examples. Examples of basic and actuator symbols.
4.3 Regulators
Typical examples of regulators and safety valves are shown in FIG. 8.
4.4 Math functions
PLCs have a large number of math functions that can be implemented using soft ware. If these math functions are incorporated into a P and ID they will probably be executed using hardware, e.g., use of a square root to convert a pressure measurement to flow data. These functions have been symbolized; an example of the math symbols is shown in FIG. 9.
5. P and ID Drawings
All processing facilities will have a set of drawings using the standardized ISA symbols to show the plumbing, material flow, instrumentation, and control lines.
The drawings normally consist of one or more main drawing depicting the facility on a functional basis with support drawings showing details of the individual functions. In a large processing plant these could run into many tens of drawings.
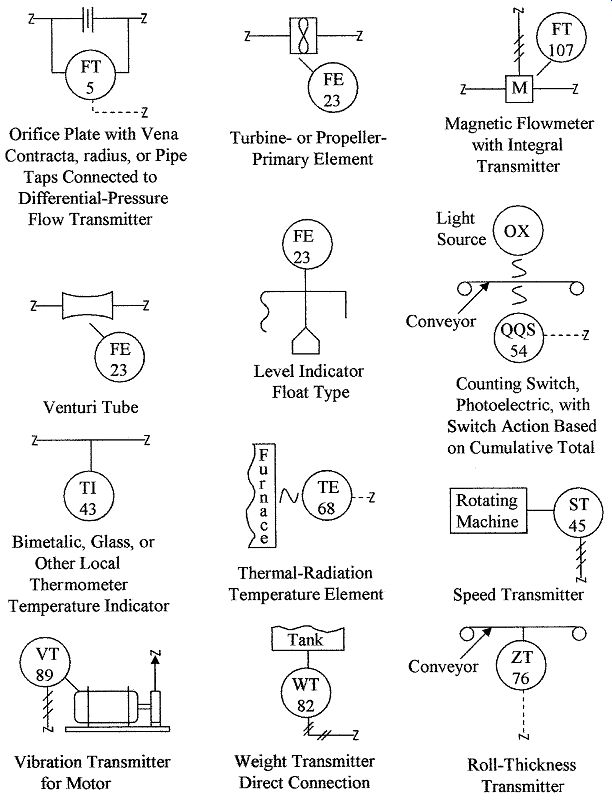
FIG. 7 Examples of primary elements used in P and ID.
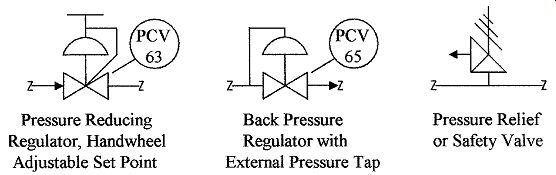
FIG. 8 Examples of regulators and safety valve symbols used in P and
ID.
Each drawing should have a part list, should be numbered, and have an area for revisions, notes, and approval signatures. It is imperative that these drawings are kept up-to-date; a few minutes taken to update a drawing can save many hours at a later date trying to figure out a problem on equipment that has been modified but whose drawings have not been updated. FIG. 10 shows an example of a function block. The interconnection lines and instruments are clearly marked and control loops numbered. A materials list is attached with appropriate places for revisions and signatures.
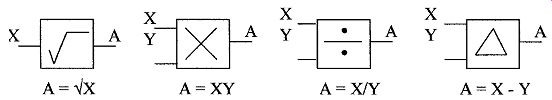
FIG. 9 Examples of math symbols used in P and ID.
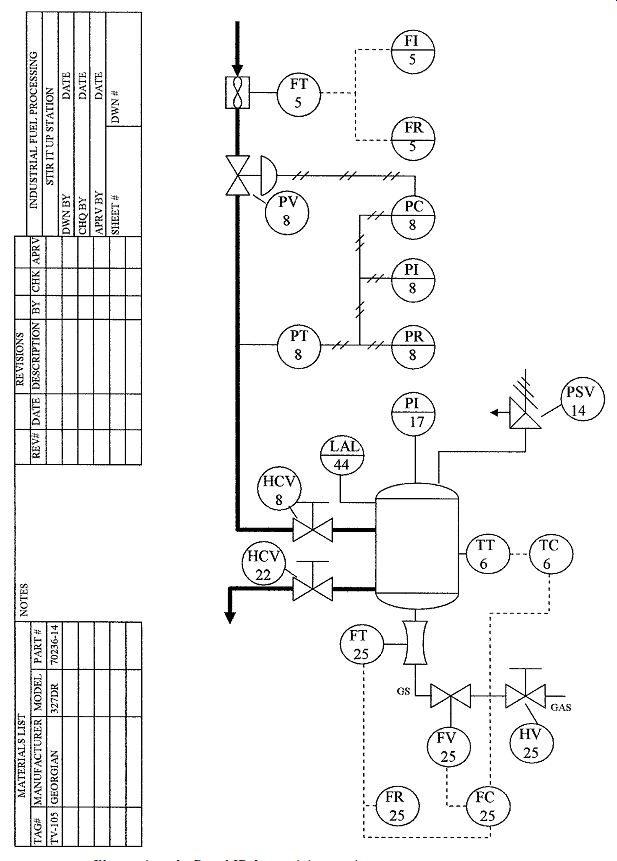
FIG. 10 Illustration of a P and ID for a mixing station.
Summary
This Section introduced the documentation for alarm and trip systems, PLCs, P and IDs, and the standards developed for the symbols used in P and ID drawings.
Points of discussion in this Section were as follows:
1. Alarm and trip systems and system documentation. The different types of sensors used in alarm system and the use of redundancy in alarm systems
2. The documentation required in PLC systems
3. The development of standards for process control symbols and drawings by ISA. The standards cover interconnection, supply lines, and the line symbols to be used
4. Symbols used for instruments, their identification, and the functional letters used with instruments and their meaning
5. Basic primary element symbols are shown and how they can be used make more complex elements
6. Examples of P and ID facility drawings and the information that should be contained in the drawings
FIG. 11 Diagrams and symbols for use with Probs. 1 through 10.
Problems
1 What does the drawing in FIG. 11a represent?
2 Draw a steam supply line and attach the line indicator.
3 What do you understand by the symbol shown in FIG. 11b?
4 Draw a speed recorder symbol as a computer function in the field location.
5 Describe the symbol shown in FIG. 11c.
6 Draw an electrically operated three way valve.
7 What does the symbol in FIG. 11d represent?
8 Draw a solenoid operated butterfly valve which is "open" in the fail mode.
9 What does the symbol in FIG. 11e represent?
10 What does the symbol in FIG. 11f represent?
11 Why should documentation be kept up-to-date?
12 Who normally has the responsible for keeping P and ID drawings up-to-date?
13 Who normally has the responsibility for developing P and ID drawings?
14 List the information that should be contained in a P and ID drawing.
15 List the information that should be contained in PLC documentation.
16 List the information that should be contained in alarm and trip documentation.
17 What is the purpose of the SIS?
18 What are the differences between the type of sensors used in SIS and process control?
19 Draw the symbol of an internal pressure loaded regulator.
20 Draw the symbol of a pneumatic operated butterfly valve.
Related Articles -- Top of Page -- Home