AMAZON multi-meters discounts AMAZON oscilloscope discounts
INTRODUCTION
There are many definitions of electrical power and distribution systems, but, in general, electricity is a form of energy, and a distribution system includes all machines, equipment, and cabling used in generation, transmission, and distribution of this energy, which must be available at any location when it is needed. Three things are required: production, transmission, and utilization.
Many methods are used in producing electricity. In the beginning the biggest source was water power. Water is stored at a high elevation and released. The energy that results in this water movement is capable of doing work. Work in this case is the moving of turbines, which in turn rotate generators, thereby generating electricity, To be useful to the consumer, this electricity must be transformed to a usable level and delivered to the home or business. The transmission and distribution of electricity is generally accomplished two ways: overhead or underground.
PRODUCTION OF ELECTRICITY
In addition to falling water, steam and nuclear power are sources of energy useful in generating electricity, Although wind and solar power have been used to generate electricity, they still account for a very small percentage of all electricity generated today. A block diagram of electrical generation is shown in FIG. 1.
Steam can be produced in a boiler using coal, oil, or natural gas. Any source of energy that can be used to produce rotational movement can be used to turn a generator. A typical generator is shown in FIG. 2.
A generator produces electricity at a low voltage, which must be raised by the use of a transformer so that it can be transmitted economically over long distances. The distribution of electrical power can be de scribed as a tree structure. The roots are the generating station. The trunk is the main transmission line. The large branches from the main substation are sub transmission lines. Finally, the smaller branches are the primary distribution lines, or feeders, with the smallest branches being the secondary distribution lines going to the leaves, or individual consumers.
This transmission and distribution system requires the use of transformers to step the voltages up and down, meters and other instruments to measure the quantity, and regulating devices, protective relays, and circuit breakers to control and ensure the stability of this electrical power. FIG. 3 is a flow diagram rep resenting a typical electric system.
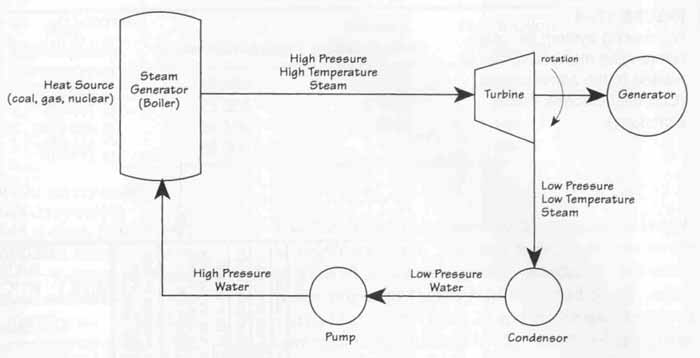
FIG. 1 Block diagram of electrical generation.
Drawings made for the electrical power field can be made either for the generator plant or for an individual commercial consumer. These drawings can be the most complex, because they include all types of drawings: schematics, mechanical, control, and logic, as well as some drawings that are unique to the power industry, such as the single-line drawing.
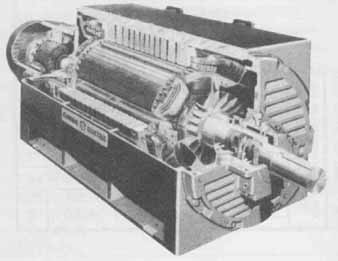
FIG. 2 Cutaway of a typical generator.
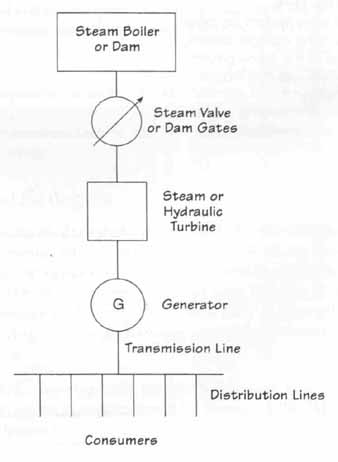
FIG. 3 Flow diagram of electric system.
JOB PREPARATION
The basic system, even though it is generally a three- phase system, is often represented by a single-line drawing, which shows the major equipment, interconnection, ratings. loads, and possibly instrumentation. Standard scale for electrical drawings is generally either 1/8 in. = 1.0 ft or 1/4 in. = 1.0 ft. The number of drawings required is determined by how large a system is represented and how large the area to be covered is. If a project is very large, it requires a number of drawings to cover individual details. A numbering scheme is used to tie these drawings together. and related diagrams are listed on each drawing, as shown in Figs. 4 and 5. The detail drawings required for a power substation include the following:
1. Plot plan
2. Single line
3. Substation
4. Underground conduits
5. Aboveground conduits
6. Equipment layout
7. Control and instrumentation
8. Area lighting
The list of drawings may not be limited to these items, and not all of these items are required for every project.
The first distribution system was direct current and low voltage and was installed underground. This system was pioneered by Thomas Edison. Widespread expansion of electrical systems did not occur until the adoption of alternating current and the application of transformers. Also, overhead construction and transmission can be a much more economical method of distributing electrical power. The first electric power station, Pearl Street Electric Station in New York City, went into operation in 1882, and the electric utility industry was born. Planning for power distribution must start at the customer level, considering demand, type, load factor, and other load characteristics. All these will determine the type of distribution system necessary.
There are two major categories of power lines: transmission and distribution. Transmission lines are the high voltage (115 to 800 kV) lines that connect the main substations to the generating plants. Distribution lines include medium-voltage (2.4 to 69 kV) lines used primarily to tie load centers to the main substations and low-voltage (< 600 V) lines leading directly to the consumers. Although these categories indicate a range of voltages, there are voltages preferred for most uses and recommended by ANSI or some of the other standards boards. Standardization also helps to reduce the cost of the distribution equipment. Industries do not have to produce equipment capable of supplying or operating at different voltage and frequency levels. Some typical voltages are shown in TABLE 1. Throughout the process of transmission and distribution, the voltage must be raised or lowered to meet the particular requirements. A transformer is shown in FIG. 6. This transformer will step up or step down the voltages from one level to another, which is one of the main purposes of the substation. Substations also contain circuit breakers, fuses, and lightning arrestors. These protective devices keep high levels of current from leaving the substation and endangering the consumer, but they also serve as protection for the equipment itself. Typical circuit breakers and lightning arrestors are shown in Figs. 7 and 8.
Conductors need support to get from one place to another. These supports may be towers, poles, or other structures. Usually, steel towers are used for transmission lines, and wood and concrete poles are used for distribution circuits. In general, steel towers are used where exceptional strength and reliability are required. Given proper care, a steel tower lasts indefinitely.
Types of Power Lines
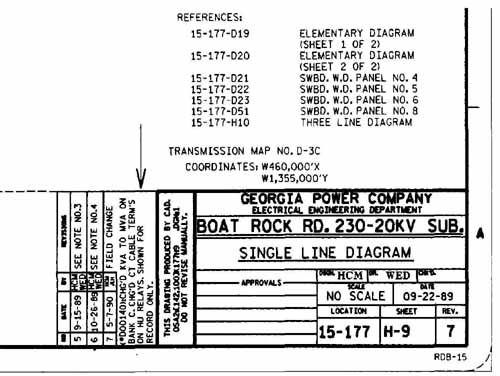
FIG. 4 Numbering system for cross referencing multiple drawings related
to the same project. (Courtesy Georgia Power Company)
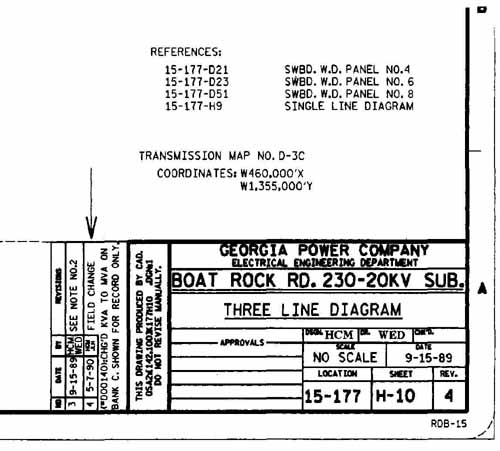
FIG. 5 Numbering system for cross referencing multiple drawings related
to the same project. (Courtesy Georgia Power Company)
TABLE 1 Typical Voltages for Power Distribution
Two factors are considered in choosing poles: length and strength required. The length depends on the required ground clearance and the number of crossarms or other equipment that will be attached to the poles.
Poles are generally between 25 and 90 ft high. Required pole strength is determined by the weight of the cross arms, insulators, wires, transformers, and other equipment, as well as by ice and wind loading.
Line conductors are insulated from each other, as well as from the pole, by insulators. The most practical of these are made from glass or porcelain. A pin insulator is mounted on a pin, which is installed on the cross-arm.
These insulators can weigh anywhere from to 90 lb.
The most commonly used insulators are the pin, or post, type and the suspension, or hanging, type. A third type is a strain insulator, which is a variation on the suspension type and is designed to sustain extraordinary pulls.
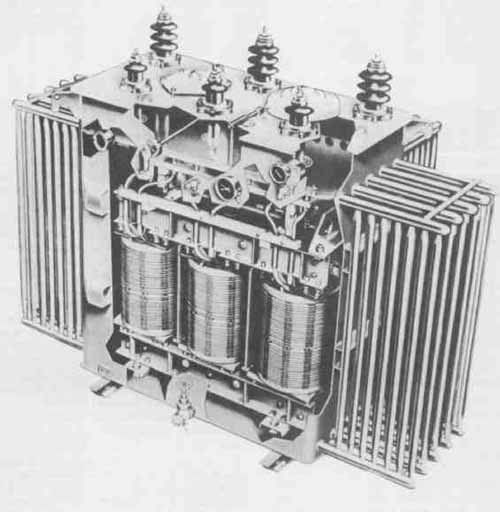
FIG. 6 Typical transformer. (Courtesy ABB Power T&D Company, Inc.)
These insulators are shown in FIG. 9. The main ad vantage of the pin type is that it is cheaper. The higher the voltages are, the more insulation that is needed. In such a case, the pin type becomes so large it is impractical, and suspension insulators are used.
Line conductors may vary in size according to the rated voltage. Copper, aluminum, and steel are the most-commonly used conductors. Of these three, copper is the best conductor. Aluminum is used because of its weight, and steel is used because of its strength. ACSR (aluminum conductor, steel reinforced) is used for long transmission spans. Copperweld or alumoweld, a clad steel combination, is used for rural distribution and for guy wires.
One-Line Diagram
Used most often in the power field, the one-line diagram represents all the major components of an electrical plant or system in one line. Generally, the system is a three-phase system, but only one line (or phase) is necessary to describe the system fully. As for all other drawings or sets of drawings, certain rules must be followed.
1. Drawings typically are vertical.
2. Highest voltages should be placed at the top of the drawing.
3. Adequate distance between components must be maintained for reference designations and other notes.
4. Standard recognized reference designations and abbreviations must be used.
Depending on the use of the diagram, additional information listing actual part numbers and descriptions may be included on the diagram, rather than on a separate bill of materials.
A checklist for the drafter in the power field should include the following:
1. Ratings of all devices, cables, and wires
2. Ratios of instrument transformers and phasor diagrams
3. Fuse and circuit-breaker ratings
4. Title of drawing and correct names of substations, buses. generators, and the like.
5. Neatness of drawing, spelling, and proper abbreviations
6. Minimum line crossings and space to avoid crowding
7. Lettering uniformity
8. Notes that are conclusive and readily understood
The use of a template is highly recommended for drawing these symbols. However, if a template is not avail able, each symbol can be completed using triangles, straightedge, and compass. FIG. 10 shows some typical construction characteristics that must be followed.
FIG. 7 Typical circuit breaker. (Courtesy Dennis Cherry/ Columbus Southern
Power Company)
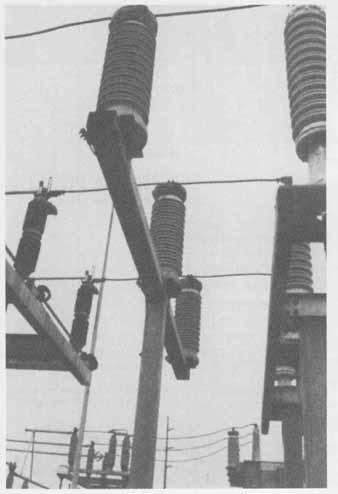
FIG. 8 Typical lightning arrestor. (Courtesy Dennis Cherry/ Columbus
Southern Power Company)
Preparing Single-Line Drawings
The power distribution field presents a whole new vocabulary, including switchgear, substation, voltage regulator, pothead, air break switch, circuit breaker, and lightning arrestor. All these devices are represented graphically in circuit diagrams. In addition to the single- line drawing, many other diagrams are found in the power distribution industry: three-line diagrams; logic diagrams; general-arrangement diagrams, showing physical arrangement of equipment; connection diagrams. showing physical connection of controls, meters, and so power distribution plans, showing the actual distribution and sometimes routing for service routings inside plants; and detail drawings.
Often standard detail drawings are produced and bound in sets of standards for an individual power company ( FIG. 11 and FIG. 12). Once these detail drawings are made, they can be included by simply adding a copy of the standard to a project, rather than redrawing it each time it is needed.
Control circuits are also found in the electrical distribution field. Generating stations may have control circuits for water pumps or other applications. Since these were covered in detail in Section 14, they are not included in this Section.
FIG. 9 Insulators: (A) pin-type; (B) stand-off; (C) strain. (Courtesy Dennis Cherry/ Columbus Southern Power Company)
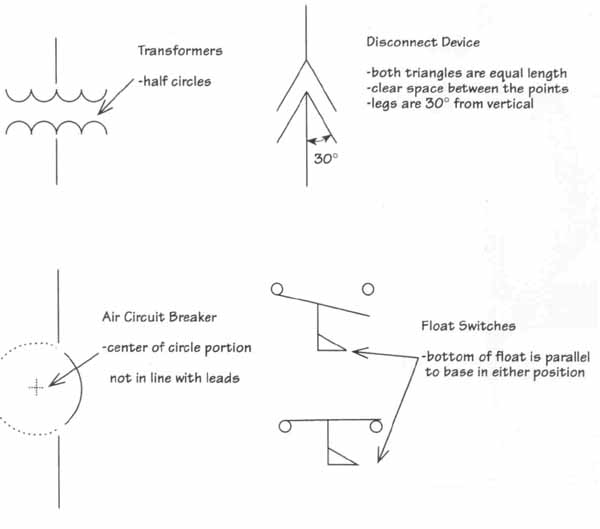
FIG. 10 Typical construction characteristics.
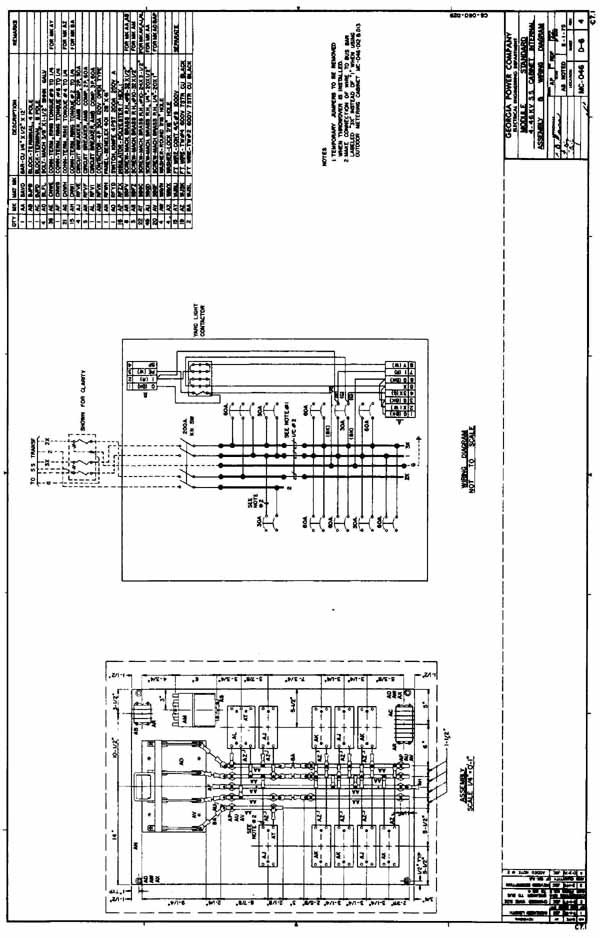
FIG. 11
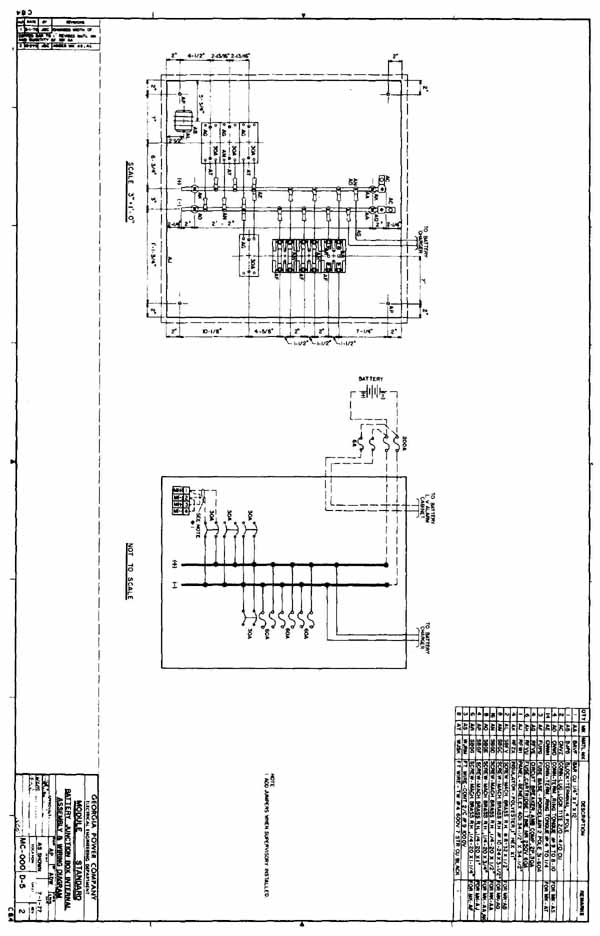
FIG. 12
In a large company, a drafter may get the information or a single-line drawing in the form of a rough sketch from a development or project engineer. The finished drawing is produced by taking all the information from that sketch and laying it out following company policies. It is important for the drafter to check the specifications of all equipment and cabling: cable characteristics and ratings of power transformers, circuit breakers, fuses, connected loads. meters, and other miscellaneous devices such as lightning arrestors or other protective devices. This information must be included on the final drawing if the drawing is to represent the system and fully describe all its components.
Reference designations for the power industry are published by standards boards, as are the symbols used in previous Sections.
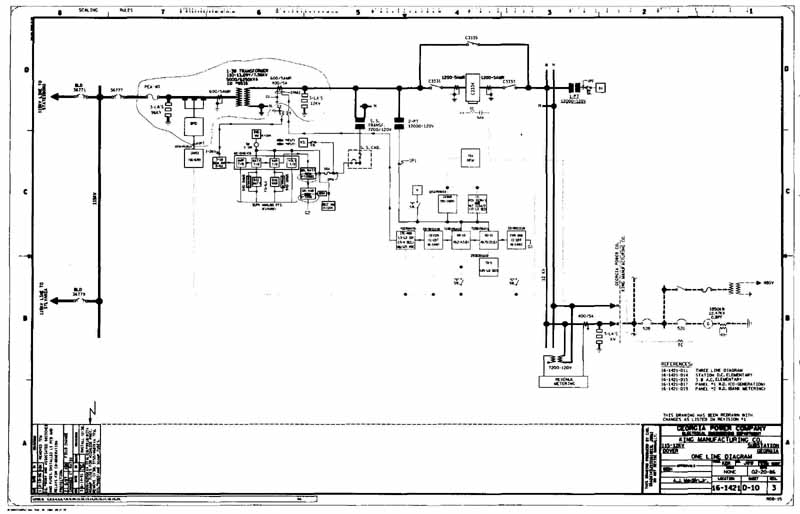
Unless the company dictates otherwise, it is always good and acceptable practice to use these approved symbols and designators. A typical one-line diagram is shown in FIG. 13.
As with all other diagrams. a primary consideration is that the drawing be concise, simple, and easy to under stand. To achieve these goals, the drawing should not be cluttered, and there should be adequate room between all components for notes and reference designations. Crossovers should be kept to a minimum. This can sometimes be done by simply relocating an item on the drawing, as physical relationships are not critical and are demonstrated on other drawings.
For the many drawings used to represent power distribution areas, it is important that the data presented not be duplicated and used in more than one place.
When future revisions are necessary. it would be difficult for the person doing the revision to track down all references to these data and ensure that they are all changed.
Even if the same person is doing the revisions, it may be impossible to remember that the same information is found on multiple drawings. Often notes can be used to identify devices standard to the industry, stating that all devices used are the same size, rating, and so on, unless otherwise noted. It is important to include all known data as well as projected future elements. Some times future items can have a bearing on the size of cables or the current rating of devices used in the initial installations. These future items should be drawn with dotted lines and identified as planned and used in calculations but as a future item. See FIG. 14.
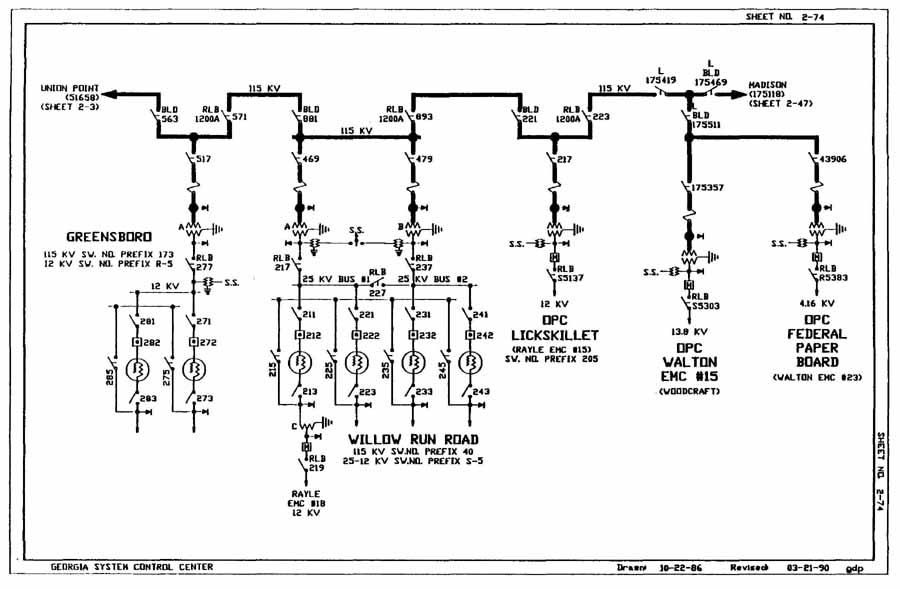
FIG. 13 A typical one-line drawing. (Courtesy Georgia Power Company)
FIG. 14 Future items are indicated with dotted lines.
For large customers of a utility company, high voltages may be provided directly to the installation. These customers then have their own switchgear, which functions in exactly the same way as a utility company substation. Remember, the primary function of a substation is to take the feeder lines and step down and distribute power at lower voltage levels. A pothead may be used to terminate the cable and allow it to be connected to the switchgear. A pothead is used to connect an underground cable and an overhead wire. It can be a single or multiple conductor. FIG. 15 shows a cross section of a three-conductor pothead. In this pothead, three separate cables come in and are wrapped into one cable. The three conductors pass individual porcelain encased terminals. These terminals look very similar to insulators and perform the same function. The cable is attached to the pothead by a wiped joint or a clamping device. Often the pothead is filled with a liquid insulating compound. This must be cooled before the pothead can be connected to the overhead wires.
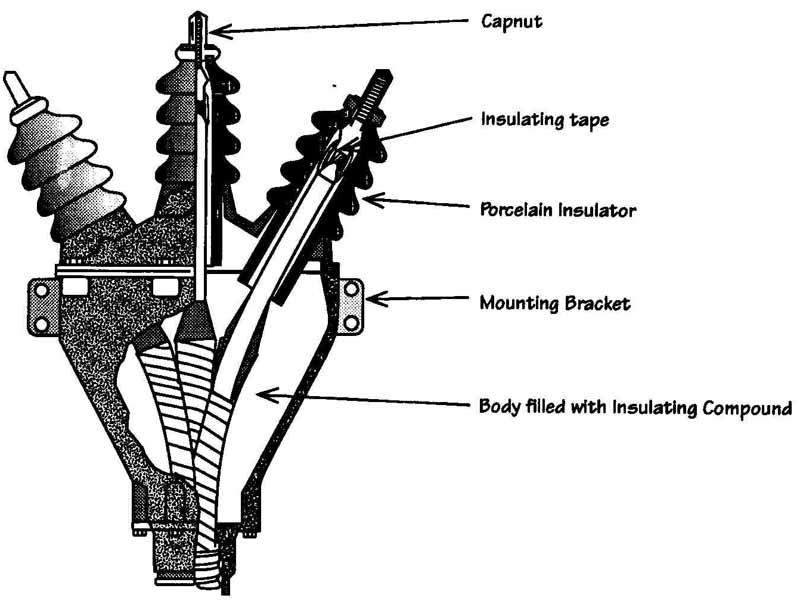
FIG. 15 Cross section of a three conductor pothead.
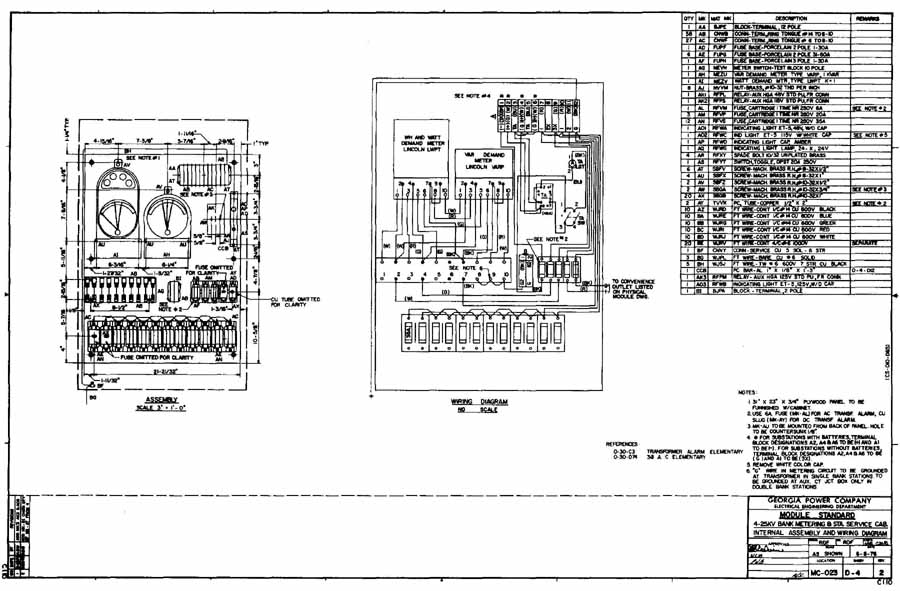
FIG. 16 Meter mounted in door of switchgear. (Courtesy of Georgia Power
Company)
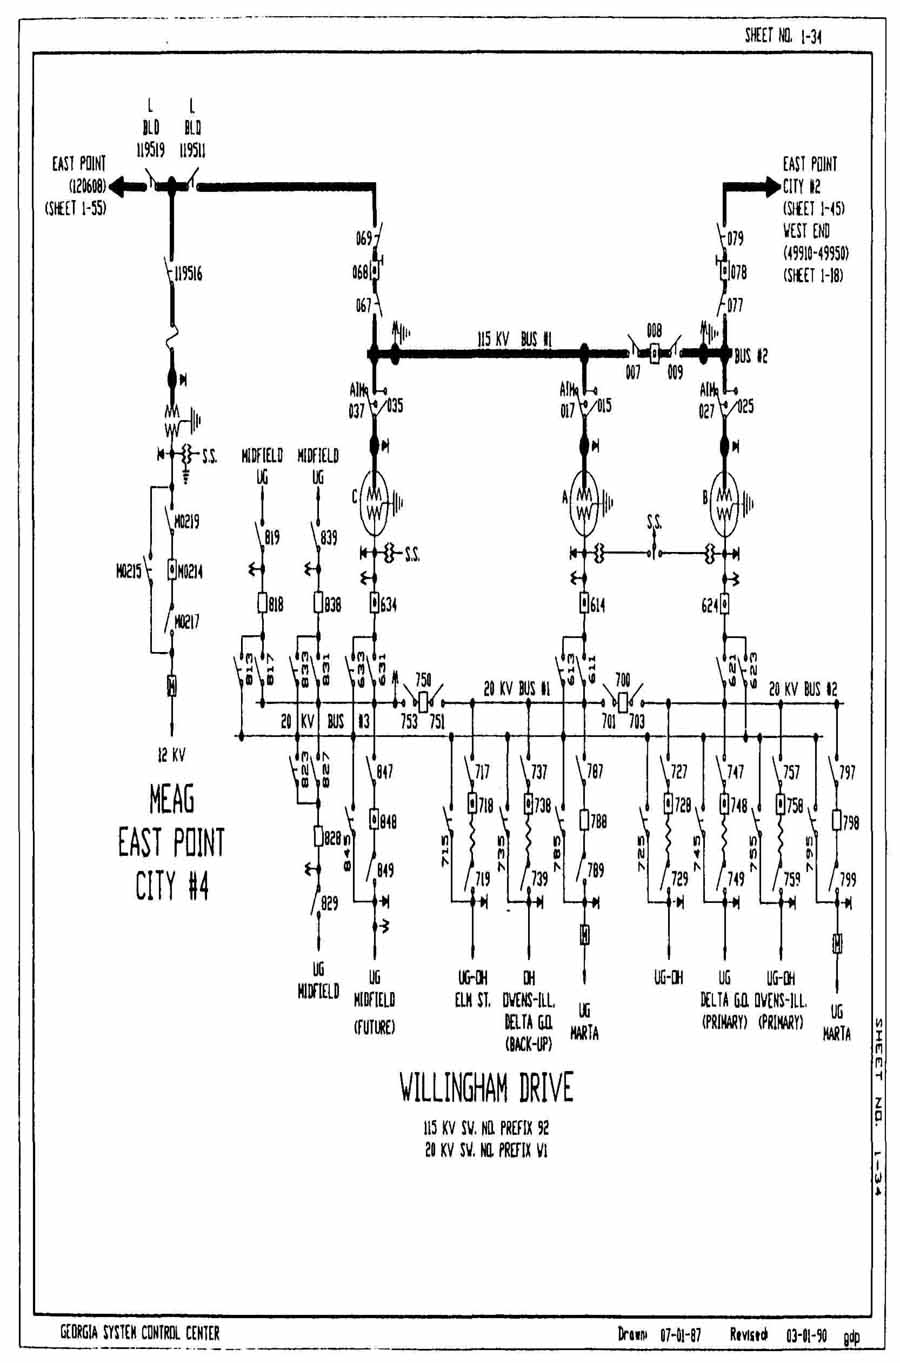
FIG. 17
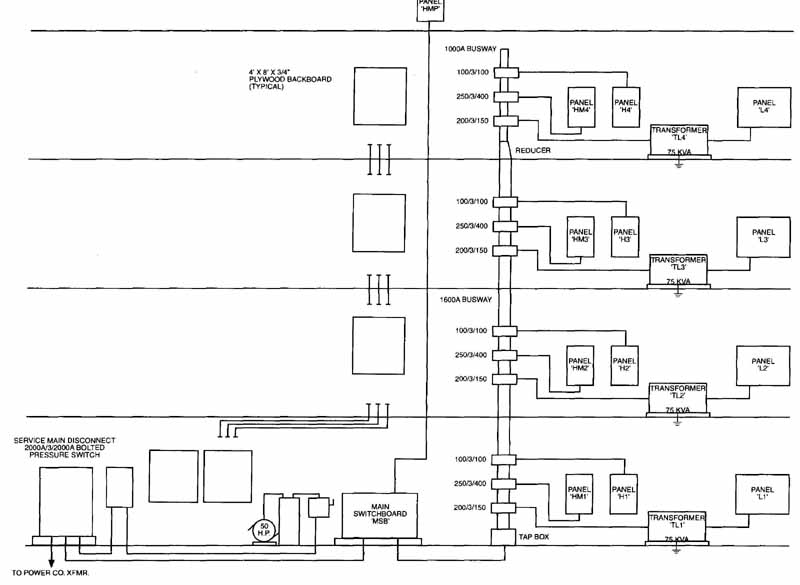
FIG. 18 Riser diagram for multiple-story building.
Relays and meters are required for monitoring purposes in the switching equipment. Often these are mounted directly in the doors of the switchgear itself, as shown in FIG. 16. The meters provide billing information and may be typical kilowatt-hour meters. In addition to use, peak demand may be monitored in order to determine if additional billing is necessary.
Cables running from the main or service entrance switchgear of the customer installation distribute the power to various load zones or unit substations. Often load zones are fed by two feeder lines. A typical customer distribution is shown in FIG. 17. This distribution provides maximum service in case of power failures.
Unit substations are custom made for every installation.
Although this may seem cost prohibitive, in reality, individual elements are standard. They include fuse sections, transformers, breakers, relays, meters. and switches. Installations for all customer-site unit substations are covered in the National Electrical Code. Unit substations may have very limited metering, used only to monitor the operation of the unit. Feeders from this unit provide power for the customer site. Feeder size is determined by present load, predicted future load, cost, length of feeder, and short-circuit requirements. The feeders generally go to the panelboard, which is used to actually divide the feeder into individual circuits, such as lighting. Although riser diagrams are used most often in plumbing or heating and air conditioning, they may be included in the electrical area. FIG. 18 shows electrical service in a multistory building. Riser diagrams typically show the equipment located in the building and how it is connected. They present a picture of how this equipment is wired and are often thought of as interconnection diagrams.
One-line diagrams are not restricted to power distribution. They can be used any time a simplified representation of a larger or more complex system is required.
Typically, much of the detailed information is left out, and the circuit function is represented, rather than the individual components. The diagram is completed using thick dark lines for the main connection lines and medium lines to connect to instruments or potential and current sources. Only major equipment is typically rep resented. Ratings of major components are included only if they are essential to the understanding of the operation. Detailed ratings are included in a connection diagram or a schematic. The rating of a main generator may be included. It is much more complicated to under stand simple circuit functions using the complete, or three-line, drawing.
Typical transformer connections can be made either in a delta or a wye connection. Typically, the high side of the transformer is wired using wye connections, but the low-voltage side is delta connected. These winding connections should be indicated on the drawing, as shown in FIG. 19. The transformer was introduced in Section 14.
FIG. 19 Winding connections indicated on drawings. (Courtesy Georgia
Power Company)
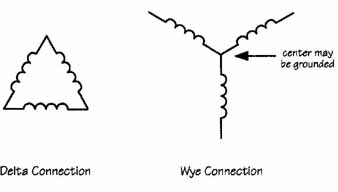
FIG. 20 Physical connection shows actual windings. Delta Connection;
Wye Connection
The wye connection often includes a neutral or ground wire connected to the center point. The physical representation is shown in FIG. 20. Also shown are the neutral, or ground, connections for the transformer.
Instruments and meters are also included in the drawing.
These are generally represented by a small circle and a device function designation.
The primary guide in this drawing, as in all others, is clarity. The diagram must clearly represent the circuit operation and functions. The symbols should conform first to company standards; if there are none, the guide lines in ANSI or other national standards sources should be followed.
All lines should be either horizontal or vertical, with as few crossovers as possible. There should be adequate spacing between any pairs or sets of wires. Also, line spacing must be adequate even after the maximum reductions have been made to the drawing.
The one-line diagram in FIG. 21 is a good example of circuit functions contained in this type of diagram.
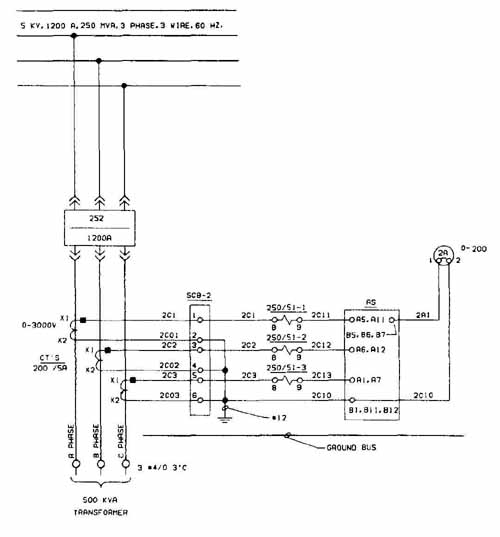
FIG. 21 One-line diagram showing circuit functions. (Courtesy of Interactive
Computer Systems, Inc.)
FIG. 22 Use of rectangle or unique symbol for circuit breaker.
The short horizontal lines are connected to the main lines by way of current transformers and are used to provide power for such additional functions as protection and metering. Starting at the top of the diagram, the main power is represented as 5 kV, 1200 A, three phase, 60 Hz. A disconnect device is the first device that should be encountered. This circuit does not include one, but a high-voltage disconnect should be located between the high-voltage supply and the main trans former. This is represented by either a square with main circuit breaker noted or the unique symbol shown in FIG. 22. Typically, one-line diagrams include a trans former to bring the high voltage down from the main power source to a standard distribution voltage. Current transformers are connected at this point to provide power for the metering circuits. Meters connected to this current transformer should be protected with a fuse, and the meter itself must include an indication of the type of meter and the range. In this example, the meter is an ammeter, so a circle is used to indicate a meter, and an A is included in the circle to indicate an ammeter.
The horizontal line from the current transformers provides an auxiliary function to the main line.
Three-Line Drawings
Although one might think of the three-line drawing as an expansion of a single-line drawing, in reality it is a supplemental drawing. The single-line drawing is used to represent the function and operation of the entire circuit; the three-line drawing, on the other hand, places most of its emphasis on metering and relaying circuits. The three-line drawing has also been called a schematic diagram for the power plant. In addition, it usually includes information about connections and interconnections between devices.
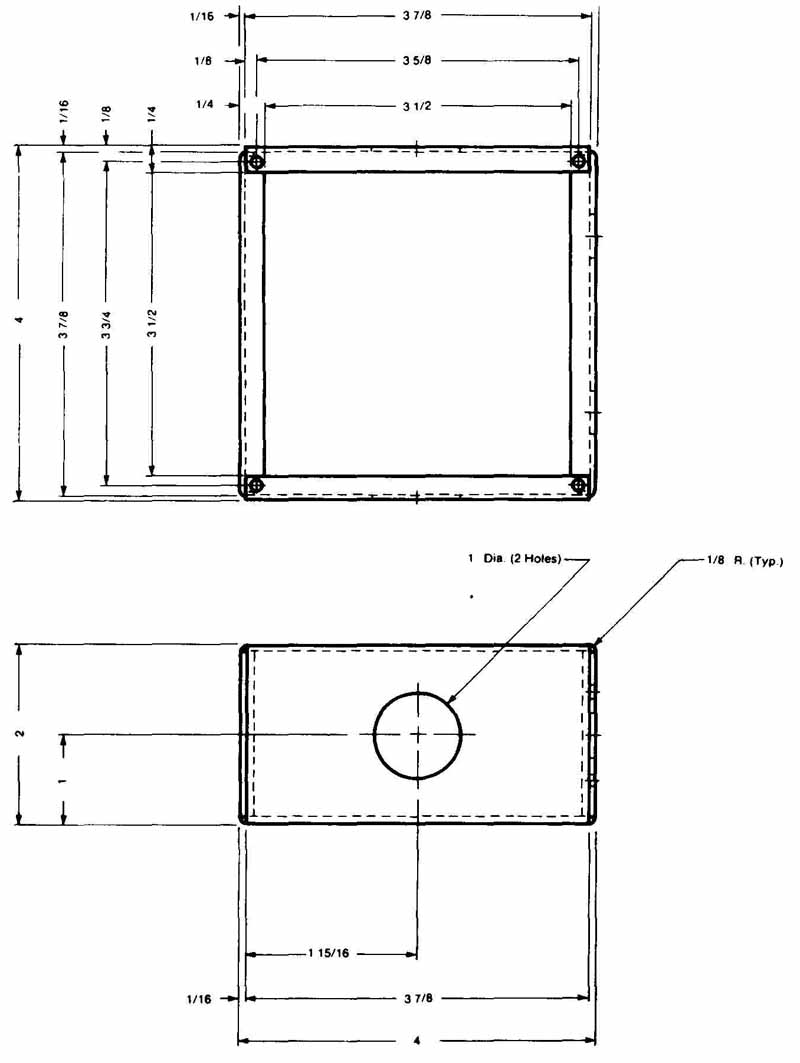
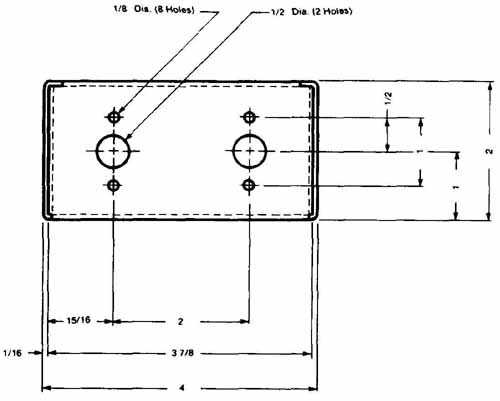
FIG. 23 Current transformer represented by a rectangle showing all terminal
connections and wiring numbers.
Three-line diagrams are presented in the same manner as one-line diagrams. The primary or power conductors are typically found across the top or along the left side of the drawing, with the primary or source voltage being in the upper left-hand corner. The "flow" of electricity follows the normal reading flow, because this is intuitively easier to grasp.
The ratings for devices are shown following pre scribed drafting methods. Placement of the ratings, device designations and other notes should be consistent throughout the drawing. As in earlier Sections, these designations should not be split; if possible, they should be located to the right or below the component. The primary, or power conductor, lines should be thick dark lines, whereas all those used for meters or control circuits should be medium-weight, thinner lines.
Device terminal numbers and wire numbers are shown on this diagram for use in demonstrating inter connections and the physical relationship between the devices. It is important to be very consistent in the numbering scheme used to represent the wires and the terminals so that they are very clear and concise. For example, FIG. 23 shows a current transformer. The small numbers 1 to 8, which are shown close to the rectangle used to represent the secondary side of a transformer, are, in fact, the terminals of this transformer. These numbers are located very close to the rectangle and below the wire. The numbers located on top of the lines and away from the rectangle are the wiring numbers.
Three-line drawings may not contain all the detail and device ratings found on a single-line drawing, but there will be meters and other devices that cannot be represented on any other drawings. It is necessary to follow good practices in spacing, layout, and accuracy. When drawings are prepared as D or E size drawings, you must keep in mind that the drawings may need to be reduced. In the reduction process, not only are the devices reduced, but so are line-weights, text size, and even the space between lines and devices. Therefore, you must consider the maximum reduction when laying out such a drawing.
Logic Diagrams
The generation of electrical power requires the use of many control circuits. These circuits can be analyzed and prepared in exactly the same way as those shown in Section 15 using contacts and relays. Logic symbols can also be used to represent these circuit functions. The logic symbols shown in Section 15 are often reserved for use in digital logic circuits. Although they do represent the operational function, their use is often associated with low-voltage DC logic applications. A different set of symbols representing these same functions can be found in the electric power industry. The primary requirement in the use of any symbol is clarity in representation and consistency. FIG. 24 shows typical symbols used to represent logic functions.
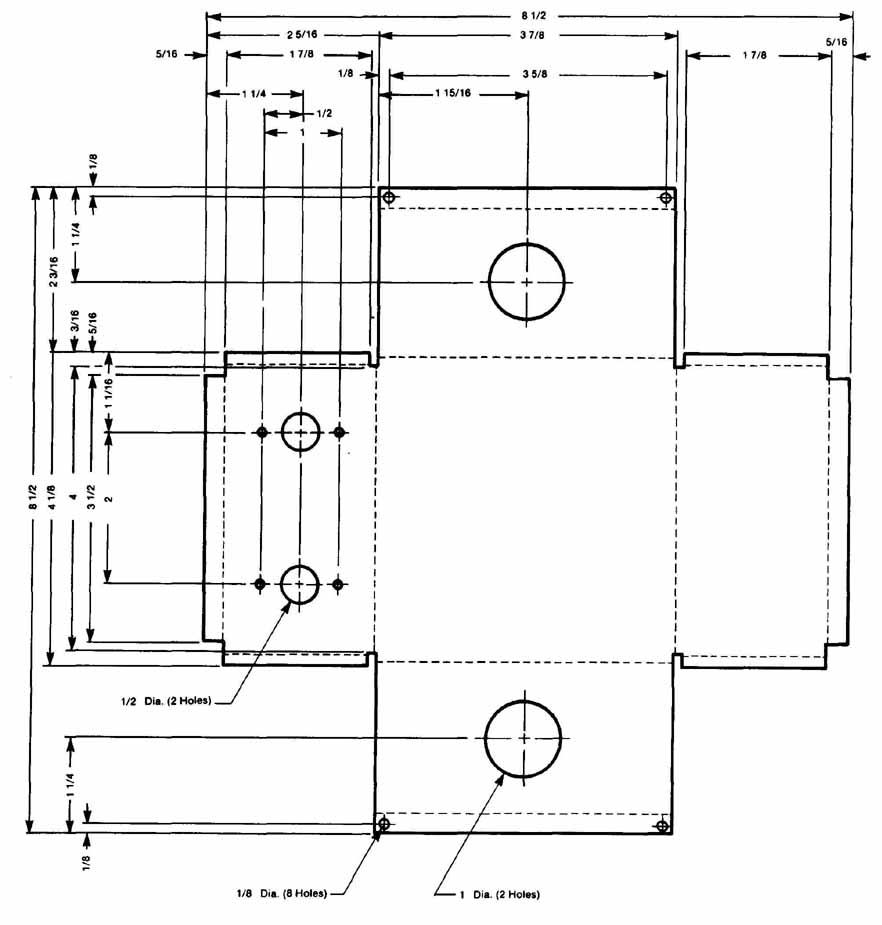
FIG. 24 NEMA symbols used to represent logic functions in power applications.
Keep in mind that symbols represent the function of a circuit. They are not actual devices. They represent contacts and relays that occur in the actual physical application. By using a combination of a logic diagram to quickly and simply represent the functions and a connection or interconnection diagram to demonstrate the actual devices used, a complete picture can be presented. When representing control circuits, remember that all devices are shown in their de-energized or deactivated stages. If a float switch is used to activate a sump pump, it is represented in the at-rest state. It could be a normally open or a normally closed switch, depending on the design of the circuit, so it is impossible to simply say that all switches should be shown as open.
In addition to the logic and the interconnection diagrams, a schematic representation of the circuit may be used. By actually representing the contacts, switches, and relays used, ratings and specifications for these devices may be added to the diagram. Since the logic diagram is only a representation of circuit function and not circuit components, it is impossible to note device ratings and specifications on the logic diagram.
General Arrangement
The general arrangement of all equipment in a power- generating plant or a utility substation is an essential part of a complete set of drawings. Such a drawing is similar to an interconnection diagram in that it demonstrates the physical relationship between different pieces of equipment. This drawing—or, in some cases, set of drawings—identifies the location of switchgear, transformers, meters, disconnect switches, lightning arrestors, and so on. However, this diagram does not show the actual wiring. Often the general-arrangement diagram appears to be a mechanical drawing representing “packaging,” since the enclosures for many of the devices are represented. This drawing demonstrates the total size, shape, and space required. So a set of drawings may include an elevation diagram, details, sections, or a number of other drawings. FIG. 25 shows a general arrangement drawing.
Wiring Diagrams
Connection and interconnection diagrams are a critical part of installation diagrams. The connection diagram is used to represent the connections within a piece of equipment and is often used to show wiring for meters or auxiliary devices (Figs. 26 and 27). It may or may not show the main or power circuits but most often does not. The interconnection diagram, on the other hand, shows wiring external to an individual piece of equipment. This drawing is used to demonstrate the wiring required between major units, subassemblies, equipment, and the like. The types of diagrams used are the diagrammatic and the tabular types. Diagrammatic diagrams include continuous-line (point-to-point or highway) and interrupted-line types. These diagrams are covered in detail in Section 13. Refer to that Section as you complete the exercises. In the preparation of these diagrams, the following practices should be followed.
The use of squares, rectangles, or circles is permissible to represent the individual items. The view should be completed as though all devices and connections are in one plane. The arrangement of the items must provide utmost clarity and interconnection information. Re member, this diagram is a representation of the physical relationship between items and not necessarily the physical location. Relative location of all terminal boards, connectors, and so on, must be clear. Often a diagram showing the physical location is included in a set of drawings. Connecting lines must be spaced so that at the maximum reduction the space will be no less than .06 in. Longer parallel lines should be grouped, and routing should follow the most direct and logical path.
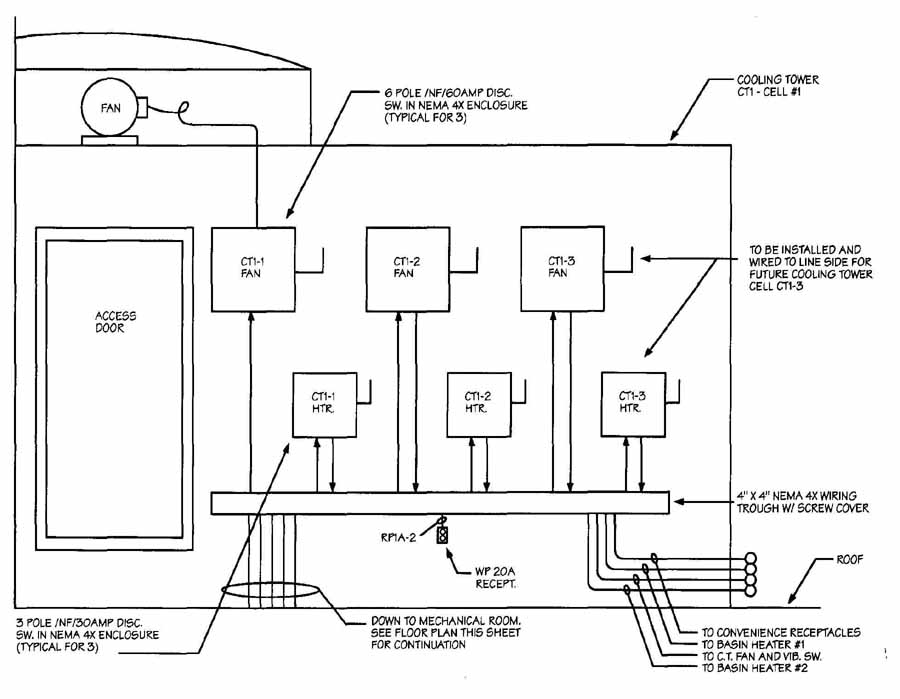
FIG. 25 Typical section drawing showing general arrangement of equipment.
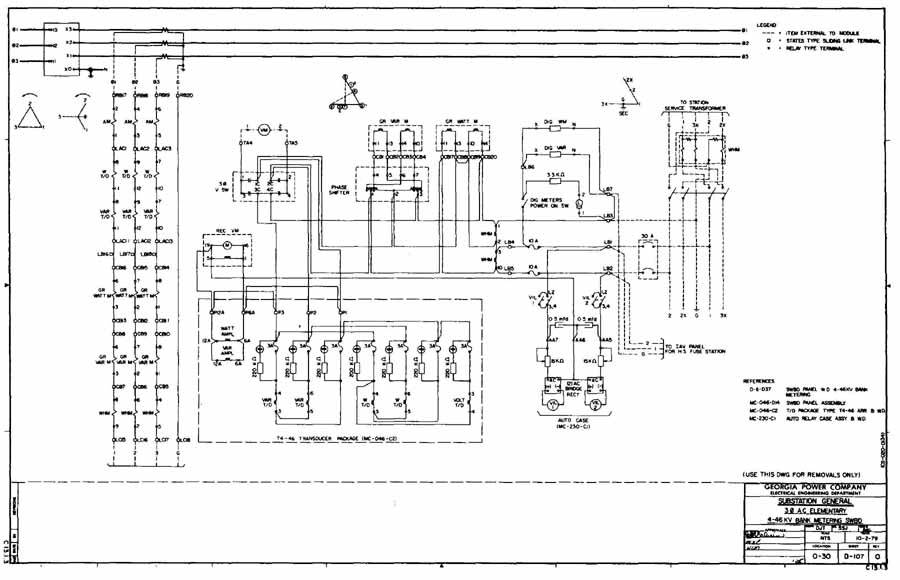
FIG. 26 Detail point-to-point connection diagram. (Courtesy Georgia
Power Company)
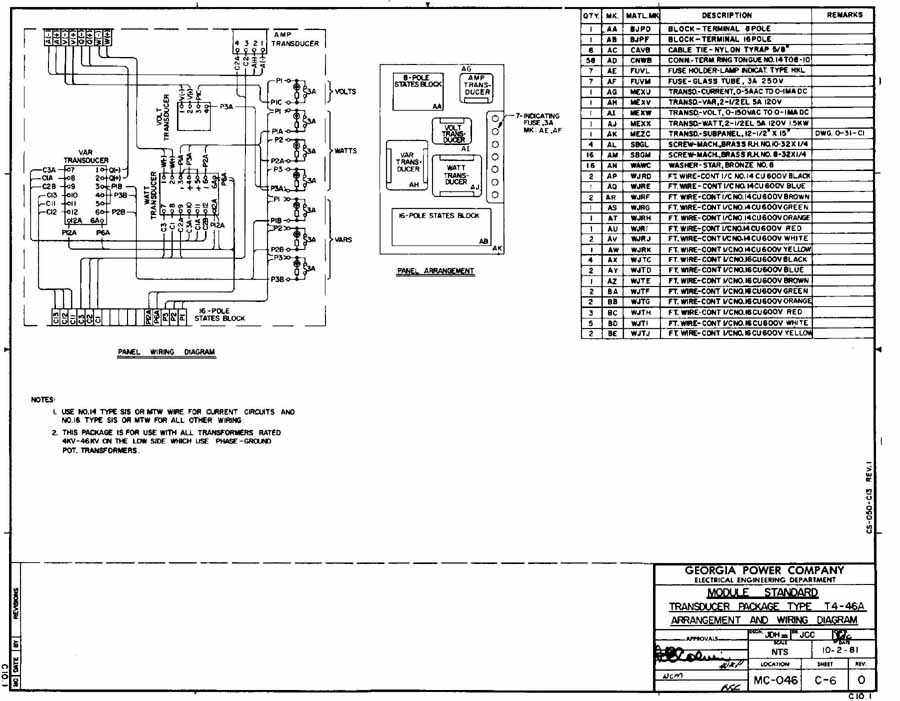
FIG. 27 Detail highway connection diagram. (Georgia Power
company)
A code may be used in the identification of each wire run. This code may be anything from a simple number to any combination of letters and numbers. FIG. 28 shows how numbers may be used in an interconnection diagram from the motor-control center to various devices.
It is very important in a connection diagram representing the physical location of cabling and wiring in an individual piece of equipment to actually demonstrate wiring routing.
Power Distribution Plans
Power distribution plans are required to show the actual power distribution in a building or manufacturing plant. A distribution plan includes all electrical service from the incoming line to the building, to the distribution center, and through all the service panels in the structure. The first consideration, then, is the incoming line. If this line is underground service, it requires only a notation showing the service as it enters the distribution center. If these lines are overhead, then there must be some detail showing the poles and the connections to the utility company service from the customer’s point of view. These service feeds should never be routed over buildings, as they would interfere with building maintenance, security, and emergency functions.
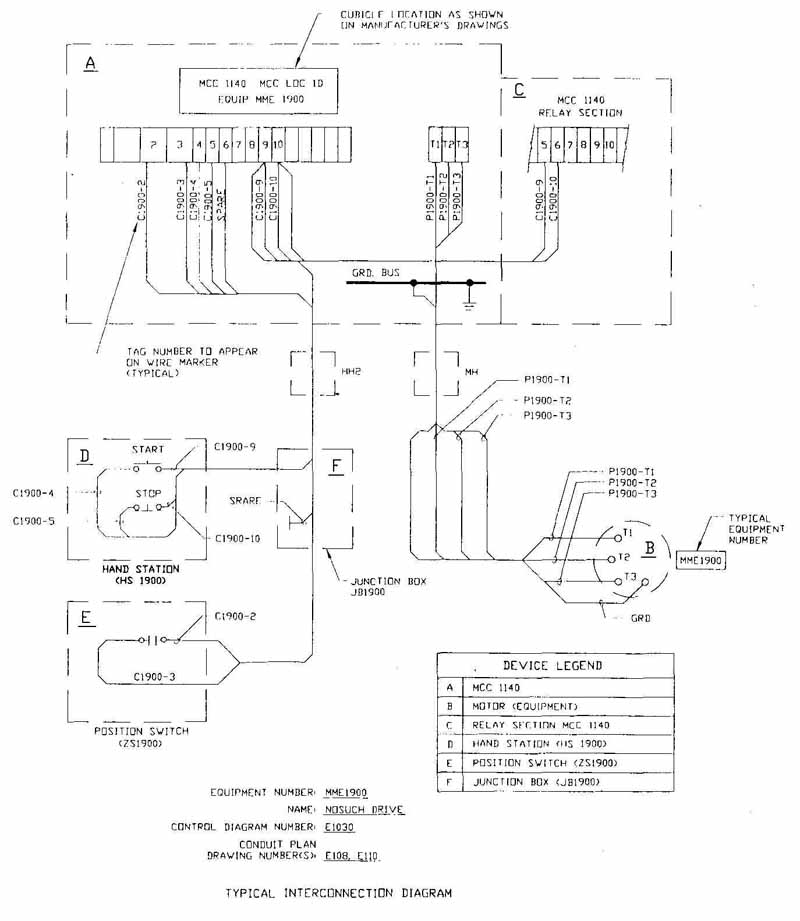
FIG. 28 Wire numbering codes in interconnection diagram for switchgear.
(Courtesy of Brown and Caldwell Consultants)
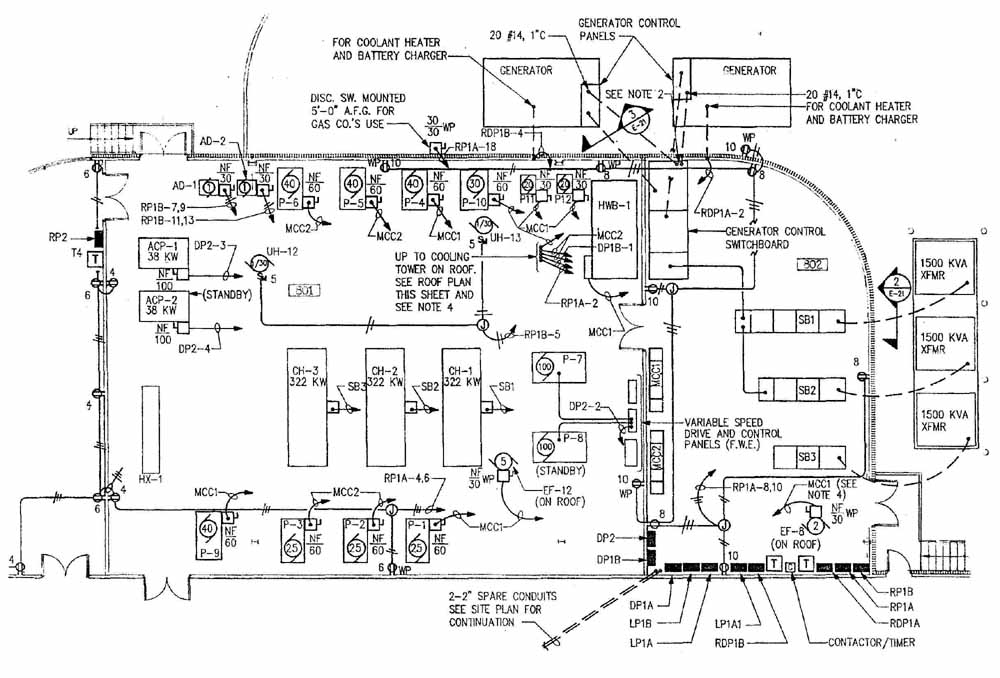
FIG. 29 Floor plan of a distribution center.
As the distribution plans are developed, certain items need to be included: special load requirements such as machines and computers, size of motors, various voltage-level requirements, peak demand, and any other special requirements. The other area to consider is where the service will be located, what the space requirements are for meters, and what future changes are anticipated in either the service or the load requirements. Typically, in the past most office buildings were supplied with the well-known 208/120-V system. Today, however, it is more common to find a 480/277-V, three- phase, four-wire grounded wye being used to supply manufacturing customers as well as office parks. The load requirements will determine the service required. In the preparation of these details it is critical to note which areas of the drawing will be completed by the service utility provider.
Load Centers
The load or distribution center of a building can be located either inside or outside the building. The determining factor is the voltage level present. For example, if the primary side of the incoming service is 15 kV or less, the center could be enclosed in a structure. This distribution center is often called a substation because of the function of the distribution center. The voltage is stepped down and the power is distributed to individual points within the building. The floor plan of the distribution center ( FIG. 29) should be drawn to proper scale. This is one way to ensure that all equipment will fit in the desired structure with the appropriate clearances.
A schematic diagram should be completed for the distribution plan. This will demonstrate the flow from the transformer through the building. Often a backup system is included as part of the original design. Using two transformers, the incoming service is split. If there is a loss of power in either cable, the system is designed so that one transformer and feed will supply the total load requirement. Grounding is essential in this substation, and all the switchgear, enclosures, and gates are grounded. Specification data for the various components are often listed on separate specifications pages, as data inclusion on the schematic would cause clutter and confusion.
Another drawing used in power distribution is the riser diagram. This diagram, as seen in FIG. 18, represents the electrical service lines throughout the building. Conceptually, it is similar to an interconnection diagram showing physical relationship, path of wires, and location of lighting panels. The riser diagram is generally limited to representing the wiring from the supply power to a panel box and does not include all the wiring for lighting, outlets, and the like. This information is found in architectural drawings. The emphasis for riser diagrams is on the distribution path. It has been suggested that the diagram is called a riser diagram because it shows the electric service rising through a building.
Detail Drawings
Certain installations, connections, or raceways are not covered in any other drawing. These detail drawings are added to complete the set of drawings for power distribution. The drawings may be part of a set of standards. For example, all raceways or wire channels are the same. This detail is drawn once and included in the set of standards to be used when necessary. A special drawing is required for a one-of-a-kind installation or connection. All utility companies have multiple volumes of standards. Often they are reduced and compiled in a loose-leaf binder. This allows easy updating should any standards be revised. FIG. 30 shows a typical “standard” detail included in a set of standards.
SUMMARY
Each utility company substation or large commercial installation requires the preparation of a great number of drawings. Specifications for these drawings must also be done to cover installations, rating, devices, loads, and so on. Some of the specifications may include requests for bids on contracted work, installations, equipment and materials, legal requirements, and standards to be maintained. Drawings for the power industry require all portions of electrical drafting covered in previous Sections: symbols, reference designations, control circuits, schematics, logic diagrams, and wiring diagrams, as well as mechanical drawings for layout plans or enclosures.
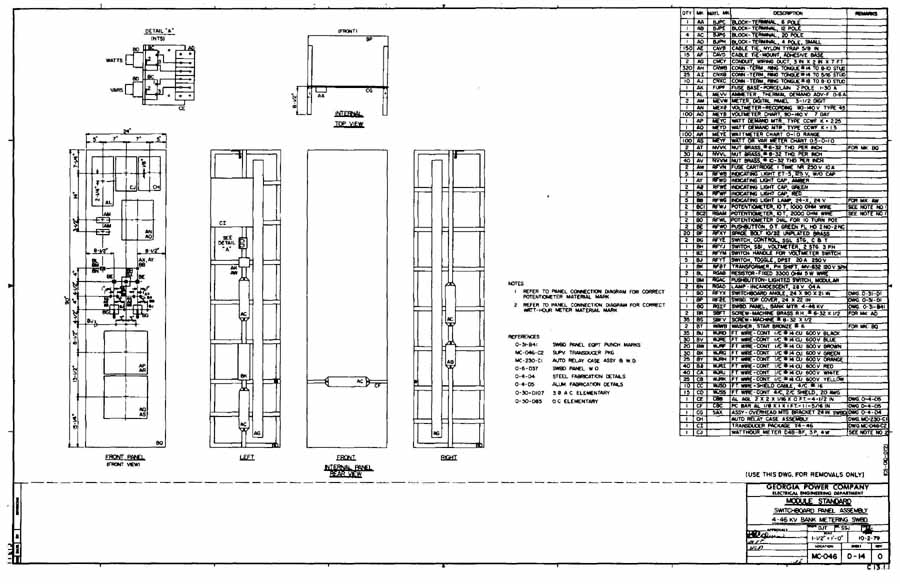
FIG. 30 Detail drawing from company standards. (Courtesy Georgia Power
Company)
Many changes will be seen in drawings for the power industry. More logic diagrams representing circuit functions will be used rather than single-line or schematic diagrams for control circuits. Operational representations will become more common and individual details will be covered in small detail drawings. Complete wire routing for equipment is being replaced by less cluttered terminal and wire numbers. Very little work is done manually in the power field. This is certainly advantageous for revisions and neatness. The line-weights are controlled and the notes and references are all lettered consistently, clearly, and neatly. The use of computer generated drawings produces good-quality drawings. However, unless good drafting practices are known and used, the computer can also be used to generate very poorly laid out and cluttered drawings that are printed in a very high quality fashion. The computer is not a replacement for knowledge of good drafting practices; it is simply a replacement for the use of a straightedge, angle, and drafting pen.
One trend that may affect the need for a great number of drawings, however, is the use of computers to control the power-generating facilities. As a facility becomes more computerized, the number of complicated drawings required could be reduced.
REVIEW QUESTIONS
1 What three things are required for a power distribution system?
2 What is the primary source of energy used in the production of electricity?
3 What is the main function of a transformer?
4 Why are the drawings for the electrical power field considered to be complex?
5 What are the two major categories of power lines?
6 What is the main purpose of a substation?
7 What two factors must be considered when choosing support poles?
8 What is the main advantage of a pin-type insulator?
9 Define the following terms: switchgear, pothead, circuit breaker, and lightning arrestor.
10 What is the advantage of bound sets of standards in a company?
11 What is the primary function of a substation?
12 What is a riser diagram?
13 What is the primary emphasis of a three-line drawing?
14 Why is a different set of logic symbols often used in power applications?
PROBLEMS
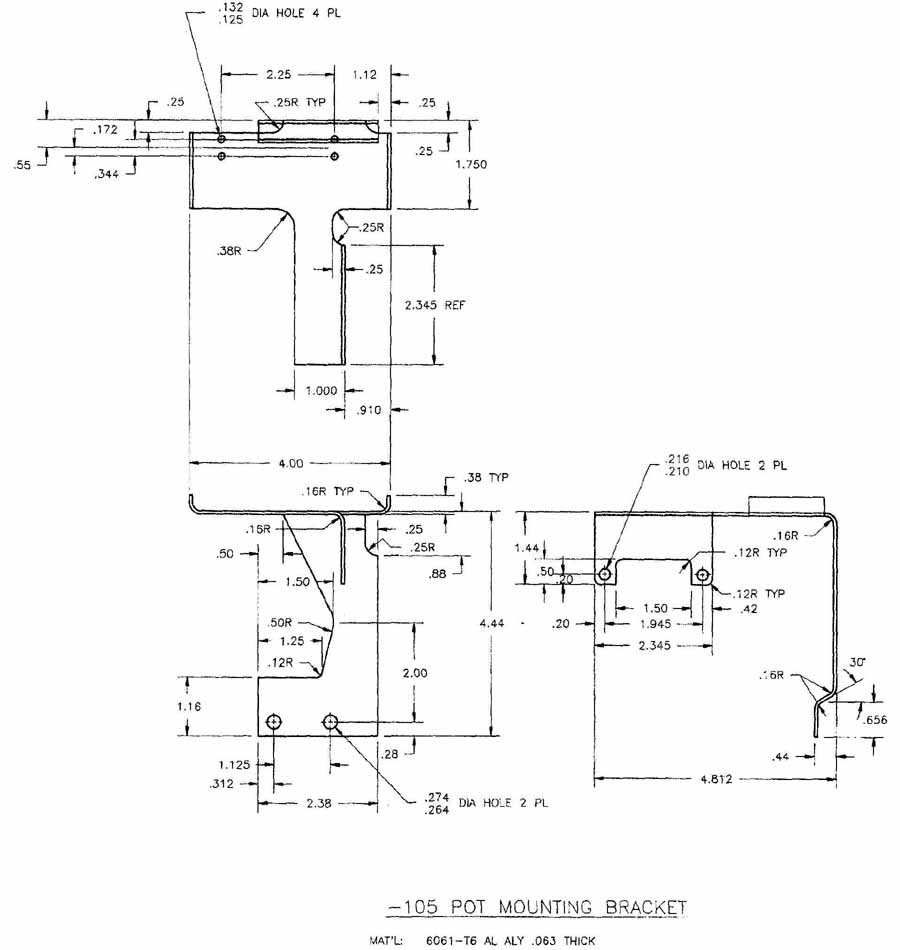
1. On a size A sheet, make an assembly drawing of the panelboard and transformer shown.
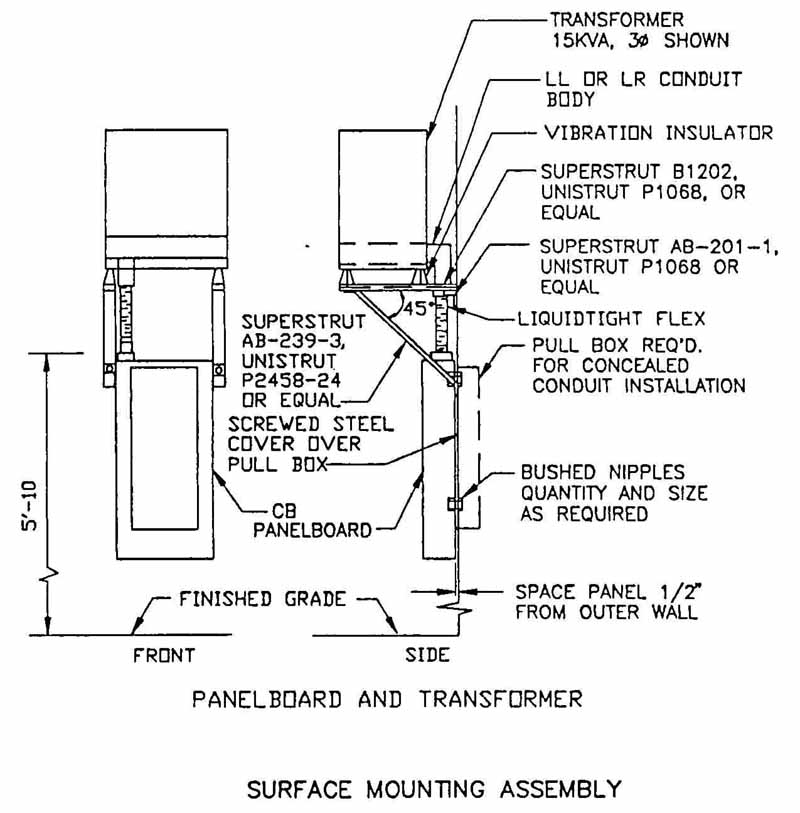
PROBLEM 1 Panelboard and transformer surface mounting assembly. (Courtesy
of Brown and Caldwell Consultants)
2. On a size B sheet, redraw the elevation and plan for the floodlight detail shown.
PROBLEM 2 Elevation and plan of floodlight. (Courtesy of Brown and
Caldwell Consultants)
3. An elevation for a motor control center is shown. Draw this elevation on a size C sheet.
PROBLEM 3 Elevation of motor control center. (Courtesy of Brown and
Caldwell Consultants)
4. Practice drawing the symbols for transformers, circuit breakers, fuses, disconnects, and other symbols encountered in this Section.
5. On a size B sheet, draw the internal assembly and wiring diagram shown in FIG. 11.
6. On a size B sheet, draw the single-line distribution drawing shown in FIG. 13.
7. On a size C sheet, draw the partial circuit shown in FIG. 19 representing the transformers and wiring connections.
8. Practice drawing the logic symbols used in power applications, as shown in FIG. 24.
9. On a size C sheet, draw the section drawing found in FIG. 25.
10. On a size B sheet, draw the wiring diagram shown in FIG. 26.
11. On a size B sheet, draw the wiring diagram and notes shown in FIG. 27.
12. On a size B sheet, draw the detail drawing shown, which illustrates the location of a motor feed line.
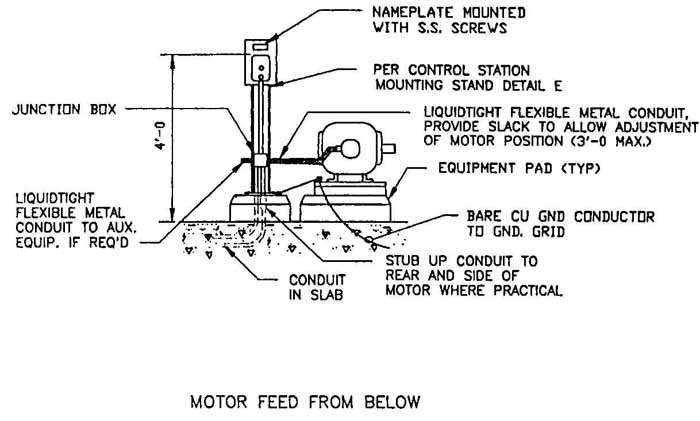
PROBLEM 12
13. (Advanced Problem) On a size C sheet, draw the interconnection diagram shown in FIG. 28.
14. (Advanced Problem) On a size C sheet, draw the distribution floor plan shown in FIG. 29.
15. (Advanced Problem) On a size E sheet, draw the single-line diagram, the MCC elevation, and the MCC schedule shown.
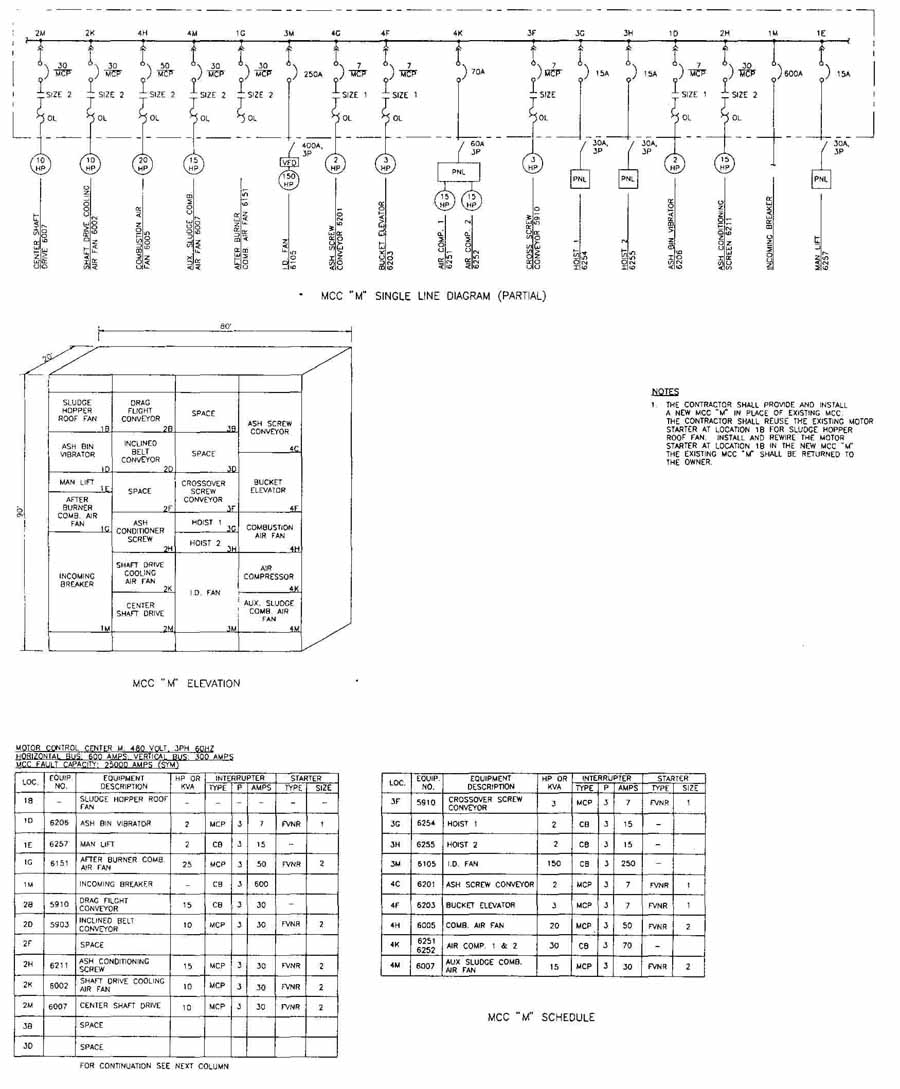
PROBLEM 15 Single-line diagram, motor-control center elevation, and
motor-control center schedule. (Courtesy of Brown and Caldwell Consultants)
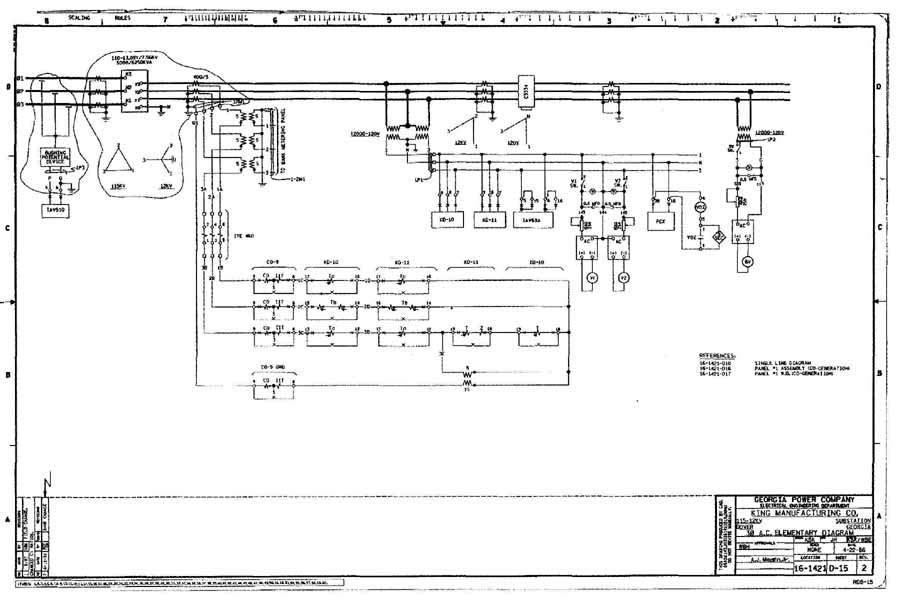
PROBLEM 16 Three-phase AC elementary diagram. (Georgia Power Co.)
PROBLEM 17 Single-line diagram.(Georgia Power Co.)
18. (Advanced Problem) On a size E sheet, draw the three-line diagram shown.