AMAZON multi-meters discounts AMAZON oscilloscope discounts
1 Types of Electric Power Generation
An electric power generating station is shown in FIG. 1. The station has a capacity of 1100 MW, comprised of two 550-MW units that burn pulverized lignite. The units are equipped with air quality control systems which include electrostatic precipitators and wet flue gas scrubbers for sulfur dioxide removal.
A large boiler for each unit provides steam at about 1000°F. This steam is piped to the high-pressure turbine, which is at the left of the unit shown in FIG. 2. The pressure of the steam turns the blades of the high-pressure turbine. This turbine and the steam turn the blades of the intermediate turbine. By means of crossover piping the exhaust from the intermediate turbine reaches the two double-flow tandem compound low-pressure turbine shells and causes those turbines to rotate. A large shaft from the low-pressure turbines turns the generator, which generates ac electricity that goes to a switch yard nearby. Here it is converted to 400-kv dc power for transmission over a distance of 400 mi at a voltage of 400 kv dc.
Another way to produce electricity is by conversion of solar energy. The photograph in FIG. 3 shows Solar One, a large central receiver solar electric power generating plant. It is a joint undertaking by the U.S. Department of Energy and several California utilities and agencies near Barstow, California. Its purpose is to establish technical feasibility of such plants; gather data on operation, maintenance, etc.; collect environmental impact information; and develop or stimulate commercial and utility acceptance of such systems. It is designed to deliver at least 10 MW of electric power to the utility grid for a 4-hr period on the shortest day of the year and a 7.8-hr period on the longest.
As shown in FIG. 4, the Solar One pilot plant consists of seven systems: (1) the collector system, which focuses incoming solar radiation; (2) the receiver system, which absorbs the redirected energy and converts feedwater to steam; (3) the thermal storage system, which minimizes energy transients and stores thermal energy for use during transient or nonsunshine periods; (4) the power generation system, which converts the collected thermal power into electric power delivered to the busbar; (5) the plant control system, which controls the plant and gathers data; (6) the plant support system, which includes piping, wiring, and other facilities and equipment; and (7) the beam characterization system, which calibrates the collector system equipment.
A megawatt is 1,000,000 W of power. It is also 1000 kW, a useful comparison because electricity is usually measured in kilowatt-hours (kwh).
By utility, we mean a company or municipal agency that produces or distributes electric power (electricity).
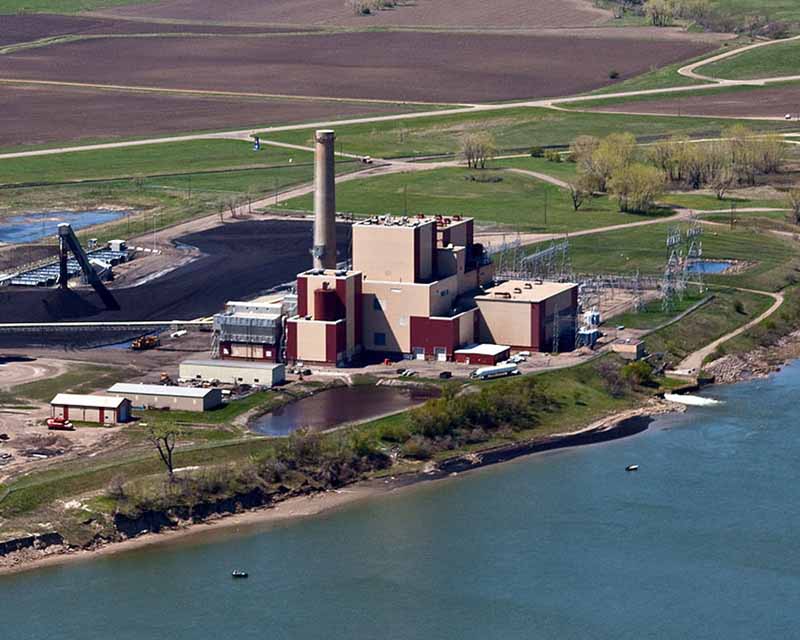
FIG. 1 Coal-Creek ( North Dakota) Station electric generating plant.
Two 550 MW units and their boilers and stacks are shown close together
in the right center. Cooling towers are at the left, and the main switch
yard is in the foreground. (Black & Veatch, Engineers-Architects.)
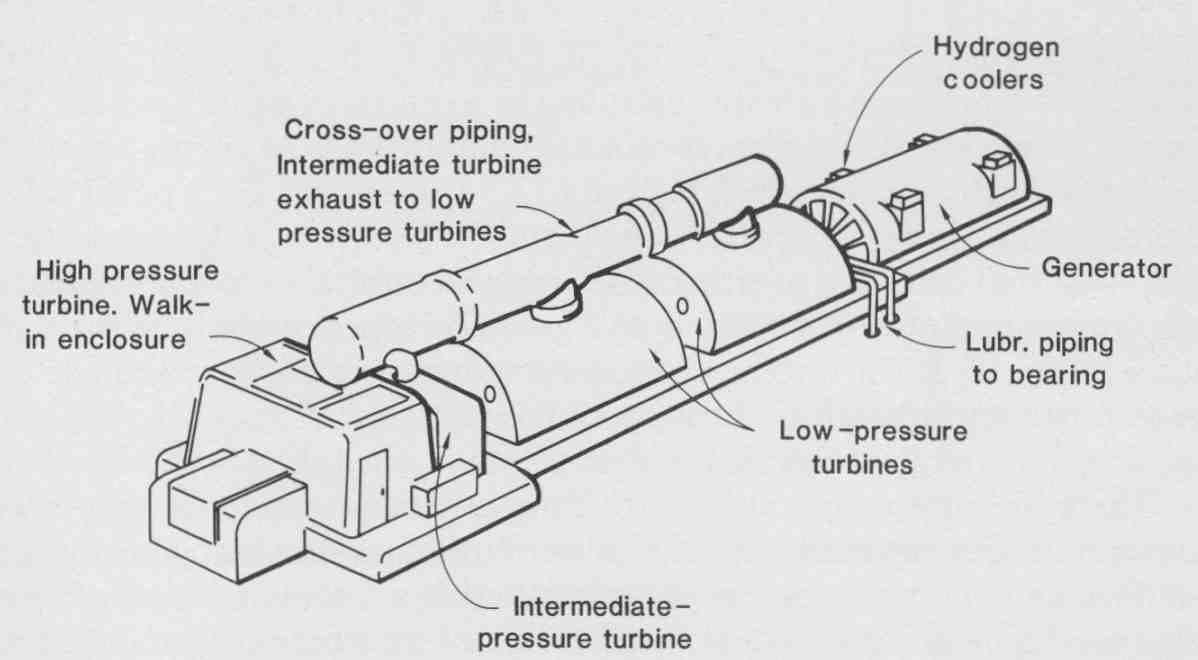
FIG. 2 Sketch of a large steam turbine-generator. This unit is called
a four flow tandem compound turbine generator. (General Electric and
Black & Veatch.)
The collector system has 1818 individually controlled tracking heliostats, each of which has 12 mirror panels 120 in. long by 43 in. wide. Each heliostat is driven by two motors which are controlled by a central computer system. The receiver system comprises a tower-mounted unit that has 24 energy-absorbing panels that form a cylinder 45 ft high and 23 ft in diameter. Each panel has 70 vertical tubes, in. in outer diameter. Hot (950°F) steam at 1465 psi is produced here and delivered to either a turbine generator, the storage system, or both simultaneously. The turbine and generator operate similarly to those shown in FIG. 2. The turbine and generator operate at 3600 rpm and deliver between 10.5 and 13.8 kV to the main station. Figures 6-2 and 6-18 show flow diagrams for central receiver stations or plants.
There are other methods of providing electricity. Hydroelectric power plants produce cheap electricity, but most of the good sites have already been identified and put in use for this purpose. Wind farms with hundreds of wind mills (wind generators) in certain windy locations have been constructed. Photovoltaic plants are quite promising for the future because the production of solar (photovoltaic) cells continues to rise and the price continues to drop. Also, small photovoltaic units are proving to be good investments and reliable power sources for remote locations. Plants producing as much as 16 MW have been built in the western United States. A large photovoltaic plant resembles a central receiver plant without the tower.
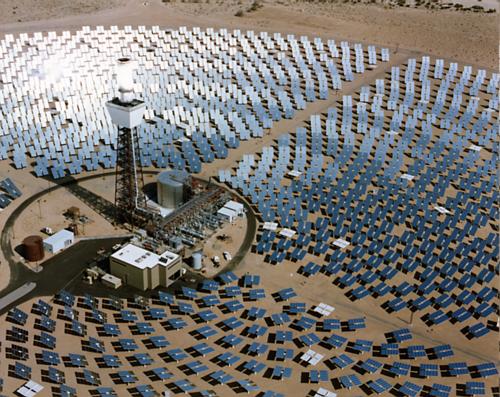
FIG. 3 The Solar One central-receiver electric power generating facility.
The total height of the tower and receiver is 241 ft., and 1818 collectors
(heliostats) are spaced around the tower. Reflection of the sun can be
seen on those beyond the tower and also on the receiver, which is the
target of reflections from the heliostats. (McDonnell-Douglas Astronautics
Company and U.S. Department of Energy.)
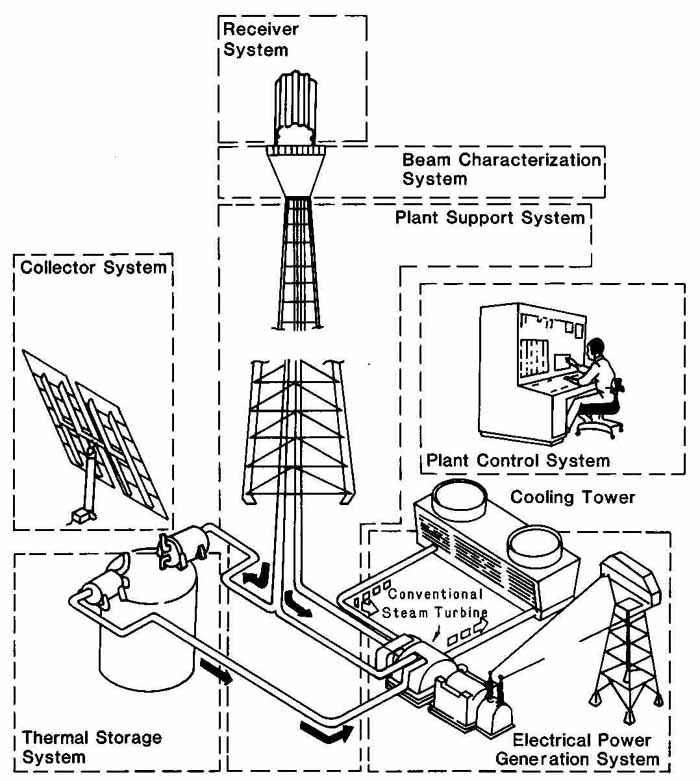
FIG 4 The seven systems of the Solar One pilot plant are shown in pictorial
form. Arrows indicate that steam generated in the receiver system can
be sent to either the power generation system or the thermal storage
system, which provides a steady-state source of steam for the turbine.
(McDonnell Astronautics Company.)
Drawings that are made for electric power installations, whether they are for electric utilities, industry, or large commercial buildings, are as complex as those made in various electronics areas. In fact, a complete set of drawings for a typical electric generating plant just about covers the entire field of electrical drawing. Included in such a set of drawings would be one-line circuit diagrams, three-line diagrams, control and elementary schematics, logic diagrams, general arrangements, and connection diagrams, as well as plans, elevations, Section s, and details of structures and equipment. In general, the ANSI Standard Y14. 15, “Electrical and Electronic Diagrams,” presents a good format and reference for single-line, schematic-type, and connection diagrams, and one should consult it, if beginning to work in this field. Electrical design and associated drawings should take into account the electrical safety requirements required by the “National Electrical Code,” which is discussed at length in Section 11.
2 The One- (Single-) Line Diagram
One of the first drawings made in a set of drawings for the design of a large project is a one-line diagram of the entire plant or system. Such a drawing shows by means of single lines and symbols the major equipment, switching devices, and connecting circuits of a plant or system.
FIG. 5 is a good example of a one-line diagram. The single line running down through the figure actually represents three lines in this three- phase system. The power path can easily be traced from the shielded aluminum cable, steel reinforced (ACSR) downward past a grounded lightning arrester, through a GOAB (trade name) disconnect switch, fused disconnect switches, and a step-down transformer. It continues on down through an oil circuit breaker and auxiliary equipment. However, part of the electricity is sent through potential transformers, where it is stepped down to a small voltage for metering. In addition, current transformers near the OCB are used for current- measuring meters, none of which is shown in the drawing, although each is referred to in a note. From here, the power goes through a disconnect switch, past another lightning arrester, and out through a 12.47-kv FCWD (type F Copperweld) line.
Salient features which should be observed in the making of one-line drawings, as shown in FIG. 5, are:
1. Use of standard symbols, abbreviations, and designations
2. Highest voltage lines placed at the top or left of the drawing, if possible, with successively lower voltages placed downward or to the right
3. Main circuits drawn in the most direct and logical sequence
4. Lines between symbols drawn either vertically or horizontally, with minimum crossing of lines
5. Generous spacing to avoid crowding symbols and notes
6. When pertinent, information included on rating of equipment, feeder lines and transformers, vector relationship of equipment, ground or neutral connection of power circuits, protective measures, types of switch and circuit breaker, and instrumentation and metering
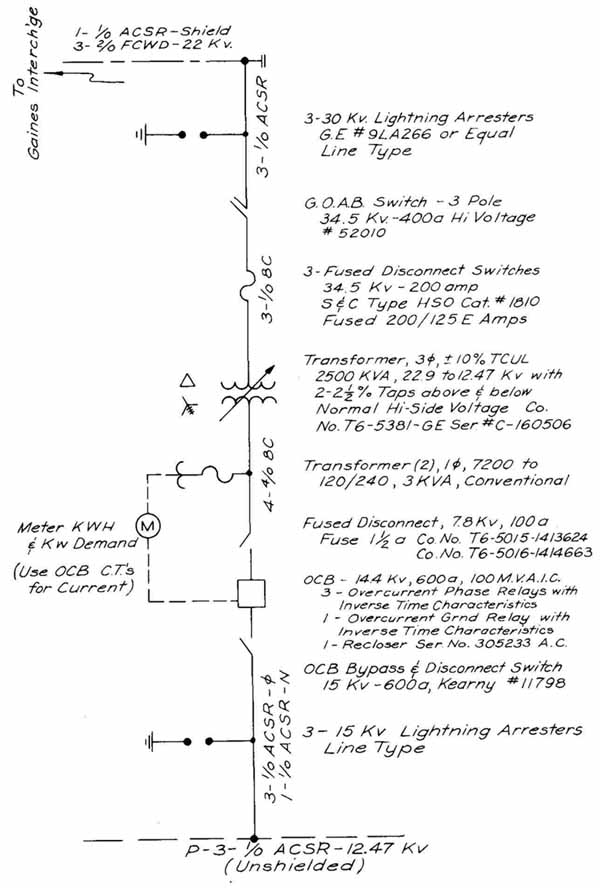
FIG. 5 A one-line diagram of a substation. (Southwestern Public Service
Company.)
If the above points are observed in the making of a one-line diagram, the drawing will impart a clear picture of the system so represented. The one-line drawing, which is used for many purposes, is a distinctive drawing peculiar to the electrical field and as such has made a great contribution to the industry. Although old, FIG. 5 is still a good example of a one-line diagram. A diagram drawn today might have higher voltages, such as 161 or 138 kV at the top, more meters and switches along the way, and more bushing-type transformers. Wire sizes would be correspondingly larger than those shown.
Approximately one-half of a one-line diagram for a part of a large electronics manufacturing plant is shown in FIG. 6. This diagram shows the electric energy coming from the power company after having been reduced to 12.47 kV. A small substation on plant property reduces this supply to 4.16 kV by means of an Askarel-filled (A-F) transformer. The 600-MCM conductor has an area equal to 600,000 circular mils. A circular mil is a unit used in specifying the cross-Section al area of round conductors. It is equal to the area of a circle whose diameter is 1 mil (0.001 in.).
The path of the energy can be traced to the motors at the bottom. These motors turn compressors and chillers for the plant air conditioning. To facilitate reading the diagram, a legend showing the abbreviations was printed on the diagram. It is reproduced below:
- A Ammeter
- AS Ammeter switch
- V Voltmeter
- VS Voltmeter switch
- TB Test block
- 27/59 Under/over voltage relay
- 46 Phase-failure relay
- 49 Overcurrent-overload relay
- 50/51 Overcurrent (instantaneous and time) relay
- 51 N Overcurrent (ground) relay
- 64 Ground-fault relay
- 67 Directional overcurrent relay
- 87 Differential-protective relay
To the right of and below most of the symbols is a number. This number indicates how many of the devices are represented by the symbol; A for instance, means that there will be three devices (one on each line) at that location.
In accordance with ANS Y14.15, “Electrical and Electronics Diagrams,” the primary conductors have been shown with heavy lines. Some other details recommended by this standard are:
1. Winding connection symbols should be shown for all power equipment.
2. Neutral and ground connections should be shown for all grounded equipment.
3. Rating and type of load, when available, should be shown for each feeder circuit.
4. Current transformers should show the ratio of transformers and the ampere ratio. (Example: 3 — 600/5.)
5. Industrial control single-line diagrams may omit equipment ratings when they are used as standard drawings applying to more than one rating.
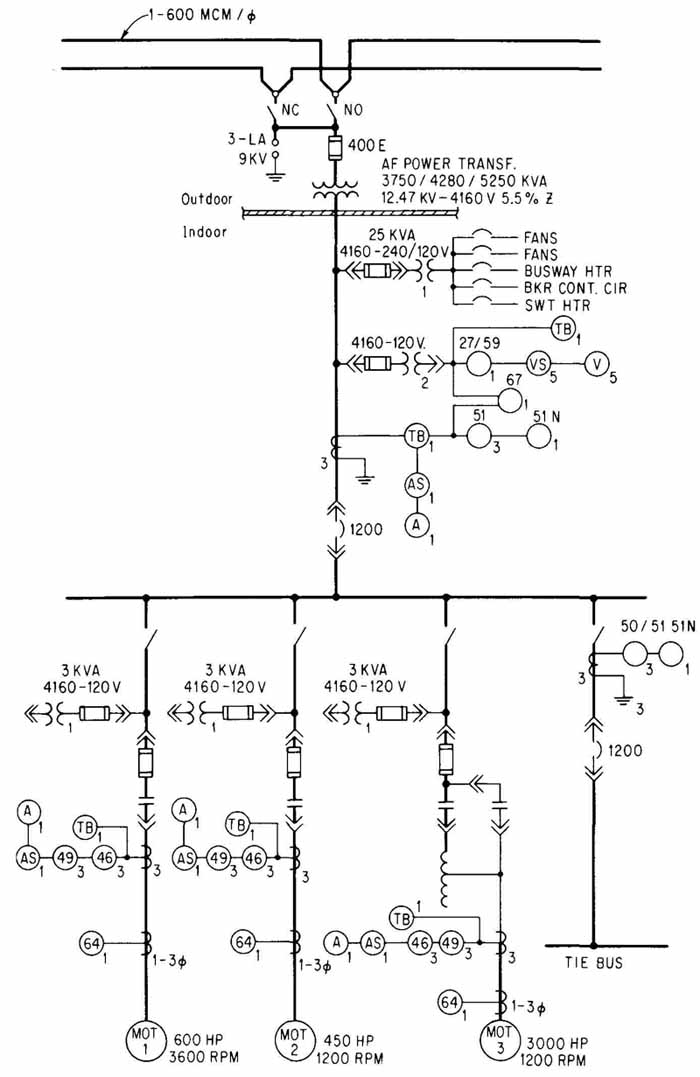
FIG. 6 Part of a one-line diagram for an industrial plant. (AT&T
Technologies.)
3 Three-Line Diagrams
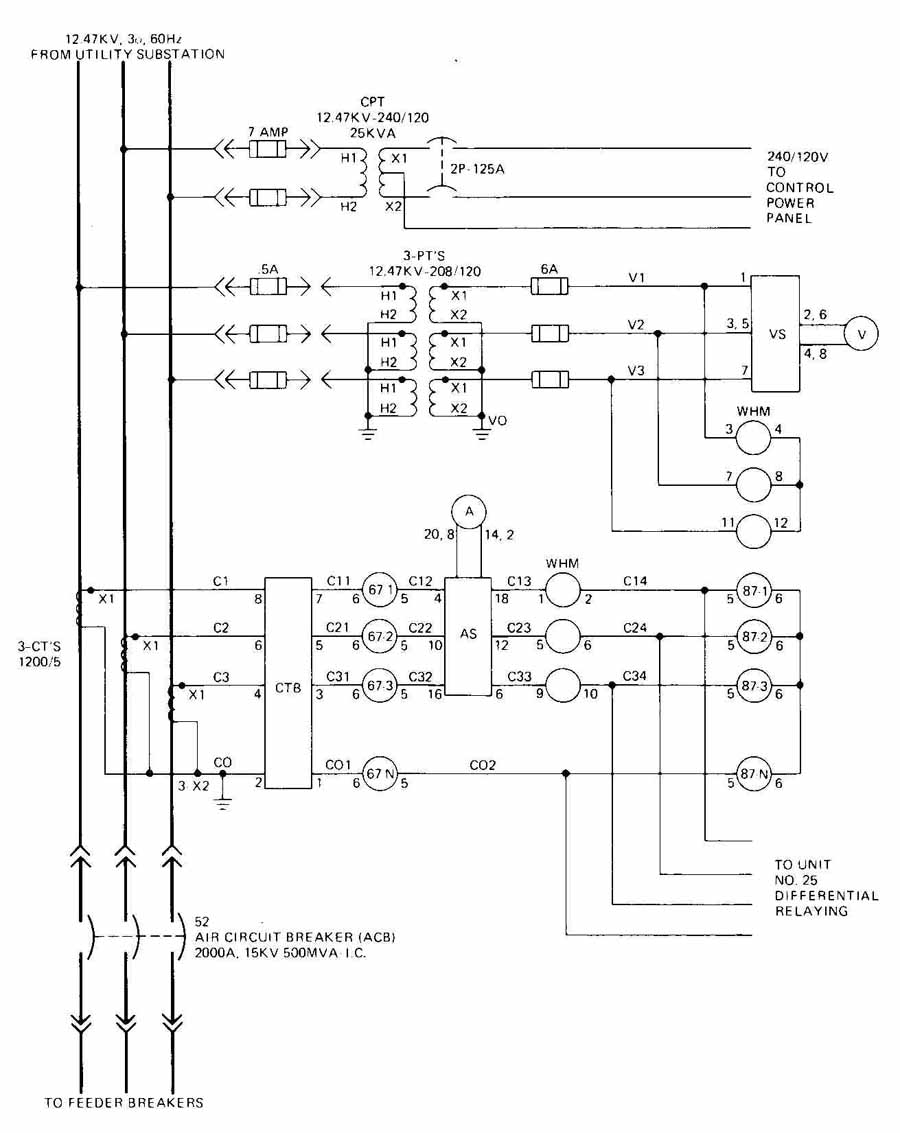
FIG. 7 Three-line diagram of 15-kv main breaker.
A schematic-type drawing used in the electric power field is the three-line diagram, which is an expansion of the one-line diagram showing all three phases. Its primary purpose is to graphically illustrate the electrical connections and functions of the metering, relaying, and control power circuitry. It does not show the control of power equipment (e.g., circuit breakers) by this or other circuitry. Three-line diagrams are usually done for generating stations, substations, or any electrical installation that has metering or relaying circuitry. Three-line diagrams are an invaluable aid for construction and maintenance of electrical facilities in that they provide:
1. A complete three-wire schematic, showing all devices, wiring, and connections and their conceptual operation
2. A clean, concise picture of the point-to-point connections
3. The correct way to connect polarity-sensitive devices, such as current and potential transformers
FIG. 7 shows a three-line diagram of a main breaker and its associated relaying and metering in a 15-kv distribution center in a large industrial complex. The breaker is one of several breakers in an enclosed, indoor, metal-clad switchgear installation. Power conductors in a three-line diagram are generally drawn at the top from left to right or on the left side (as in this case) from top to bottom. The power conductors, like those in the single-line diagram, are shown in heavier lines than the relaying and metering conductors. Device ratings are shown next to the device, and, if it is multi-rated, the maximum rating and the connected rating should both be shown. Device-function abbreviations and/or numerical codes are shown (e.g., 52 is a circuit breaker). Where two or more devices with the same number function designation are present, they are distinguished with lettered or numbered suffixes (e.g., 87— 1 means device 87 in A-phase). Device terminal numbers are generally shown to the left or below the conductor, while wire numbers are shown to the right or above the conductor. Wire numbers are generally a series of numbers or characters, such as C C C which provides easier troubleshooting and intelligent conceptual continuity. If two arrangements of the same devices are used, for example, of a current transformer (CT), one CT’s wire numbers would be 1 C 1 C . . . , and the other CT’s wire numbers would be 2 C 2 C . . . , in order to differentiate between the wirings.
FIG. 8 shows a similar, but 5-ky class, air breaker and cubicle (cell). Notice how the breaker is on roller wheels and withdraws from load and line stabs (not shown) in the cubicle.
Three-line diagrams should be done with good organization and attention to detail and spacing in order to present a clear, accurate picture of the metering and relaying circuits. The three-line diagram plays an important part in presenting the total picture of a power system.
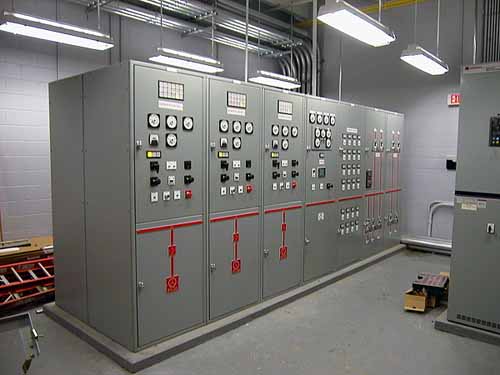
(a)

(b)
FIG. 8 (a and b) Photographs of 5-kv switchgear with breaker withdrawn.
(Westinghouse Electric Corporation and Siemens.)
4 Logic Diagrams
Logic diagrams provide an effective means of communication among persons involved in design, construction, operation, and maintenance of electric generating stations. The five basic symbols are shown and explained in FIG. 9.
Also shown are typical equivalent electric circuits. Some supplementary logic symbols are shown in FIG. 10. These symbols convey necessary information used by the electrical control designer, and with their associated descriptive information (panel item, numbers, etc.), aid the overall project design coordination.
The symbols shown do not agree entirely with any one manufacturer’s standard, but they are similar to the National Electrical Manufacturers’ Association (NEMA) Standard. No particular device is represented by one of these symbols. This type of diagram, therefore, leaves the design of the circuit (including arrangement and selection of devices) up to the electrical control designer.
5 Relationship between Logic and Schematic Diagrams
FIG. 11 shows the logic diagram(s) and schematic diagram of a system that provides correct operation and supervision of an auxiliary oil pump. The logic diagram is interpreted as follows:
If the control switch is in the start position or in the automatic position and the turbine hydraulic-oil pressure is low, the pump starts. When the starting device is actuated or closed, a red light will go “on” on the turbine start-up panel (TSP) and on the control panel (CP). (The control switch is on the TSP, incidentally.)
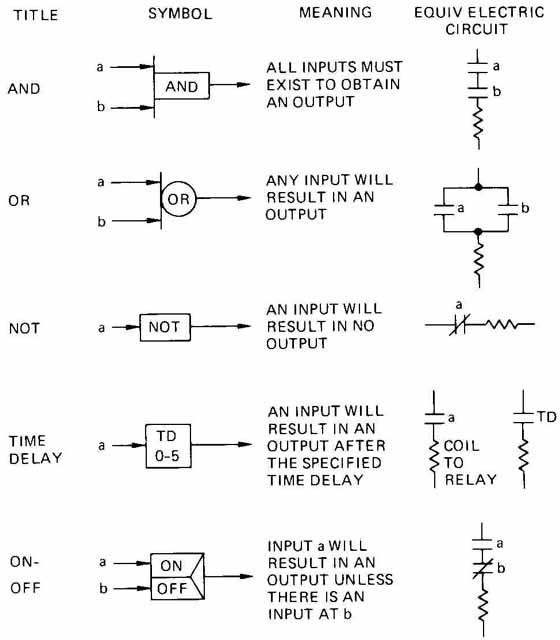
FIG. 9 Basic logic symbols. The time-delay symbol numbers give the range
of adjustment desired in seconds.
If the control switch is in the stop position or f there is a motor overload, the pump stops. In this case a green light will be energized on the CP and the TSP.
If the motor had started and then tripped for some reason other than a control-switch action, an alarm would have sounded on the visual annunciator (item CP window B and a white light would have been energized on the TSP.
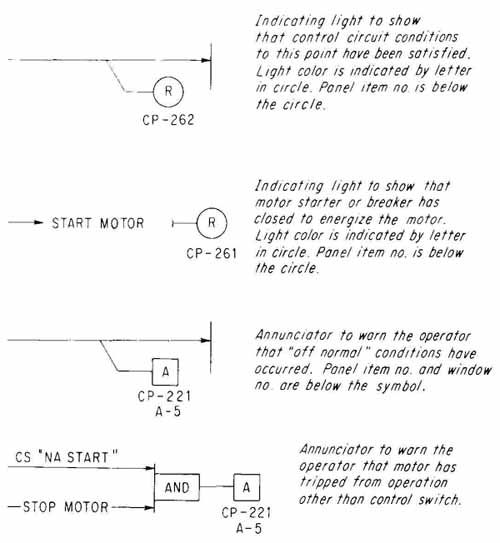
FIG 10 Supplementary logic symbols.
Certain conventional functions or actions are understood in the reading of these diagrams.
1. Unless otherwise indicated, control switches, pushbuttons, and selector switches are understood to be spring-return to normal.
2. Electrical interlock devices such as cell interlocks are not shown but are understood to be present in accordance with the clients’ or office standards.
3. “Motor trip” (as contrasted to “stop”) is understood to mean that the motor has stopped for some reason other than a control-switch action.
The schematic diagram which applies to the logic diagram in FIG. 11 explains in detail all the items necessary for accurate electrical construction and operation, and also becomes a valuable maintenance tool. The control-switch development normally shown on this type of drawing has been deleted for simplicity.
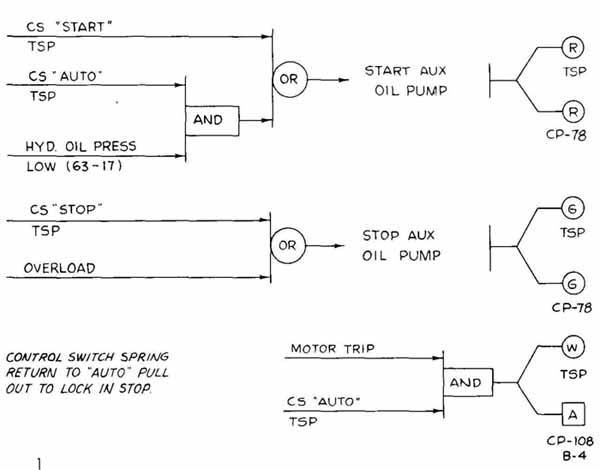
FIG. 11 Example of a logic and a schematic diagram for an auxiliary
oil-pump control system. (Black & Veatch, Engineers-Architects.)
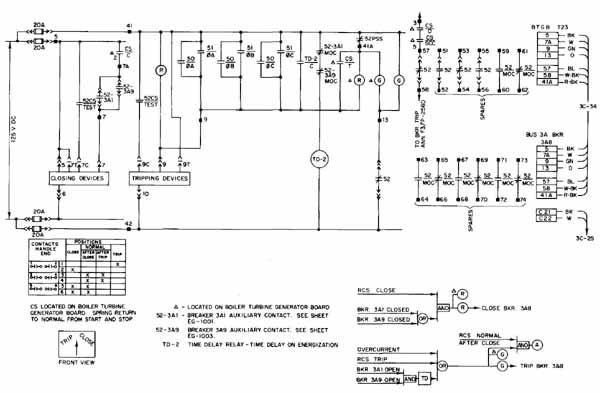
FIG. 12 Schematic drawing of a substation feeder circuit. Also included
are control-switch development (upper right) and logic diagram (lower
right).
It is possible, but not practical, for the system designer to dispense with schematic diagrams and to employ only logic diagrams in communicating with the fabricator of the control systems. However, according to one designer, the following reasons justify making of schematic diagrams for most systems:
1. To show a complete system with all the desired electrical features
2. To control the selection of alternatives in the circuitry and components to be used by the manufacturer
3. To permit early determination and retain control of interconnecting cable requirements
FIG. 12 is the control schematic of a substation feeder breaker which is used in a power generating station. The schematic shows the trip and close circuits that control the operation of the breaker. The trip and close devices which are on the breaker are represented on the diagram by rectangles bearing the labels “Tripping Devices” and “Closing Devices.” These devices are usually solenoids that actuate spring-charged, mechanical operators on the breaker. The breaker and its associated contacts are represented by function number 52. The actual breaker, which is a power circuit device, is also not shown on the control schematic; however, the authors have seen control schematics on which it has been represented. The drawing also contains a logic diagram and control- switch development, which shows the switch position and the associated con tact arrangement. Some of the abbreviations which may not be familiar to the reader are: CS, control switch; BKR, circuit breaker; BTGB, boiler turbine generator board; SCC, station control cabinet; PSS, permissive selector switch; RCS, remote-control switch; MOC, mechanically operated contact; and 4A, phase A.
Many power generating stations and industrial plants use large (up to 20,000-hp) motors for pumps, such as condenser, tower, or boiler water; fans, such as boiler and tower; and auxiliary operations, such as coal pulverizers. The motors are characterized by their higher voltages (14 and 4 kv) and their larger and more complex controls. The schematic-type drawing used for the control circuitry is the elementary or ladder diagram, discussed in depth in Section 9. FIG. 13 shows an elementary diagram of the motor controls for a small (350-hp) condenser water-pump motor. The contactor shown is of the removable 4-kv class. Many times, breakers are used in place of contactors for large- motor control. In addition to the normal fuse and overload protection, this motor also has phase-failure (PHFR) and ground-fault (GF) protection. Notice that current transformers are used in the overload and metering circuits. The legend explains the devices not familiar to the reader.
Schematic-type drawings, such as the control schematic and the elementary diagram, used in electric power work provide insight into the necessary functions of the controls along with the necessary electrical connections. As described earlier, the complexity of the controls required in electrical power systems sometimes dictates that logic diagrams be done to aid, but not replace, schematic-type drawings.
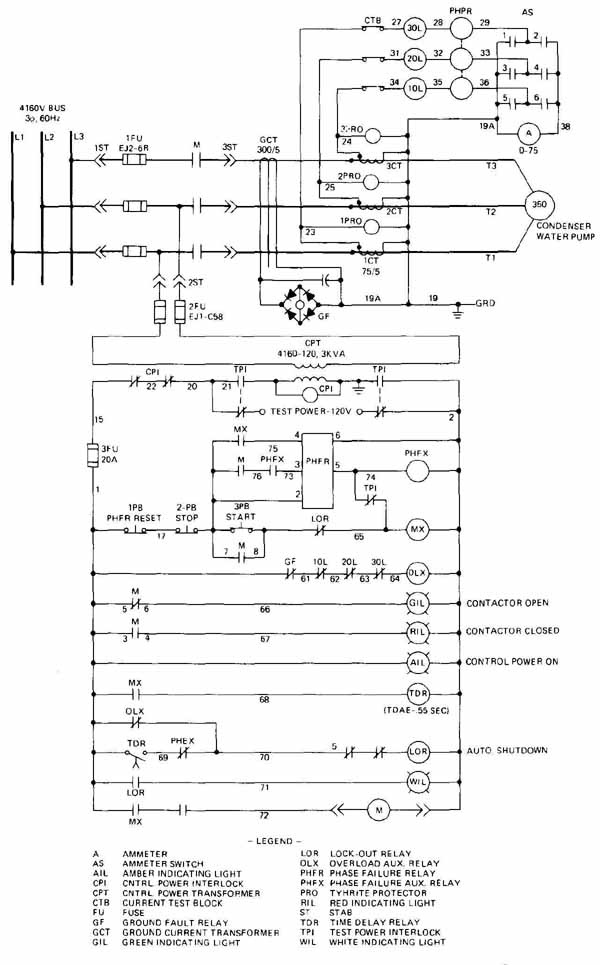
FIG. 13 Elementary diagram of a motor controller for a condenser water
pump. (General Electric Company.)
6 General Arrangement
The general arrangement drawing shows how the equipment will be physically arranged when it is manufactured and installed. It is an extremely important drawing in a complete set of electrical drawings because it is the only one that shows the actual equipment. General arrangements show equipment exteriors and dimensions; the location of devices such as relays, meters, etc.; and pertinent details necessary for field installation, such as service entrances, mounting channels, etc. Such a drawing always contains an elevation and may also contain a plan (top) view, Section views, details, and, sometimes, small, simple one-line or three-line diagrams. Because the general arrangement shows the equipment as it will physically exist, it is used by engineers to tell manufacturers how they would like the equipment fabricated and installed.
FIG. 14 shows a general arrangement of a primary-selective, 15-kv- 480v/277-v, 100-kvA indoor secondary unit substation. This substation consists of three basic assemblies, namely the two primary (15-kv) switches, the transformer, and the low-voltage switchgear. The primary switches are primary-selective because they are interlocked so that only one switch may be closed at anytime. The transformer is Askarel-filled (presently not used due to environmental regulations). The switchgear has main, tie, and several feeder breakers. This general arrangement contains an elevation, a plan view, and a simple single-line. This drawing is extensively dimensioned and shows some details. The single-line shows the key interlocking system that is used for personnel safety and proper operating procedures. FIG. 15 shows an indoor substation similar to the one shown in the previous general arrangement.
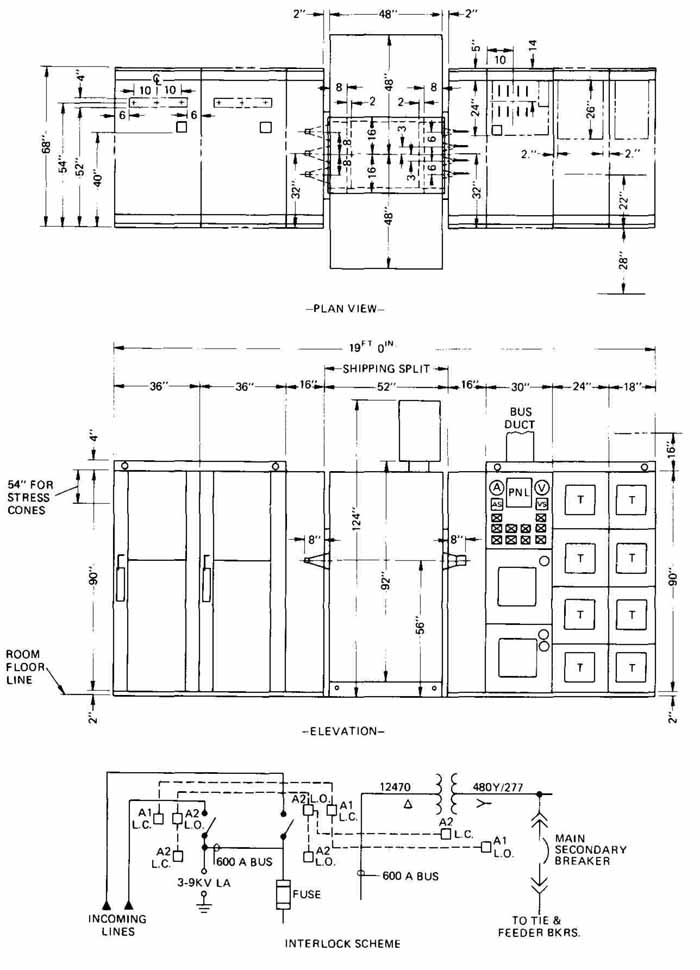
FIG. 14 General arrangement of a primary-selective, secondary unit substation.
The primary switches are on the left, the transformer is in the middle,
and the secondary switchgear is on the right. (Gould-Brown Boveri.)
FIG. 16a shows two views of a large outdoor substation. The lower view is one of three Section s, the location of which is identified in the top view with flag-like shapes and the letter A. FIG. 16b shows a Section of a newer substation. Most of the major elements of this substation are identified by “balloons” of various shapes and further described in a schedule on the right side of the sheet. For example, hexagons 1, 5, and 6 are (1) 161-kv circuit switcher, (5) 161- to 13.2-kv power transformer, and (6) 13.2-kv grounding transformer. Squares 2 and 4 are supporting stands for a 161-kV switcher and 161-kv bus, respectively. Circle 5 denotes an A-frame structure.
There are no accepted standards in drawing general arrangements; however, they should be done in such a manner as to give an accurate representation of the physical structure and how it will be installed. These drawings should be as simple as possible, without superfluous detail, neat, and good examples of orthographic projection as it applies to the electrical industry. Occasionally an isometric projection or some other type of pictorial view is used as a supplement to, or a substitute for, the views shown here.
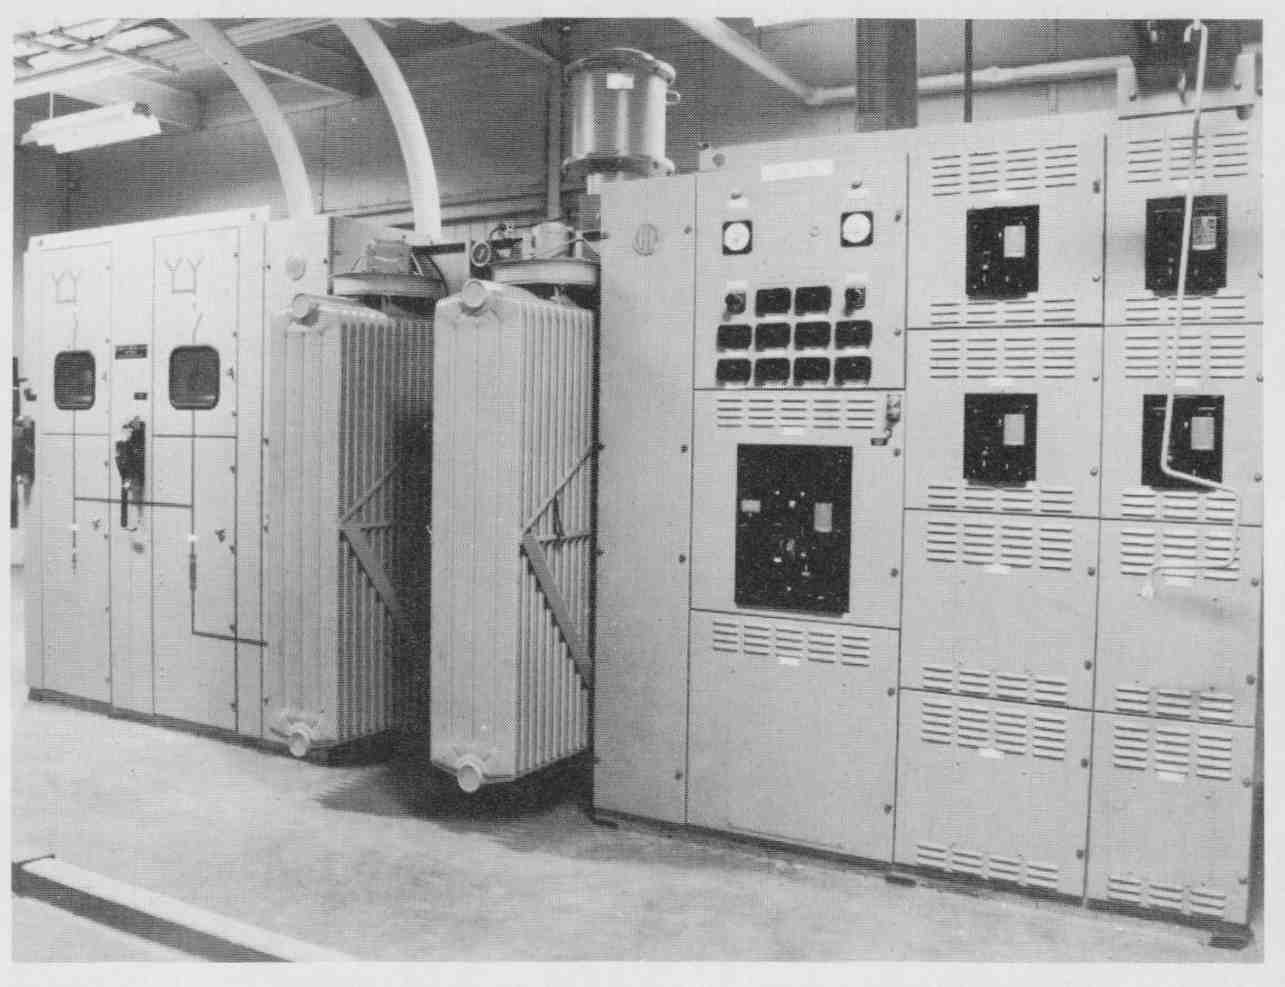
FIG. 15 Photograph of a secondary unit substation. (Gould-Brown Boveri.)
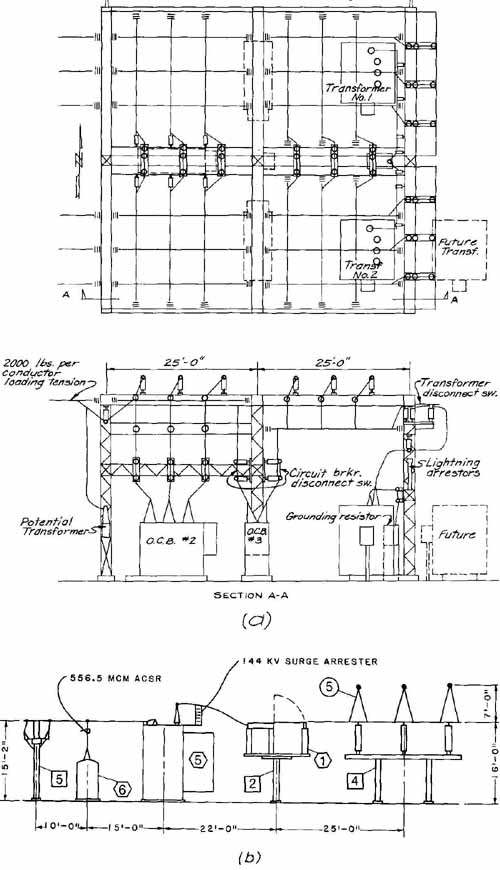
FIG. 16 General layouts: (a) top view and Section of a substation; (b)
elevation of a newer low-profile substation. (Black & Veatch, Engineers-Architects.)
7 Connection Diagrams
Connection diagrams are usually necessary and desirable, for electrical installations and their complexity directly depend on the complexity of the electrical installation itself. Connection or wiring diagrams show the physical wiring connections of control, metering, relaying, and auxiliary devices and do not generally involve the power conductors or devices. There are two basic types of wiring diagram: the diagrams associated with the internal wiring of pieces of equipment, commonly called wiring diagrams, and those diagrams associated with the external wiring connecting the individual pieces of equipment to one another, called interconnection diagrams.
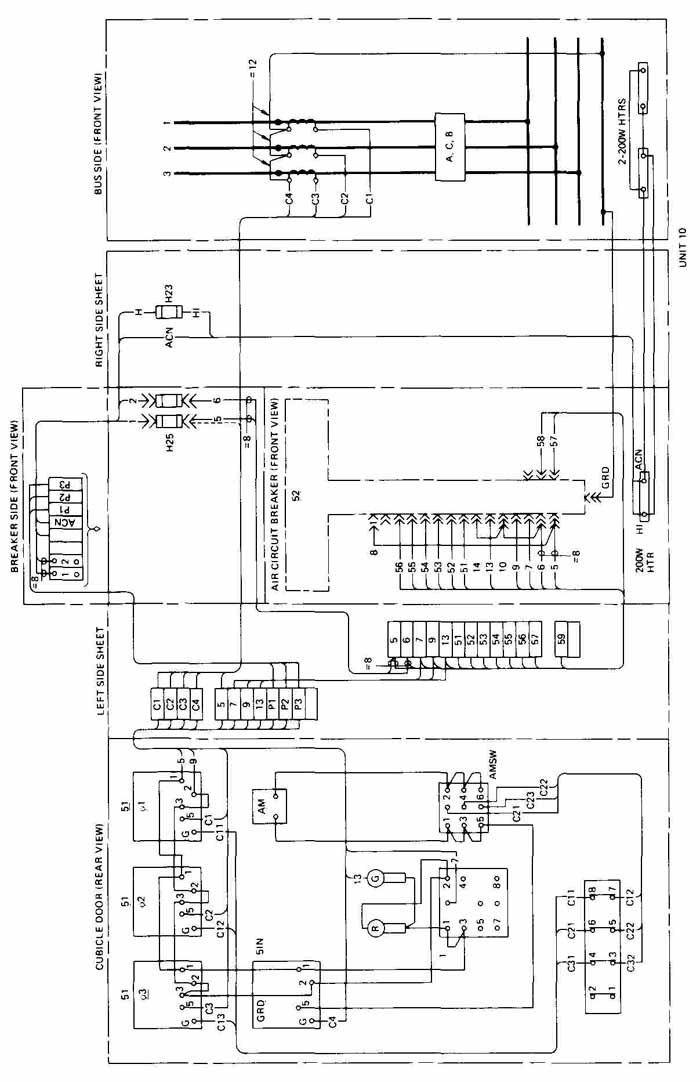
FIG. 17 Wiring diagram of a 15-kv feeder air-circuit-breaker [Gould-Brown
Boveri]
FIG. 17 shows the wiring diagram of a 15-kv air-circuit-breaker (ACB) cubicle that is used as a feeder breaker for a large industrial plant. It is one of several feeder breakers in a line-up (row) that make up a 15-kv distribution center. This wiring diagram shows the whole cubicle opened up from left to right, showing the rear view of the front door, the inside left side of the cubicle, the inside front of the cubicle, and the inside right side of the cubicle: it also shows a simplified three-line diagram, showing CT connections. All devices (relays, meters, etc.) are shown in their proportional sizes. This diagram uses highway-type connections, described previously in the text. The use of high way-type connections is predominant in the industry; however, the authors have seen wide variations. Note that the wires are numbered as described in the three-line-diagram Section .
FIG. 18 shows a partial interconnection diagram for a 15-kv switch-gear line-up, which includes the breaker in the previous drawing. Again, high way-type connections are used. The interconnecting wires carry the same number all through each piece of equipment. The common or interconnecting wires associated with this figure involve ac control power (ACN, HB), dc control power (1, 2), and the 120-V metering voltage (P F and F)
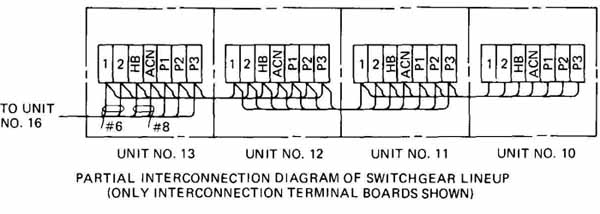
FIG. 18 Partial interconnection diagram of a line-up of 15-kv metal-clad
switchgear, showing only interconnections. (Gould-Brown Boveri.)
Connection drawings, as these examples have illustrated, should show the best perspective and identification of the actual wiring. Routing of wiring must be shown exactly as it is to be done. Connection drawings are an important part of the electrical drawing package in that they show the actual wiring.
8 Power Distribution Plans
Power distribution plans or layouts are plan views showing the electrical distribution equipment (e.g., substation, bus ducts, etc.), the utilization equipment (e.g., pumps, furnaces, etc.), and the general routing of the electrical services between them. Because these plan views show equipment and are generally to scale, they are also used in the physical planning and installation of the equipment and services. Equipment is usually shown as an outline with little detailing. Distribution plans may also contain equipment ratings, exact service routings, service specifications (conductor information, raceway information), mechanical services, or other miscellaneous information. What should be included will depend on the firm for which you work. Experience has shown that if power layouts are done in areas that are congested or are rearranged quite often, they should be done in - or j-in. scale; smaller scales have proved slightly more difficult to work with.
FIG. 19 shows a power distribution plan of a mass-production ma chine shop. Here the electrical distribution equipment is 480- and 208/120-V, 3- enclosed bus ducts, which are mounted over the equipment near the ceiling. Bus ducts contain solid metal bars (3 or 4), conductors which are insulated from each other, and the enclosure housing. The bus duct receives its electric service from a substation (480 V) or a transformer (480V—208v/120 V) connected to a 480-V bus duct. The bus ducts are plug-in. This allows bus-plug disconnects to be plugged into them much as plugs are plugged into common house receptacles. From the bus ducts, the electric service is run via the bus plug and conduit to the disconnect on the machine. This machine shop only requires 30-A bus plugs. Each service to the machines shows only the number of conductors. conductor size, conduit size, and phasing, if less than three-phase; voltages are obvious because the service source is shown. Conductor material (copper), conductor insulation (THWN), and conduit material (rigid metal-steel) are not shown because they are standard within this factory. This plan shows equipment names and numbers to locate it more accurately and differentiate it from similar equipment of the same model. Some of the symbols are standard — for example, a disconnect or motor controller— while other symbols are not — for example, a circled number 4, which is a 115-V, 15-A two- outlet receptacle, and a P, which is a 1 - 208/120-V, 4-pole power panel. The number next to the circled number is the panel circuit number.
Power distribution plans are an integral part of the electrical drawing package in that they are the only drawings that show service routings and equipment space occupancies.
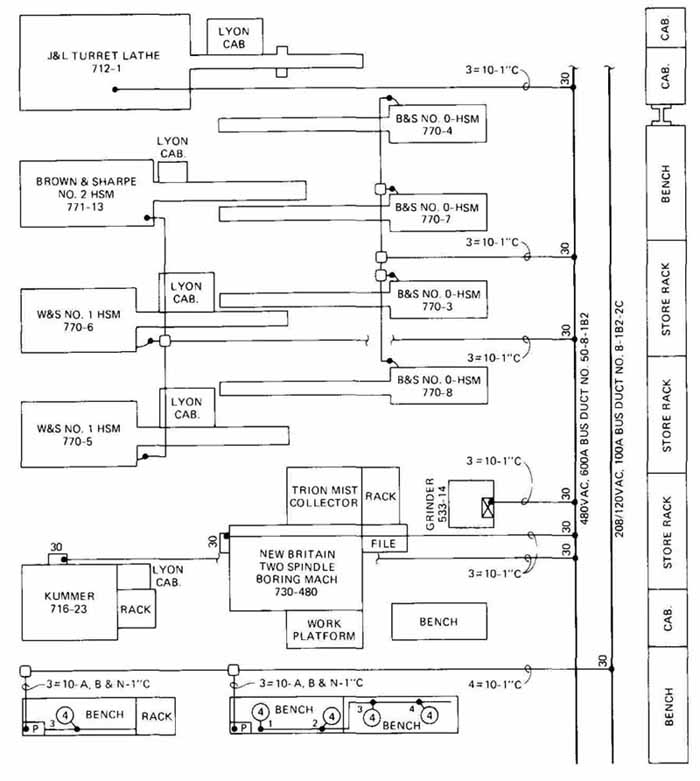
FIG. 19 Power distribution plan of a mass-production machine shop.
9 Details and Specifications
No set of drawings covering a power installation of any size is complete without detail drawings. There may be several large sheets filled with small detail drawings. These may be roughly divided into two categories: (1) special and (2) standard details.
Special details, which cover the particular project being delineated, may include many different items, installations, or interconnections.
Examples of these drawings appear in FIG. 20. Two views showing the arrangement of trays are given (see FIG. 20a). These are rectangular metal ducts in which conduits are run throughout the structure. The conduits themselves are usually not shown, but their tray placement can be determined elsewhere, such as in the circuit routing designation in the specifications. FIG. 20b shows a Section of a duct bank, which is an underground encasement with six banks of 3-in. Korduct in which cables are run. Korduct is a thin-walled pipe used for encasement in concrete. Transite pipe is used for direct burial in the ground, as are ducts of fiber and plastic.
These are just three of the many details that are encountered in drawings for the electric power industry. Standard details, which may be used for more than one project, are usually drawn just once, but reproduced many times. Sometimes they are reduced to 8 X 11-in, size, then bound in the printed specifications.
The preparation of specifications is an important part of the engineer’s job. The person who makes the electrical drawings can expect to do much work on the specifications. Specifications are usually done for installations, equipment, or material. Specifications generally consist of a legal portion, which engineers do not write; specific requirements; general provisions; and general requirements. The specific requirements include such things as scope of work, work by others, contract drawings, information to be submitted with bid, etc. The general provisions, which are usually written by cutting and pasting from previous specifications, contain specifications on such things as codes, interferences, quality of work, materials, tests, contractor’s required facilities (office, telephone, etc.), trucking, toilet facilities, etc., or items of a general nature that need to be spelled out and clarified. The general requirements would contain the specifications for equipment and installation materials and methods required for the electrical installation itself. Beside requirements for an electrician’s work, this portion of the specifications would spell out the work for other trades.
10 General Trends
The number of control circuits in generating-station construction is so large that drawing them on one-line diagrams has been largely abandoned in favor of logic diagrams. Similarly, the practice of drawing circuits on electrical plans has given way to showing raceway numbers (trays, conduits, etc.) only. All details are organized in the raceway and conduit schedules and by interconnection diagrams or schematics. FIG. 20a shows tray details in elevation; similar drawings are used to show tray and raceway details in plan (top) views.
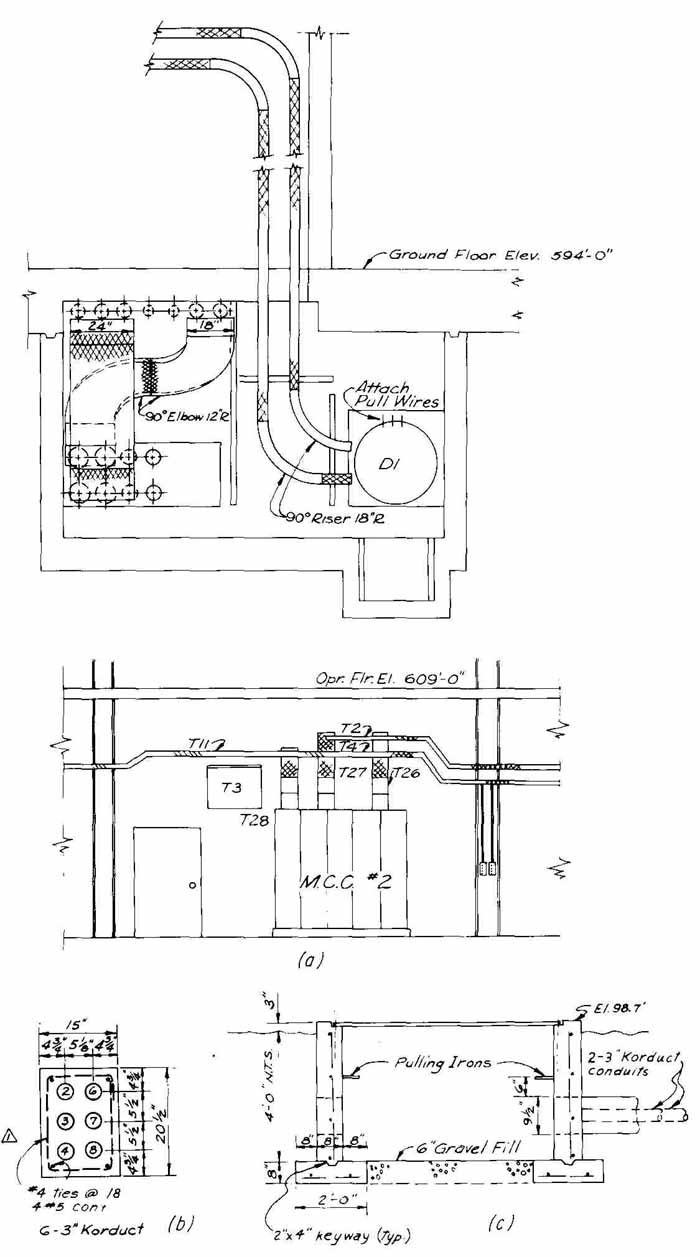
FIG. 20 Special details that are part of a set of drawings for a power-generating
station: (a) tray details; (b) duct bank; (C) pull box. (Black & Veatch,
Consulting Engineers.)
Another trend is that some manufacturers are furnishing internal wiring diagrams of their equipment that show only device terminals and wire numbers, and not the routing of the wiring. These diagrams, therefore, are less cluttered than the typical wiring diagrams; however, the value of this trend is debatable. Another trend is the use of computer-generated drawings by manufacturers and engineering firms. This trend is most apparent in bills of materials, standard details, control schematics, and wiring diagrams. These drawings are generally clear, very well organized, and of good quality.
As in electronics, there have been great advances in technology in the electrical field. Some of these advances are better insulating materials in components (transformers, breakers, wire, etc.); larger voltages in generation (260 kV), transmission (765 kV), and distribution (161 kV); larger and more efficient generating plants; and, of course, nuclear generating stations. But the largest and yet most subtle technical advance in the electric power field is the tremendous expansion in the use of semiconductor-controlled equipment. A partial list is as follows:
1. Static exciters with capabilities up to 3000 kW for electric generators
2. Solid-state protective devices, such as relays, which give more and better protective characteristics for the power-handling devices, such as breakers
3. SCRs for rectification and inversion, one of the prime reasons that dc trans mission over long distances has become a practical, economic reality
4. Solid-state speed controls for motors, which have all but replaced their mechanical predecessors
However, the complete online computer control of power generating facilities represents the ultimate in this direction, and it has been accomplished by some utilities and industries. All these technical advances will have an effect on the number and complexity of drawings needed to show the complete picture of an electric power installation.
SUMMARY
The explanations and drawings in this section give a representative, but not complete, picture of the drawings used in the electric power field. It is felt that the drawings are typical enough and the coverage broad enough that the reader will have a reasonable knowledge of the drawings done in this area.
The one-line diagram is almost unique to the electric power field, showing in abbreviated form the course or energy flow of the power circuit and associated devices. Logic diagrams are an invaluable aid in developing an overall control scheme. Schematic-type drawings, such as the three-line, control, and elementary diagrams, have the functions of illustrating metering and relaying, as in power circuits, breaker control, and motor control, respectively. General arrangements show how the electric power equipment will be physically arranged when manufactured and installed. Connection-type diagrams show the physical wiring of individual pieces of equipment or the interconnection between pieces of equipment. Power distribution plans show the physical layouts of distribution and utilization equipment and the routing of electric services between them. Special and standard detail drawings are necessary and round out the set of drawings required for any large installation. Printed specifications, sometimes volumes of them, will accompany sets of electric power drawings. Engineers and drafters engaged in the preparation of such drawings may expect to participate in the preparation of these specifications.
QUESTIONS
1. Describe a one-line diagram and its function.
2. How can one indicate that more than one relay of the same type is used at one location on a one-line diagram?
3. At which end of a one-line diagram are the higher-voltage lines and equipment placed?
4. Name five different kinds of relay that might be shown on a one-line diagram for an electric substation.
5. Describe briefly what the following abbreviations stand for: CT, PT, BKR, OCB, FCWD, R, MCM, CS, AWG, ACB.
6. What is the purpose of a three-line diagram? Describe its arrangement.
7. How is more than one relay of the same type, connected to different lines via PTs or CTs, identified on a three-line diagram?
8. Describe how a logic diagram is used in electric design, and its interrelation to control schematics.
9. What are the five main functions used in logic diagrams for the electric power field?
10. What type(s) of circuit can be appropriately described by means of logic diagrams?
11. What is understood about pushbuttons and control switches in reading the logic diagrams shown in this section?
12. Why is it impractical to use only logic diagrams and not have control schematics?
13. Describe a control diagram. What is its function? What does the number 52 refer to?
14. What is the function of a general-arrangement drawing? What are the typical views found on the general arrangement?
15. What is the diameter of a 20-gage wire? Of a 500-MCM conductor?
16. What method of drawing connection or wiring diagrams is generally used in the electric power field?
17. Describe an electric power distribution plan. What is its primary function? What information is found on it?
18. What is meant by raceways in electric power construction? By duct banks, trays, and conduits?
19. Describe the two types of detail drawings presented in this section.
20. What are specifications? Do drawings accompany them?
21. What are some of the trends in this field? How do you feel they will affect the electrical drawings?
PROBLEMS
1. FIG. 21 shows the plan (top) view of the grounding for a large solar energy generating station. Each space on the scales at top and left represents 250 ft. Let each space represent 3/4 in., using a 3/4 scale or 20 units on a 30 scale. Draw the layout on a sheet of 8- X 11 paper, using one of the two scales.
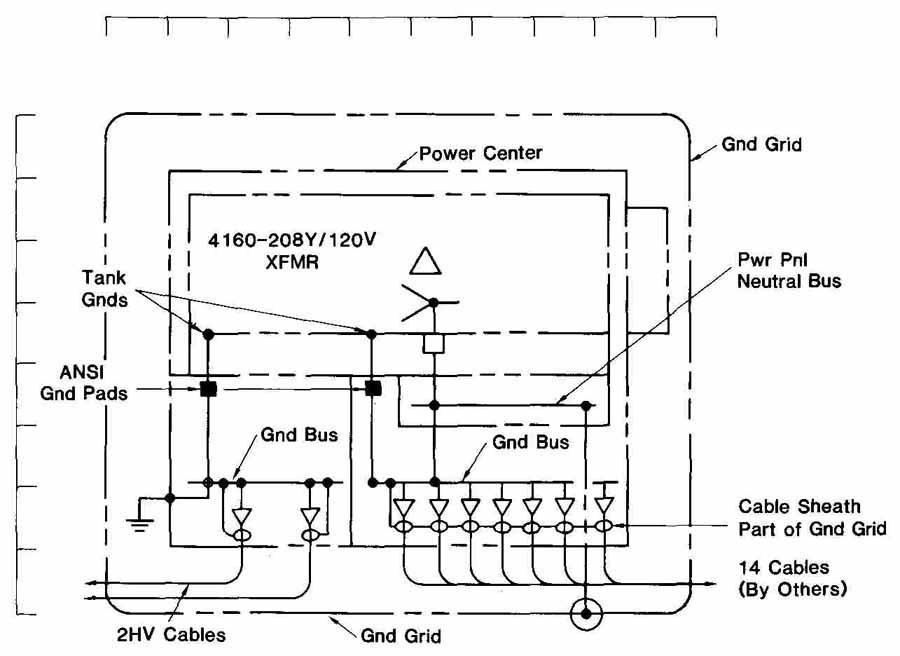
FIG. 21 (PROB. 1.) The grounding plan for a central receiver electric
power generating plant.
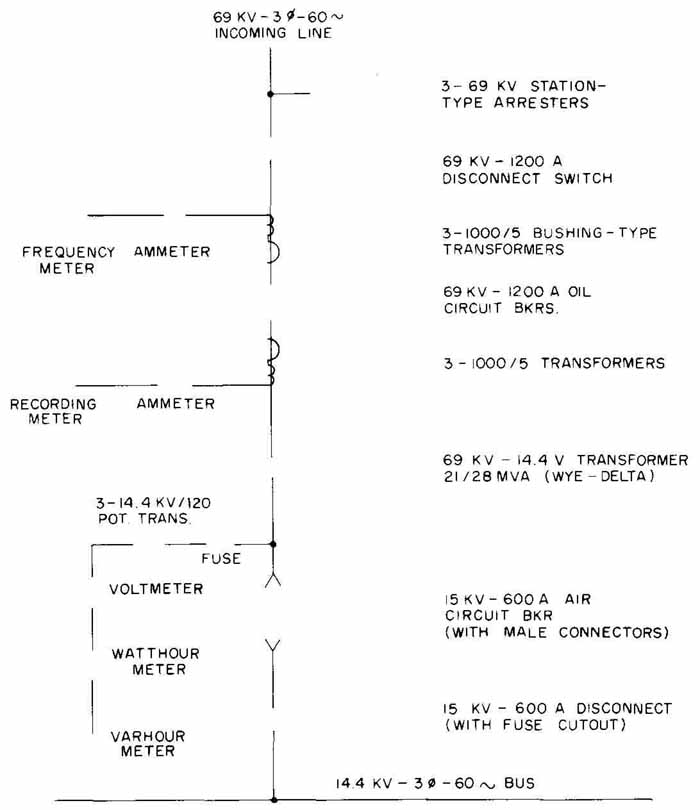
FIG. 22 (PROB. 3.) Incomplete one-line diagram of substation.
2. Starting at the top and going down, draw the symbols in the following list (a through j) on a vertical line (except where noted). Place identification of each symbol at the right of symbol on your one-line drawing.
a. 69-kv feeder line (horizontal line)
b. 1200-A 69-kv disconnect switch
c. 69-kv arresters (Show leading away on a horizontal line.)
d. 69-kv oil circuit breaker
e. 69-kv 14.4-kv 21 /28-MVA transformer, wye-delta
f. 15-kv 600-A air circuit breaker with male and female connectors
g. 5000-A 15-kv disconnect switch
h. 1000/5 current transformers (Show leading horizontally to ammeter and watthour meter.)
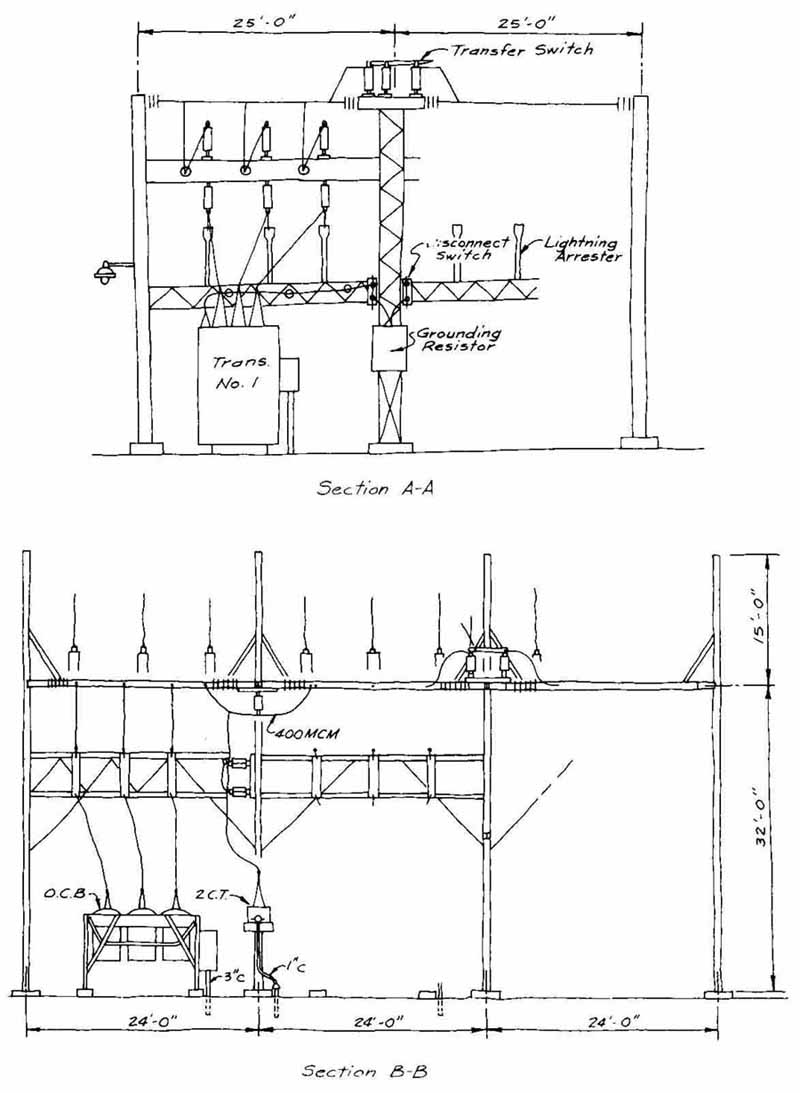
FIG. 23 (PROB. 4.) Sketches of substation
Section s. Section A-A (incomplete) through substation yard. Section B-B (incomplete) through substation yard.
i. 15-kv/120-v potential transformers (Show leading horizontally to volt meter.)
j. Ground
3. Complete the one-line diagram of the substation shown in FIG. 22 by adding the missing symbols. Place suitable identification to the right of each symbol, except for meters and fuse.
4. FIG. 23 shows two incomplete sketches of Section s through two different substations. The right-hand part in Section A-A, which contains trans former No. 2, is identical to the left-hand part shown. In Section B-B, the left-hand span is complete, the center span is complete — except for the circuit- breaker arrangement, which is identical to that shown at the left— and the right-hand span is identical to the center span. Make a mechanical drawing of each of the Section s, completing where necessary.
5. Redraw the floodlight detail shown in FIG. 24 to a size approximately two or three times that shown in the figure.
6. An installation has several motors and a control panel. Draw the following logic diagrams for part of this, as follows:
a. Control Switch Automatic and Safety must both be on. Motor No. 1 will start if the preceding is in the on-state or if the manual control switch is on. When motor runs, a yellow light goes on at location 2, control panel.
b. Motor No. I will stop if the Stop Control Switch or the Overload, or the Motor Trip is on. When the above happens, a green light goes on at location 2, control panel, and a buzzer sounds at the motor (MP
c. For the Auxiliary Motor to start, both the Manual Control Switch and the Safety must be on. Also the Visual indicator must be on. Use 8 X 11 paper for each drawing.
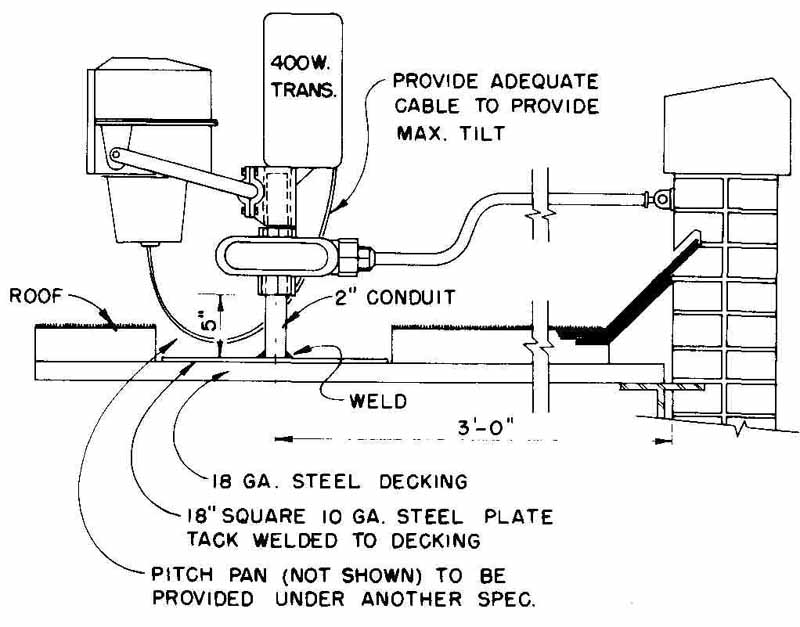
FIG. 24 (PROB. 5.) Detail of a 400-W floodlight. (Black & Veatch,
Consulting Engineers.)
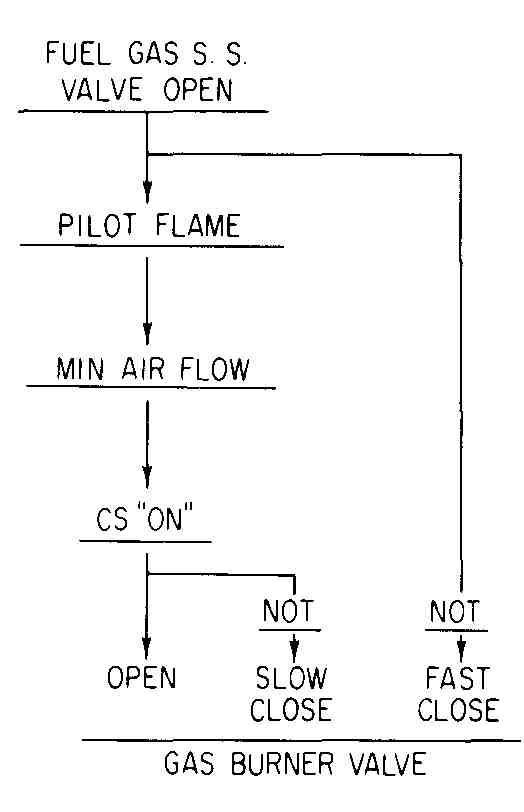
FIG. 25 (PROB. 7.) Functional diagram of a gas-burner valve.
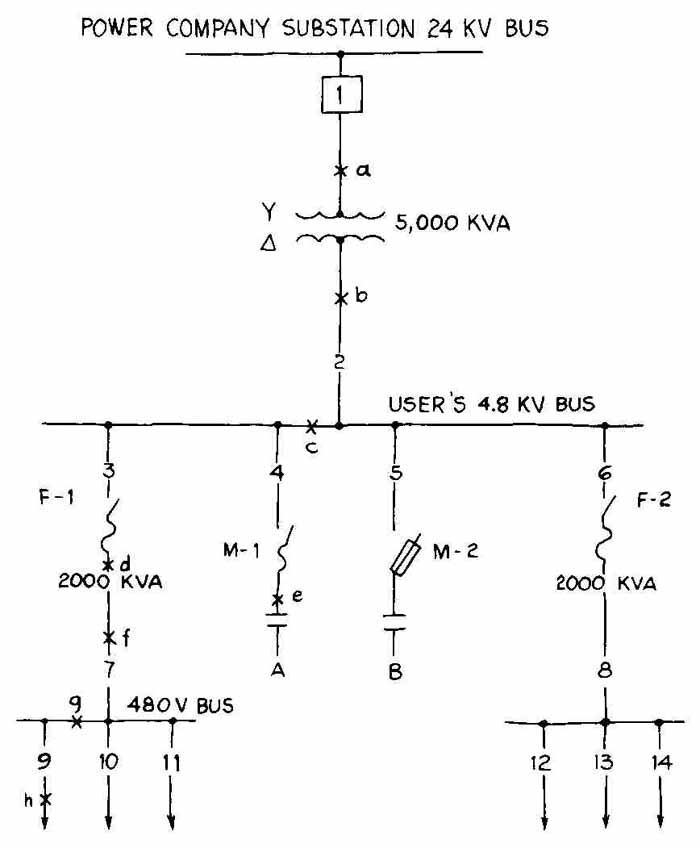
FIG. 26 (PROB. 8.) A diagram of electric power service to a large plant.
7. FIG. 25 shows a gas-burner valve functional diagram, which is a type of diagram used by some consulting engineers. Make a logic diagram for this valve and add it to the functional diagram shown.
a. For fast close of valve, Fuel Gas SS valve must be open.
b. For slow close of valve, CS on, Mm Air Flow, and Pilot Flame must all be in the On state.
c. For opening of Gas Burner Valve, the events of both a and b must all be in the On state. Note. Use NOT symbols for closing of the valve. When valve is closed, a green light shows at 33— 13. When open, a red light shows at 33—12. Use 8 X 11 or 11 X 17 paper for each drawing.
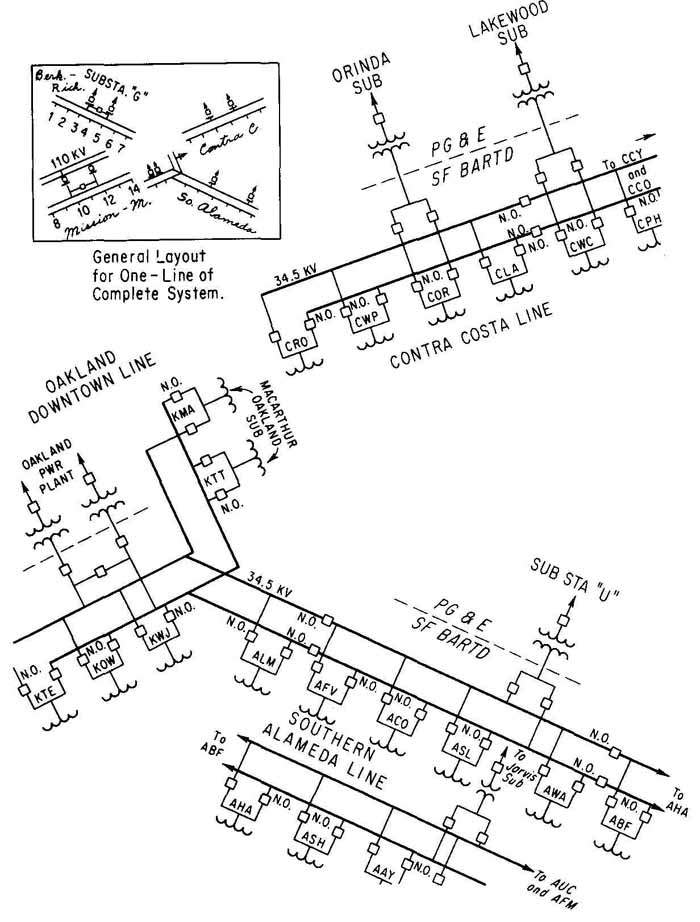
FIG. 27 (PROB. 9.) Partial one-line diagram of electrification of San
Francisco Bay Area Rapid Transit System. (Parsons-Brinckerhoff-Tudor-Bechtel,
Engineering Consultants.)
8. Draw a complete one-line diagram of the electric power distribution in an industrial plant, of which FIG. 26 is a diagrammatic sketch. Circuit breakers (oil) are at locations 1 through 14, and 500-hp motors are at A and B. Possible location of fault currents are at locations a through h. Use standard symbols throughout. Use 8 X 11 paper.
9. About 60 percent of the one-line diagram for the power distribution of the Bay Area Rapid Transit System (BART) is shown in FIG. 27. Make a complete one-line drawing of the system with a layout looking like that shown at the upper left. Stations on the Berkeley-Richmond line are (1) RRY, (2) RRI, (3) RCN, (4) RCP, (5) RNB, (6) RBE, and (7) RAS. Stations on the Mission Market line are (8) MDC, (9) MBP, (10) MGP, (11) MTF, (12) MSS, (13) MPS, and (14) BTW. Configurations of these two lines are similar to the Contra Costa line. Their locations show in the left part of the General Layout inset. Include all lettering. Use 11 X 17 or 12 X 18 paper.