AMAZON multi-meters discounts AMAZON oscilloscope discounts
cont. from part 1
Figures 25, 26, and 27 show another method of drawing a programmable controller control system. This system marks codes on relay cans. Essentially, it works by a revolving feeder initially loading seven relays in a magazine, which has been placed in the marker chute. The actuation of the initial start pushbutton (6PB) causes the advance solenoid (1 SOL) to advance the magazine and the advance-up solenoid (4SOL) to engage the magazine and move it seven positions. Then, the escapement solenoid (3SOL) and the in-place solenoid (2SOL) allow the feeder to load and set another relay in the magazine. After 17 relays have been loaded and advanced, the marker clutch (1 CLUTCH) is energized and starts marking the relays as they continue down the chute until all relays are marked.
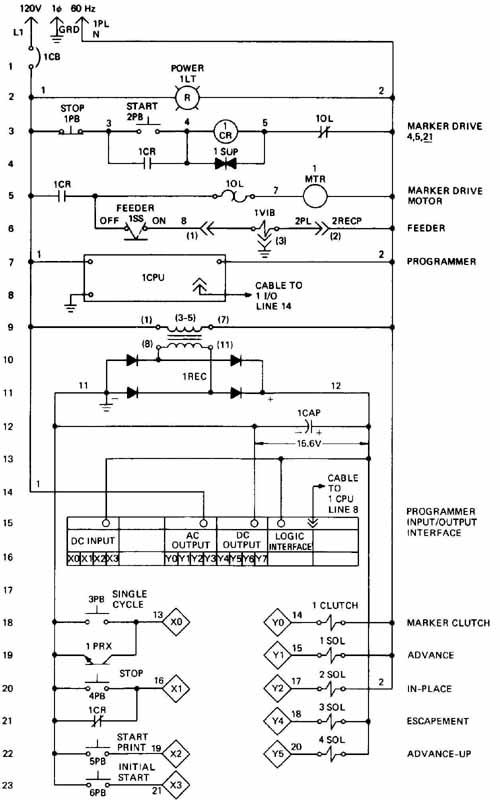
FIG. 25 Elementary diagram of a marking system using a programmable
controller.
FIG. 25 is basically a ladder-type elementary diagram, showing all controls exterior to the programmable controller, the power connections, and the connections to the programmable controller input module and from the programmable controller output modules. The inputs to the programmable controller are identified with an X and a number (e.g., X2 is Start Print Operation) and the outputs from the programmable controller with a Y and a number (e.g., Y 1 is an advance solenoid). The remainder of the circuit is self-explanatory.
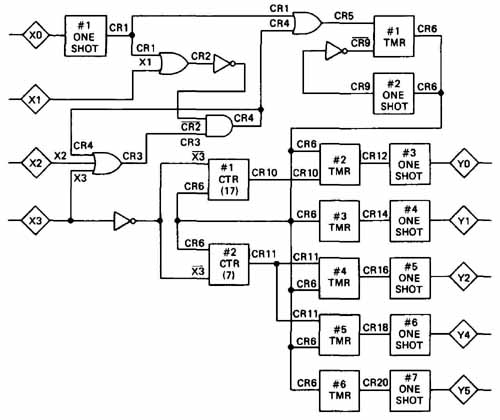
FIG. 26 Logic diagram of a marking system using a programmable controller.
FIG. 26 is a logic representation of the programmable controller logic used for the control system. Note the word representation — the circuit is not the actual logic circuit inside the programmable controller, but one engineer’s way of logically depicting how the control system should operate. It should be emphasized that this diagram could just as well have been done using relay symbols, as in our previous example. However, it is easier to optimize using logic-function symbols. The programmable controller inputs and outputs are the interface between this diagram and the preceding diagram. The control relay numbers are fictitious, but invaluable in helping the engineer depict the logic and enter the logic program into the programmable controller. The squares shown with titles in them are actual program subroutines designed to operate the control system. For example, the box containing the no. 1 counter is actually a program used for counting.
Figure 27 is the actual program that must be entered into the programmable controller for the no. 1 counter program. The program works in this way: the outputs of X3 are inverted (set and reset), CR6 (counts) set, the timer counted up to 17 counts, at which time its output (CR10) is entered in #2TMR.
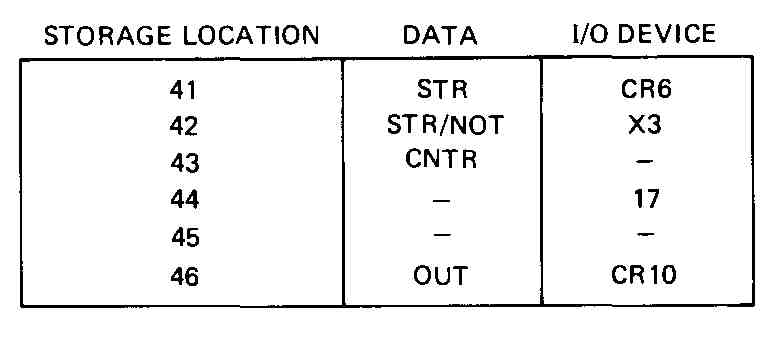
FIG. 27 One of the programs for the programmable controller used in
the marking system.
6 Computer Control
Computer control in industry has become a reality from the computerizing of the process itself to the computerizing of shipping and warehousing operations. With the invention of the microprocessor, and thus the microcomputer, many engineers are finding it more economical to use a computer for an industrial control job. Computers are generally used for jobs whose requirements include at least one of the following: many control points, data processing, fast scaning, or fast control speeds. For the most part, computers, unlike programmable controllers, cannot be placed in the harsh ambient conditions of many manufacturing facilities without providing some type of climatic correction (air conditioning, filtering, etc.).
As mentioned at the outset of this section, as industrial control circuits become more complex, the drawings required become simpler. Such is the case with computer control. Other than the individual computer internal drawings or software (programming) flowcharts, the drawings particularly required for a computer control system are a system flow diagram and interface drawings. Many other drawings may be used in computer control, such as layouts, wiring diagrams, stock lists, etc.; however, these drawings have been covered in previous sections and need not be described in detail here.
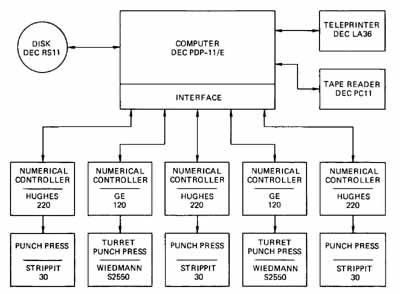
FIG. 28 Flow diagram of a computer-controlled numerical control system.
FIG. 28 shows a flow diagram of a computer numerical control (CNC) system. The concept of using digital computers to do numerical control work by replacing the tape readers is relatively new. In the system shown in this diagram, the computer was added; the existing tape readers were left to replace the computer in case of computer failure. The numerical control programs are read into the computer and stored on the disk. The teleprinter provides online access to the system and thus enables the operator to monitor or change pro grams. The computer interface is the electronics that lets the computer communicate with the machine controls, which in turn operate the numerically con trolled punch press. The arrangement of flow-type diagrams should be as simple as possible to clearly present the “big” picture of the overall system. Generally, control flow should go from left to right or top to bottom. Symbols should be simple (rectangles, circles, etc.) and should be identified.
Computer interfaces can be relatively simple or complex, custom-engineered or stock-manufactured items, depending on the computer, the control equipment, and the type of control desired. Thus, computer interface drawings can also be relatively simple or extremely complex. In fact, the authors have seen computer interface drawings over 10ft long, although they could probably have been made smaller. The interface drawings usually consist of logic diagrams and logic-module layouts similar to those found in Section 6. However, in complex interfaces, the individual logic circuits often are not shown on the logic diagram — it shows only the external connections, the module outline, and certain internal circuits represented by rectangles.
FIG. 29 is an interface diagram showing an address selector. An ad dress is a unique number that a control device is assigned by a designer so that it may receive and transmit its data from and to the computer. Inside the rectangle representing the address selector, there are a number of squares, each of which represents two or more logic functions. This address selector has the ability to select four addresses, namely, 764200, 764202, 764204, and 764206 (octal numbers). On the left-hand side of the diagram there are a number of circles with “B” inside, signifying the data bus. From the data bus, connections are run to the module card. The numbers associated with each bus connection tell where the bus is found in the module rack (e.g., B refers to the module in row B, column 8, with connection at pin S Adjacent to the address selector are its terminals, which are numbered. Inside the address-selector module and next to the terminals are alphanumeric combinations, which are acronyms for the computer bus functions (e.g., A is address line 17, CO is the data transfer mode). On the right side of the diagram there are connections with arrowheads going to other interface logic modules. For example, SELO selects address 764200 and, in combination with OUT HIGH or OUT LOW, selects the high or the low byte. The number/letter combination on the bottom of the address selector represents the location in the module layout (A and the manufacturer’s model number (Ml 05, Digital Equipment address selector). As can be seen, computer interfaces can become complicated; however, like all drawings, a clear and logical layout of the diagram will provide better readability and understanding.
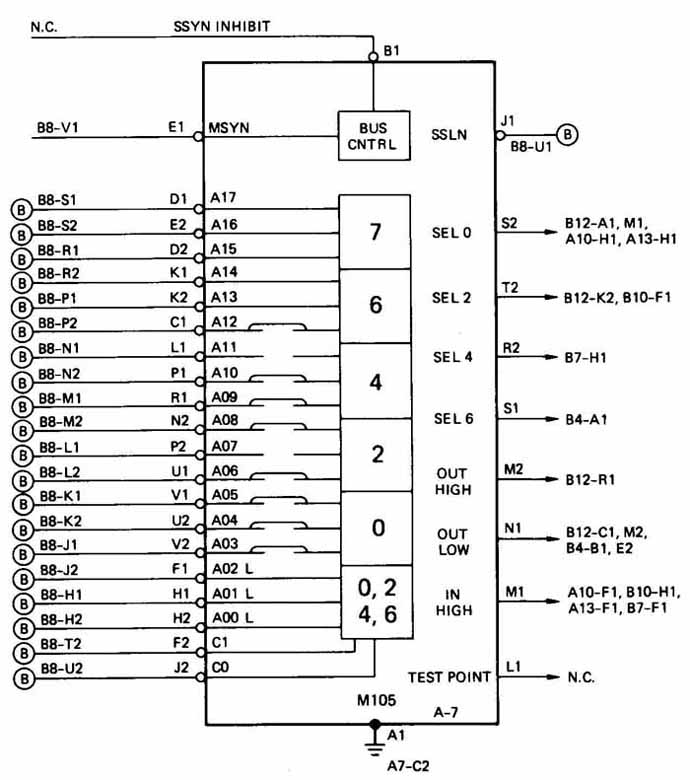
FIG. 29 Interface diagram of an address selector.
Computer control of industrial processes is definitely the future trend, and thus its associated drawings will continue to be with us in some form.
7 Robotics
As was discussed in Section 2, robotics is one of the main areas of computer-aided manufacturing ( CAM). In many areas of manufacturing, such as automobile, robots are performing an increasing number of repetitive chores which were once done by humans. Today, far from being an R2D2 or C3PO of Star Wars fame, robots are, in this purest definition from the Robot Institute of America, “a re-programmable, multifunction manipulator designed to move material, parts, tools or specialized devices through various programmed motions for the performance of a variety of tasks.”
Historically, one could say that the remote manipulator developed for handling radioactive materials in the 1940s is the predecessor of the modern robot. Robots have acknowledged productivity improvements in the areas of spot welding, tool loading, die casting operations, painting material handling of heavy or sharp objects, and repetitive tedious assembly-line operations.
Robots today consist of three major components: a manipulator, the controller, and the power supply. The manipulator is a series of mechanical link ages and joints which move in many directions to do the work required of a robot. Within the linkages, feedback devices are installed to sense the positions of these linkages and joints and transmit the positions back to the controller. These devices may be analog or digital and could include potentiometers, encoders, or limit switches. The controller has three basic functions: (1) to start and stop motion of the manipulator in the desired sequences and locations, (2) to store position and motion data in memory, and (3) to communicate to the “outside world.” FIG. 30 is a block diagram of a robot showing these major components and subcomponents. Robot controllers range from simple-step sequencers to stand-alone microcomputers and minicomputers. The function of the power supply is to provide the necessary power for the robot to do its job. This power supply can be hydraulic or electric or even a combination of both.
The arrangements of the mechanical manipulators are very diverse among robots, and so is the terminology used to describe the mechanical motions and components. An accepted way to describe robots is in terms of the coordinate systems in which they operate: (1) cylindrical, (2) spherical, and (3) jointed- spherical. A cylindrical coordinate robot has a vertical column mounted on a rotating base and a horizontal arm mounted on the vertical column. The column rotates; the arm moves in and out and up and down on the vertical column. In a jointed-spherical coordinate robot, the configuration is similar to a tank turret. The arm moves in and out, pivots in a vertical plane, and rotates in a horizontal plane about the base. The jointed-spherical system has a base, an upper arm, and a forearm, with an “elbow” joint connecting the forearm to the upper arm and a shoulder joint connecting the upper arm to the base. These movements, as you may check by using your body, Create movement that forms a sphere.
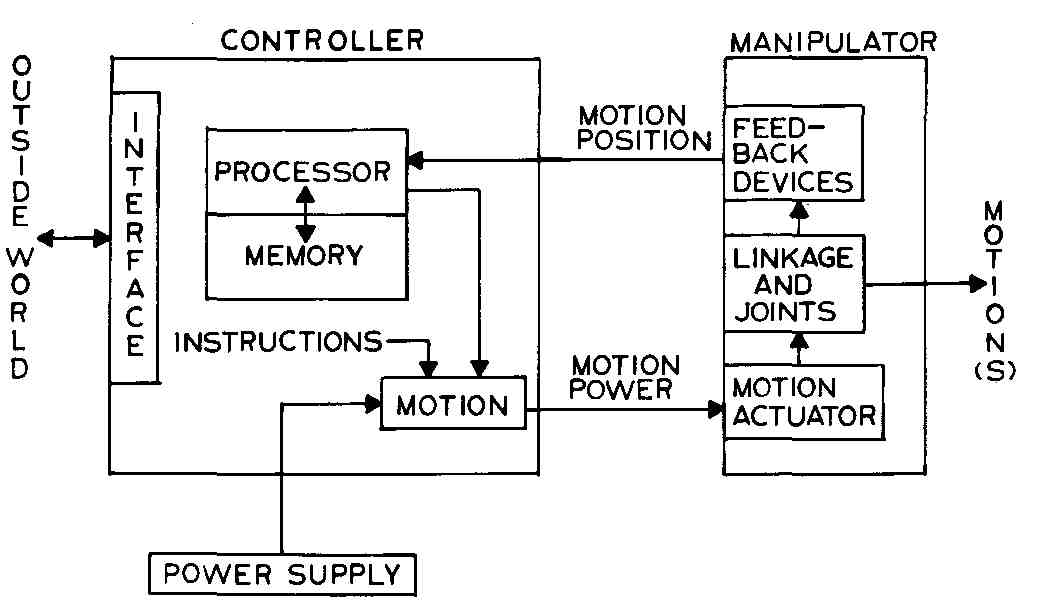
FIG. 30 Block diagram of a robot and its major components.
As mentioned in Section 2, the movements are also called degrees of freedom and are sometimes classified thus. All the coordinate systems mentioned previously have 3 degrees of freedom. If a wrist is added to the arm, it can provide three additional degrees of freedom; roll, rotation in a plane perpendicular to the end of the arm; pitch, rotation in a vertical plane through the arm; and yaw, rotation in a horizontal plane through the arm. Try these movements with your own wrist. Additional degrees of freedom may be added by putting the robot on tracks and moving it in and out or in a circle, drive signals. This schematic is typical of schematics associated with robots or for any other well-designed piece of electronic equipment. The inputs are on the left of the schematic and the outputs at the right. Note how the connector, which is mechanically in the same housing, is broken up and linked to preserve the input-output organization of the schematic. The input circuits are isolated from the amplifier by means of optoisolators. The output circuits are driven by Darlington amplifiers.
FIG. 31 is a photograph of a robot and, a controller. The robot is a jointed-spherical or jointed-arm robot having 5 degrees of freedom; trunk, shoulder, elbow, and wrist (two). It can carry 10 kg (22 lb) and can be used for welding, sandblasting, and materials handling. It is electrically powered and uses either a point-to-point or linear/circular interpolation positioning method.
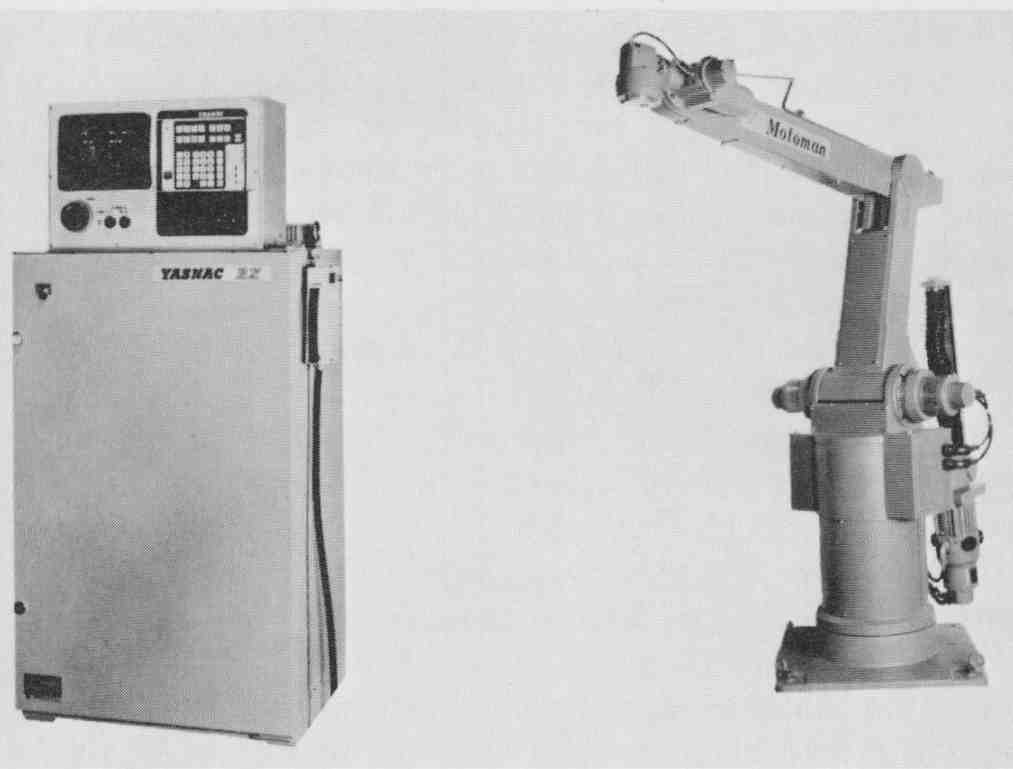
FIG. 31 Photograph of a 5-degree-of-freedom robot and its controller.
(Yaskawa Electric America, Inc.)
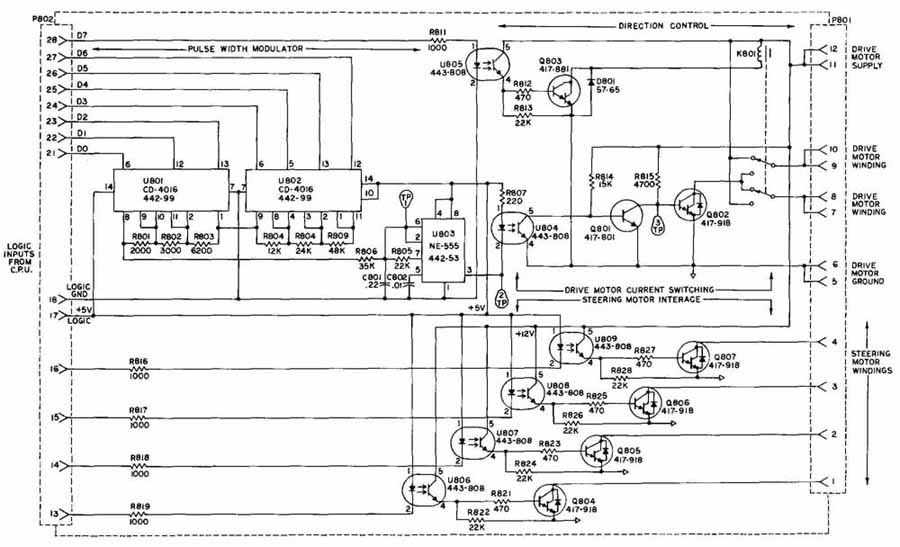
FIG. 32 is a schematic of the main drive PC board of a teaching robot.
This is one of many PC boards of this robot. This robot is designed to
teach people the fundamentals of robotics. This particular circuit takes
the logic signals from the on-board computer and converts them to the
actual motor.
The future looks extremely bright for robots. The ever-improving price! performance ratio of computing power plus the incorporation of the advanced electronic technology are making possible the creation of robots that are capable of acquiring knowledge rivaling that of humans for many tasks. These new capabilities include the tactile (touch) and visual senses, closed-loop control, offline programming, and on-screen simulation. These features will give human operators greater control over the robots and will give robots the ability to sense and adjust to their working environment. Presently most robots are used for heavy-duty tasks such as welding, painting, and materials handling. In the future, the greatest potential for the use of robots is in the area of assembly- type operation. It is projected by the Robot Institute of America that robot production could increase from 18,600 in 1983 to 78,000 in 1990 or 420% increase in 7 years. An increase of 32,000 jobs in robot manufacturing, supplies, engineers, and technicians and users is also projected.
8 Instrumentation
Many industrial control systems have associated instrumentation which either measures or controls, or does both to, the process variables. As the complexity of industrial processes has increased, the complexity of instruments and instrument systems has also increased; thus, the complexity of associated drawings has also increased.
Besides the usual drawings associated with most industrial control (see section introduction), there is one particular drawing unique to the instrumentation field, namely, the balloon drawing. The balloon drawing is associated with the Instrument Society of America Standard ISA-S5. l, titled “Instrumentation Symbols and Identification,” which has been adopted by ANSI as Y32.20- 1975. The balloon drawing is essentially an instrumentation flow or logic diagram. Unlike most of the drawings encountered previously in this text, the balloon drawing can involve mechanical (hydraulic, pneumatic) signals and supplies (gas, air, steam, etc.), as well as electrical signals (current, voltage) and service voltage). However, this text will cover primarily electrical and electro mechanical devices. The balloon is approximately a -in.-diameter circle, used to represent an instrument or instrument tagging. An instrument is defined as a device used directly or indirectly to measure or control, or do both to, a variable. The term includes control valves, relief valves, annunciators, pushbuttons, etc. Tagging is the process of identifying other instrument symbols with a code. FIG. 33 shows the balloon tag of an indicating voltmeter and will be used to demonstrate how identification is done in accordance with the ISA Standards.
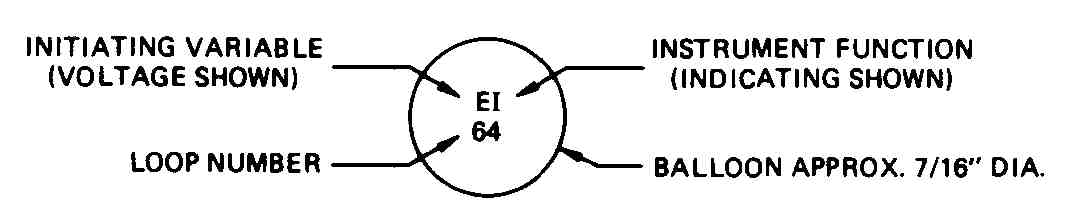
FIG. 33 Balloon diagram of an indecating voltage.
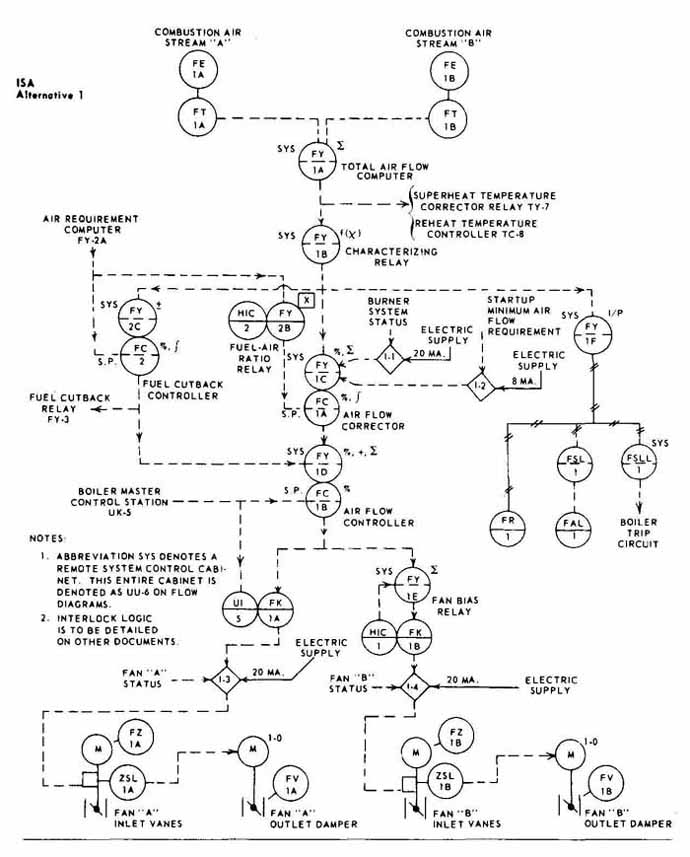
FIG. 34 Balloon drawing of a combustion air control system—alternate
1. (Instrument Society of America.)
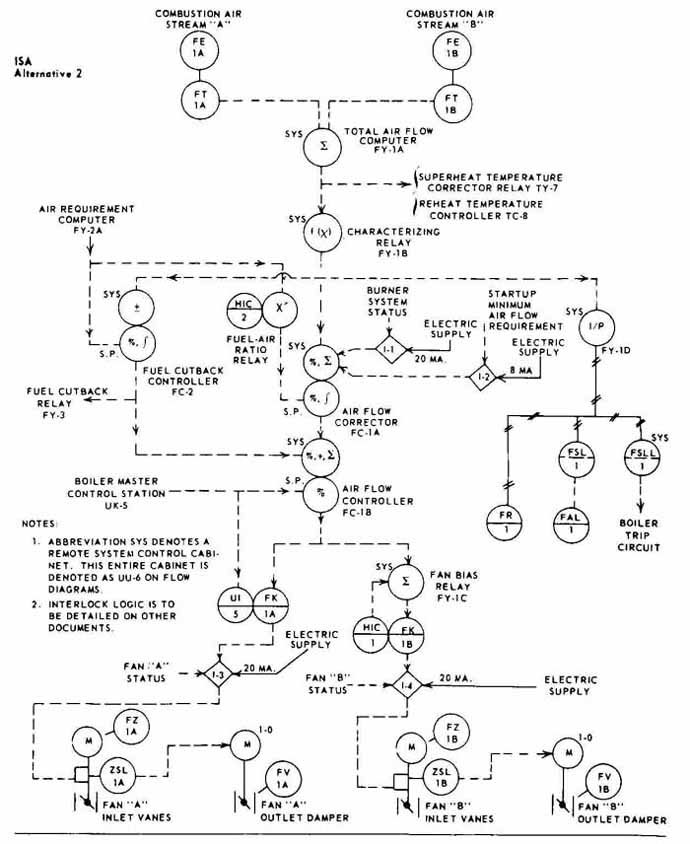
FIG. 35 Balloon drawing of a combustion air control system—alternate
2. (Instrument Society of America.)
The first letter represents the initiating or measured variable — in this case, voltage. The second letter represents the instrument function — in this case, indication. The numbers below the letters are the loop numbers. A loop is a combination of one or more interconnected instruments arranged to measure or control a process, or both. TABLE 2 lists the instrument-function code letters and the associated measured or controlled letter. The standard should be consulted before using these codes because there are numerous qualifiers. The way of identifying relays with function symbols is shown in TABLE 3.
TABLE 2 Meanings of Identification Letters
This table applies only to the functional identification of instruments. Numbers in table refer to notes in the standard.
FIG. 34 shows a partial balloon drawing of a combustion air control system using the ISA instrument functional identifiers. FIG. 35 shows an alternative and equally acceptable way of doing the same drawing using a combination of ISA instrument functional identifiers and functional designation symbols. Here, most of the balloons represent instruments with two instrument tags, shown at the bottom. The logic sequence of measuring to con trolling flows from top to bottom; however, this orientation is optional. Instruments are arranged in terms of logic flow and will not necessarily correspond to signal-correction sequence. Signal lines may enter the balloons at any angle, and symbols may be drawn at any orientation. However, drawing neatness and organization leads to better understanding. Electrical signals are shown as dashed lines, and pneumatic signals are shown as solid lines with double crosshatch (+ interspaced. Directional arrowheads are added to signal lines when clarification of the flow of intelligence is needed. Explanatory notes are sometimes added adjacent to the symbols in order to clarify the function of an instrument or process device.
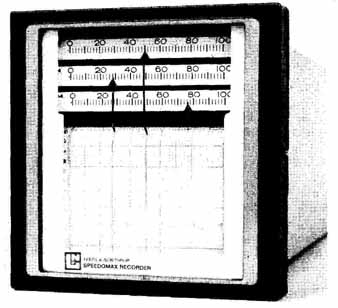
FIG. 36 Photograph of a three-pen recorder. ( Leeds and Northrup Company.)
Individual instruments, like instrumentation systems, have become exceedingly complex in recent years. Thus, the drawings associated with instruments have also become complex. Many instruments are a mixture of sophisticated electronics, electromagnetic devices, and motors. FIG. 36 shows a three-pen recorder, and FIG. 37 shows a block diagram of this recorder. This instrument may be used in measuring or measuring and controlling a variable, such as voltage or temperature. The basic parts of this recorder, as shown in the block diagram, are: (1) the measuring circuit (shown on the left side), (2) the detector-amplifier, (3) the pen or balancing motor, and (4) the display or re cording and indicating devices. The power input to the recorder is shown on the right side of the diagram.
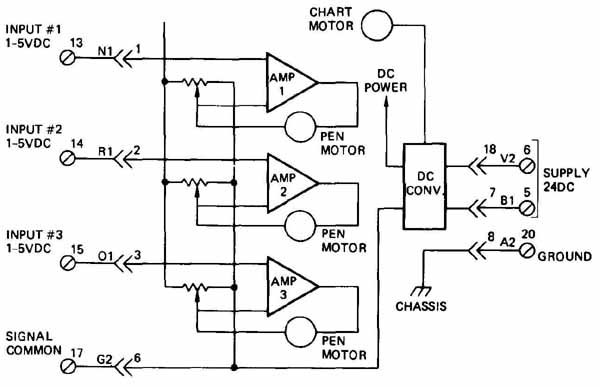
FIG. 37 Block diagram of a three-pen recorder. ( Leeds and Northrup
Company.)
The recorder works in the following manner. The measuring circuit for each input compares the incoming voltage signal to a known voltage, and the difference or error signal is detected and amplified by the amplifier. After amplification, the error signal is applied to the balancing motor, which, in turn, adjusts its position to nullify the error signal. Then, the position of the balancing or pen motor is indicated by an associated marker and recorded on the chart by an associated pen. This position is calibrated to the value of the variable measured.
FIG. 38 shows a schematic of one of the recorder’s three detector amplifiers. This amplifier is on a separate printed-circuit card, which is represented by the dashed lines. The detection and preliminary amplification is done in the integrated circuit ( and final amplification is done in the transistorized (Q and Q push-pull amplifier. The amplified error signal drives the balancing motor. Note the symbol for a ground in the lower right-hand side of the drawing.
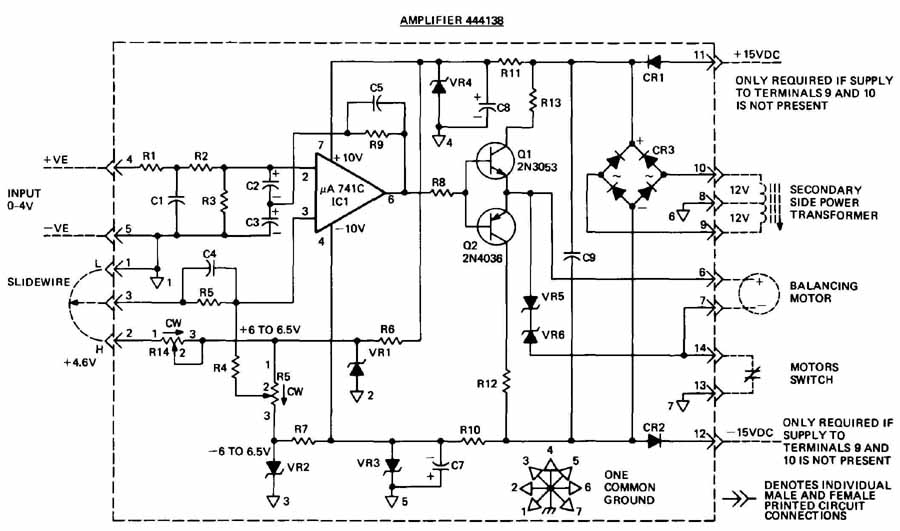
FIG. 38 Schematic of a recorder amplifier. ( Leeds and Northrup Company.)
FIG. 39 is a block diagram showing how this recorder might be used in a closed-loop control system in which completely automatic control is required. The system consists of (1) a detector to produce a dc voltage in proportion to the controlled variable, (2) a set-point unit to provide a control set point to which the process is to be controlled (and to compare the voltage from the detector with the set-point voltage to provide an error voltage), (3) a controller to provide an output related to the detector and error voltage, (4) a final control device, such as a valve drive motor or SCR, etc., and (5) a recorder to provide the process operator with information about how well the process is being controlled and to show trends with time of the process variable. The two- and three-pen recorders may be used to provide operator information from two or three control loops. When used with an associated input selector unit, each pen may be switched into any one of several different control loops selected by the process operator.
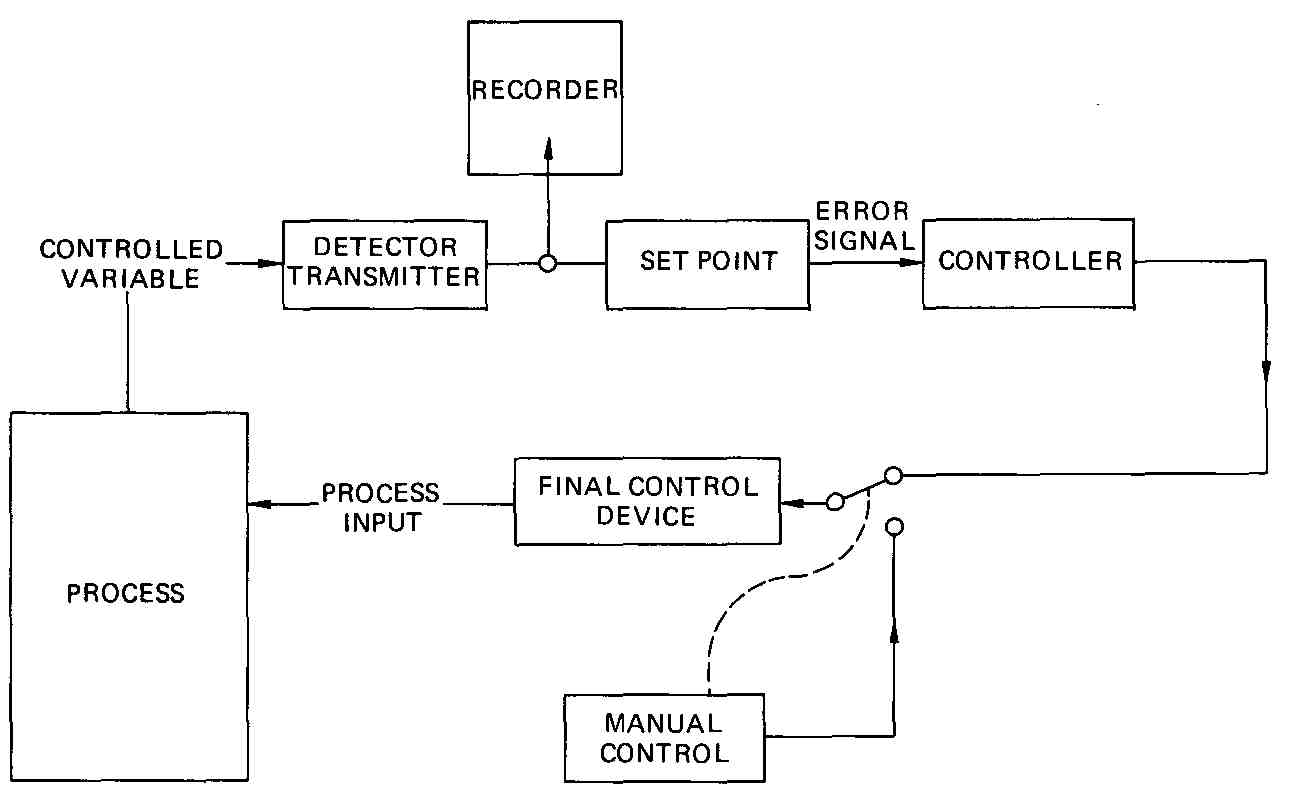
FIG. 39 Block diagram of an automatic control system. ( Leeds and Northrup
Company.)
9 Power Semiconductors
In the last two decades, the thyristor family of power semiconductors has taken and is taking over some of the control functions traditionally assigned to electromechanical devices. A thyristor is a semiconductor switch whose on-off action depends upon positive feedback. Basic functions being taken over include conversion (ac to dc), rectification (ac to dc), inversion (dc to ac), and cyclo-conversion (higher-frequency ac to lower-frequency ac). Thyristors are found in a wide range of controls, including solid-state relays, motor starters, motor-speed controllers, and furnace controllers. Thyristors offer a designer longer life, more precision, and faster control, and have no moving parts compared with electromechanical devices; however, thyristors are less efficient and consequently radiate more heat. But the future for the thyristor is extremely rosy: projections show them being used in applications ranging from common household appliances to large power-handling applications.
The best known and most representative of the thyristor family is the SCR or silicon controlled rectifier (sometimes called the semiconductor controlled rectifier). The SCR is a reverse blocking triode; it operates in only one direction. For operation during the entire cycle, two SCRs (back to back) are required. SCRs can be bought either separately for independent design or in prepackaged control systems.
The SCR controls used in industry are generally complex, with many components. The drawings encountered include: elementary layouts, wiring diagrams, stock lists, etc.; only the elementary diagram will be discussed in this section because of its differences. The only standards associated with SCR control drawings are the ANSI Standards on symbology and diagrams. The authors have found that most companies have unique ways of drawing SCR elementary control diagrams, but generally the elementary diagrams involving SCRs are hybrids of electronics schematics and electromechanical elementary diagrams.
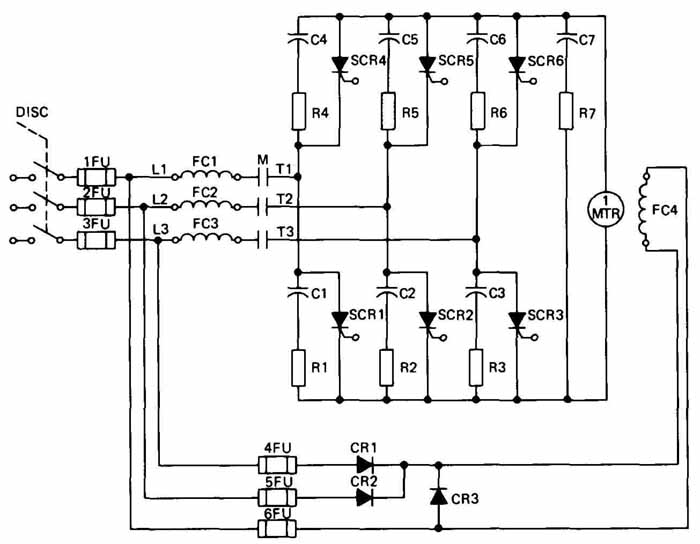
FIG. 40 Schematic of an SCR variable-speed drive for dc motors. (General
Electric Company.)
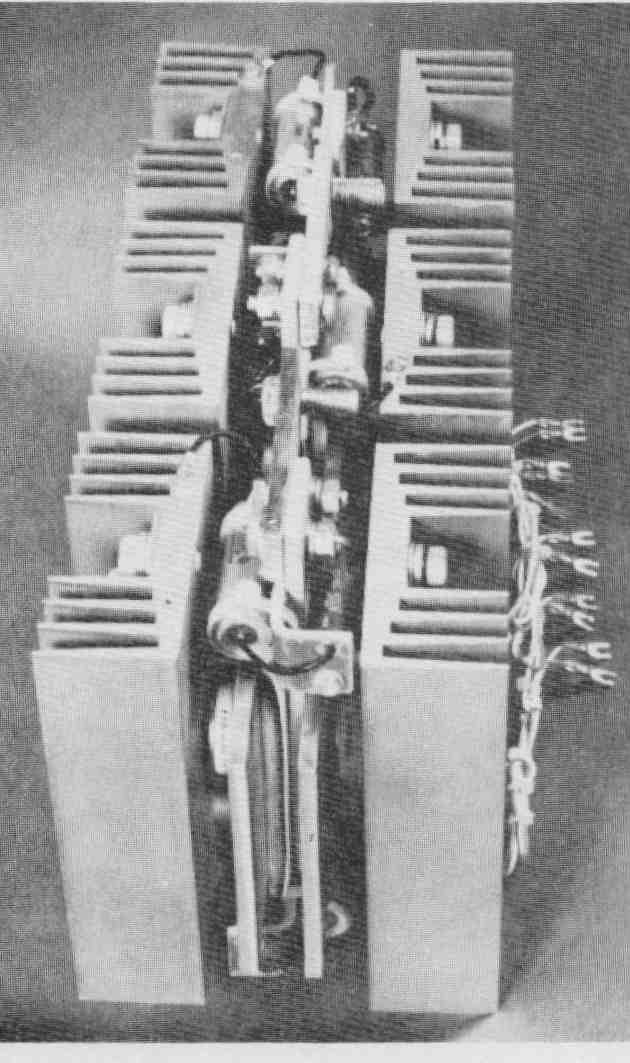
FIG. 41 Photograph of an SCR module. (General Electric Company.)
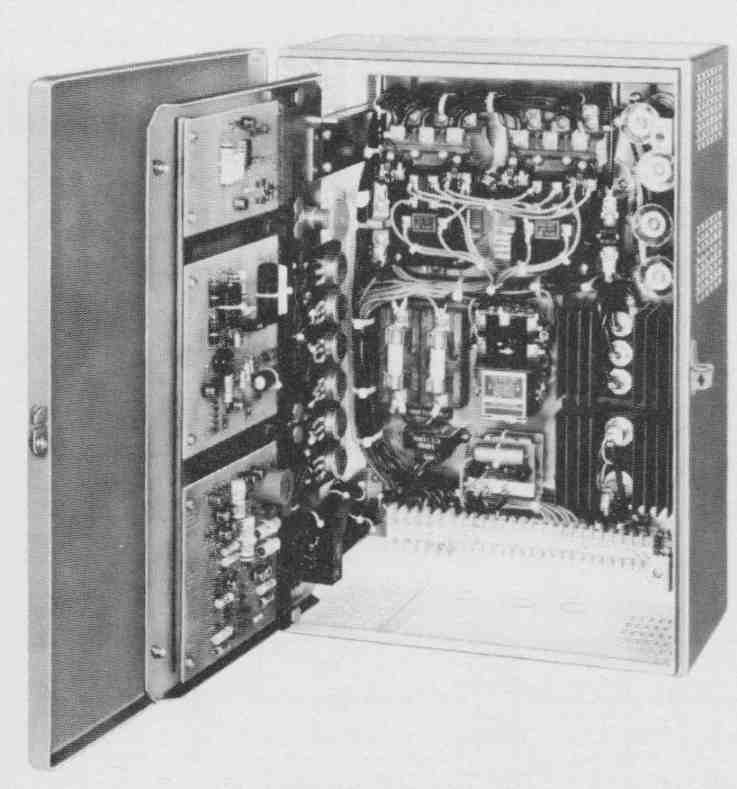
FIG. 42 Photograph of a dc SCR variable-speed drive. (Allen-Bradley
Company.)
Generally, dc motors are more adaptable to speed control than ac motors; however, most industrial plants do not have a dc source. Therefore, ac must be converted to dc. FIG. 40 is a partial schematic of a dc, SCR variable-speed drive. This type of unit has virtually replaced the shunt-field-rheostat and armature-circuit-resistance methods of speed control. This speed controller operates in the following manner: three-phase ac power enters the fuse, is fed through the line reactor (FC) and the line contactor (M), and enters the SCR power-conversion module, where six SCRs, working independently but in a predetermined sequence, rectify the ac to an adjustable dc voltage. The dc power is fed through a shunt resistor (RT) to the motor armature. The speed of the motor is proportional to the dc voltage applied. The dc voltage is adjusted by changing the positive trigger voltages applied to the gates of the SCRs, which changes their conduction period and, thus, the amount of dc voltage. The trigger circuit, power supply, and miscellaneous control and interface circuits are not shown here owing to their complexity.
This schematic of a speed controller has the power circuit going from left to right. Generally, in SCR control schematics, the power circuit goes in this direction or from top to bottom.
FIG. 41 shows an SCR power module for this speed controller. Note the large heat sinks to radiate and convect the heat generated by the SCRs. The capacitor and resistor that shunt each SCR may also be observed.
FIG. 42 shows a dc speed controller. The SCRs are in the lower right- hand corner of the enclosure. Note the printed circuitry through the entire enclosure and the motor contactors in the upper half of the enclosure.
SUMMARY
The drawings in this section have been selected from among thousands of control systems that are employed in United States industry today. These drawings represent many different industrial control systems, from basic motor control to more sophisticated computer control. Different types of control may stand alone, or they may be integrated with other types of control. Formats have been suggested for doing each type of control drawing. Several drawings that are common to almost all types of control work include an elementary or logic diagram, a panel layout, a parts list, and assembly drawings. Symbology varies from control type to control type, and it even varies within control type. (There are six sets of logic symbology in use today.) Some symbology used in this section in certain types of diagram is somewhat different in appearance from that in electrical diagrams earlier in the book. In some cases, the types of device used, such as relays and contacts, have their own special symbols. Sometimes new and special symbols, such as instrument balloon tags, have been introduced. Standard identification of components and the numbering of wires and terminal boards is extremely important in industrial control systems because of their complexity and vast number of components. And, finally, the trends of industrial controls have been presented, with their indications of more emphasis on programmable controllers and computers and less on electromechanical devices in the future.
QUESTIONS
1. Name five different drawings generally encountered in all types of control work.
2. Name four functions of motor control.
3. Describe the load circuit in a motor controller; in the control circuit.
4. What is the main difference between Figs. 2 and 4?
5. What is three-wire control? Two-wire control?
6. What is the difference between a contactor and a motor starter? Be tween a circuit breaker and a line switch?
7. Name two drawings strictly associated with motor control work.
8. What standards are generally used when doing electromechanical control drawings? Is the use of these standards mandatory?
9. For what words do the following abbreviations stand: PB, PS, CR, LS, OL, TR?
10. Why is a ladder diagram called a ladder diagram?
11. What is the purpose of a sequence of operations?
12. Describe a panel layout and its function; an interconnection diagram.
13. What information appears on the bill of materials (stock list)?
14. Name three types of motor and what they are used for.
15. Name four types of single-phase ac motor.
16. What is a winding connector diagram? What is its purpose?
17. What type of motor is called the “workhorse of industry”?
18. What are the two main differences between an elementary diagram (schematic) and a logic diagram?
19. Name the four basic components of a programmable controller.
20. Name the two types of symbology generally used in programmable controller elementary diagrams.
21. Name the control system requirements that practically dictate the use of a computer.
22. What are the major components of a robot?
23. What are the three coordinate system designs that a robot may be designed to work with?
24. What does “degrees of freedom” mean in description of a robot?
25. How should control flow be drawn on flow diagrams?
26. Describe the information that is found in a balloon tag.
27. What is the different aspect of balloon diagrams (not balloons) compared with any other type of drawing discussed in the text?
28. Which of the alternative methods of drawing balloon diagrams would you prefer, and why?
29. What is a thyristor? An SCR?
30. What basic functions do thyristors perform?
PROBLEMS
1. Redraw FIG. 2, using three-wire control with a Hands-Off-Auto (HOA) selector switch; a pressure (drop-in-pressure-to-operate) switch to be used in the automatic mode. Use 8 X 11 paper.
2. Redraw FIG. 2, using three-wire control with a HOA selector switch. A temperature (rise-in-temperature-to-operate) switch to be used in the automatic mode. Replace line switch and fuses with a circuit breaker. Use 8- X 11 paper.
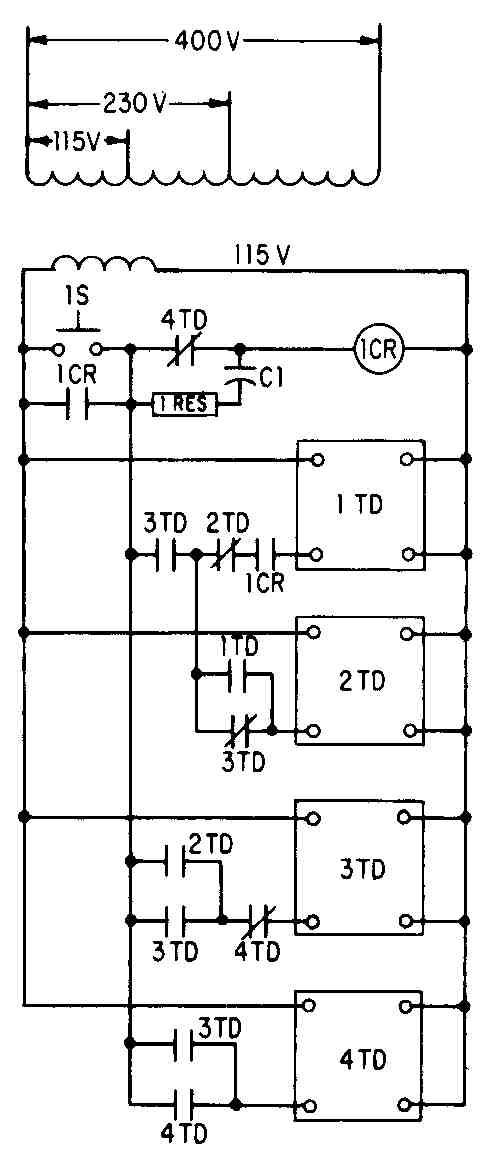
FIG. 43 (PROB. 3.) A ladder diagram for a sequence timer.
3. Make a drawing of the ladder diagram for the sequence timer shown in FIG. 43. The following changes might be in order: Add a stop pushbutton switch and selector switch to the appropriate part of the diagram. Add overload protection for the delay-period circuits and in other places you deem advisable. Use 8+ X 11 or 11 X 17 paper.
4. Adjustable-speed drives for dc motors are of four types: (a) motor generator, (2) electron tube, (3) magnetic amplifier, and (4) silicon-controlled rectifier. The tube and magnetic amplifier are obsolete. The motor generator is becoming obsolete. FIG. 44 shows in diagrammatic form the two types that are still popular. Draw these two diagrams and label all parts. (3- means 3-phase.) Use 8+ X 11 paper.
5. Draw the elementary diagram of an automatic control system that has three 10-hp pumps, which come on with pressure drops to 85, 72, and 60 psi, respectively. Use a HOA selector switch to provide a hand operation for each pump. Use 8+ X 11 or 11 X 17 paper.
6. In PROB. 5, we don’t want to run one pump more than another; therefore, we want to modify the circuit by installing a manually operated pump-sequence control switch. When it is in position 1, 2, or 3, the pump sequence would be 1-2-3, 2-3-1, or 3-1-2, respectively. Use a one-pole selector switch and three relays. Use 11 X 17 paper.
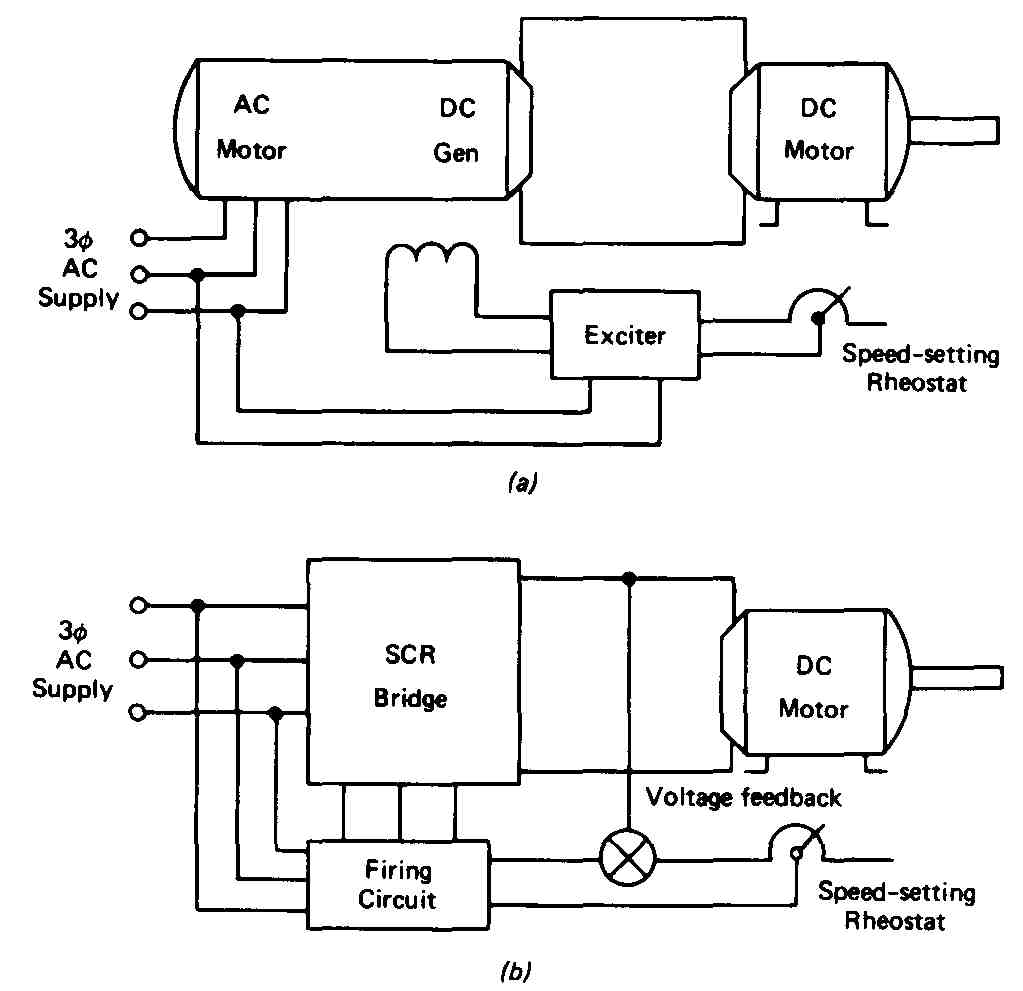
FIG. 44 (PROB. 4.) Two types of adjustable speed drive: (a) (b) controlled
rectifier drive.
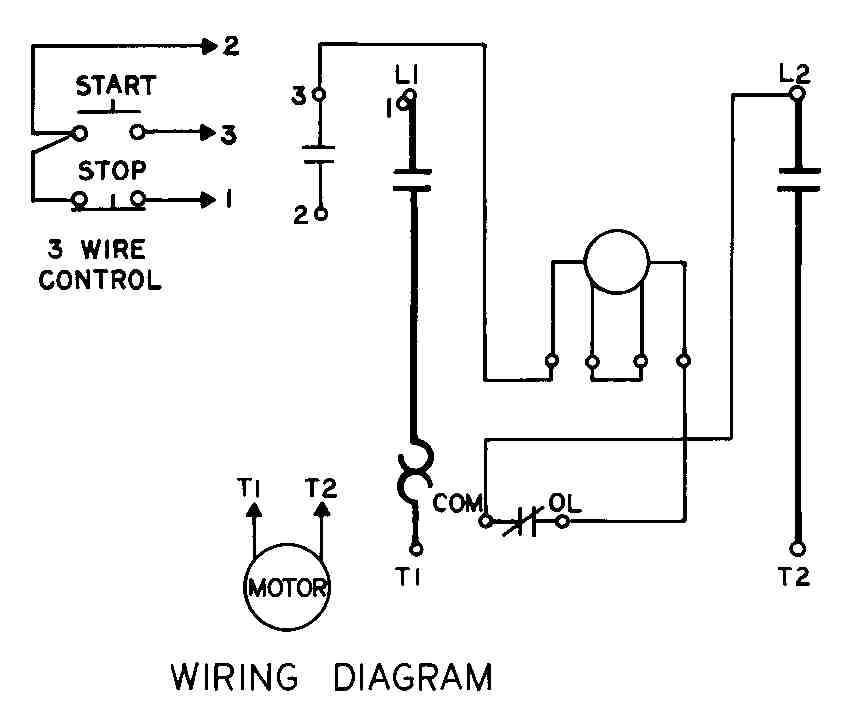
FIG. 45 (PROB. 7.) A wiring diagram of a single-phase motor and three-wire
control.
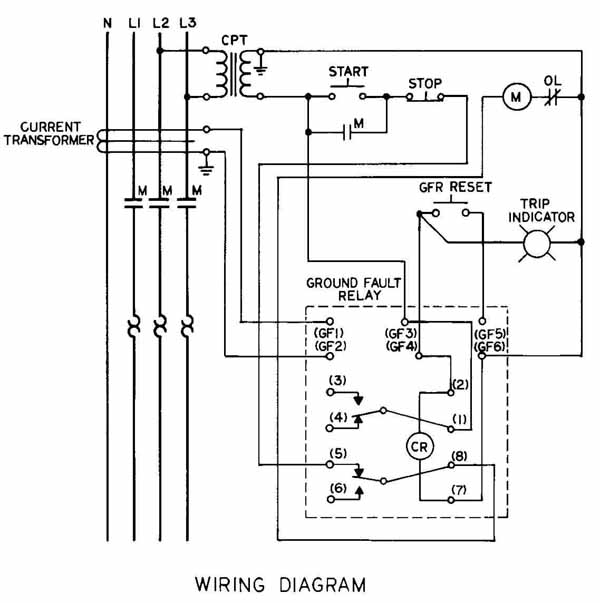 FIG. 46 (PROB. 8.) Wiring diagram of a motor circuit with a ground fault
interrupter.
FIG. 46 (PROB. 8.) Wiring diagram of a motor circuit with a ground fault
interrupter.
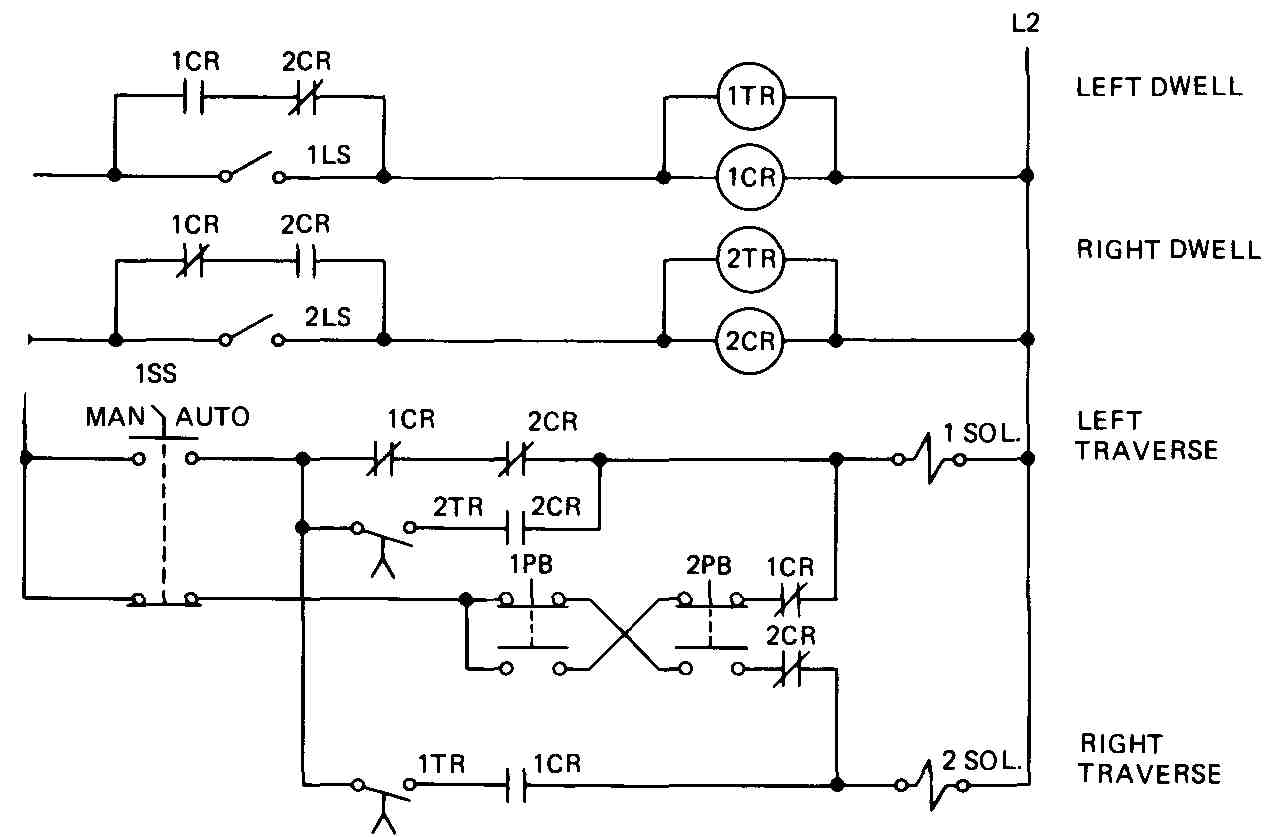
FIG. 47 (PROB. 9.) Ladder diagram.
7. FIG. 45 is the wiring diagram of a single-phase motor and three-wire control. Draw the elementary diagram.
8. FIG. 46 is a wiring diagram of a motor circuit with a ground fault interrupter. Draw the elementary diagram.
9. FIG. 47 is an example of a ladder diagram. Convert to a PC diagram as shown in Figs. 9-25 and 9-26.
10. Redraw FIG. 8 as a programmable-controller-based control system, using logic symbols, but not symbols for programs. Use Figs. 9-25 and 9-26 as a guide. Use 11 X 17 paper.
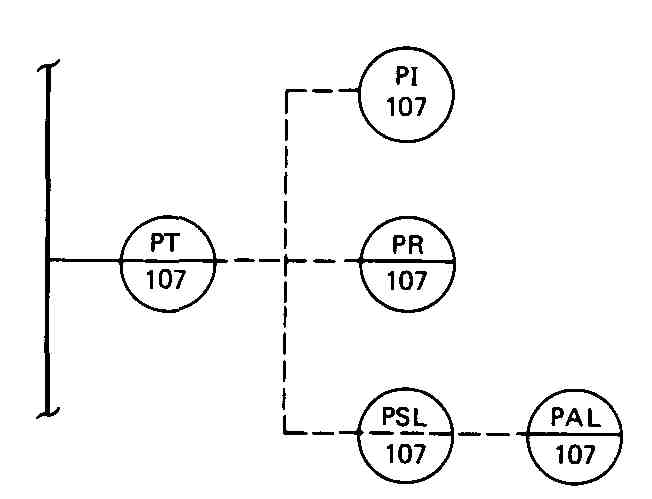
FIG. 48 (PROB. 13.) Balloon drawing.
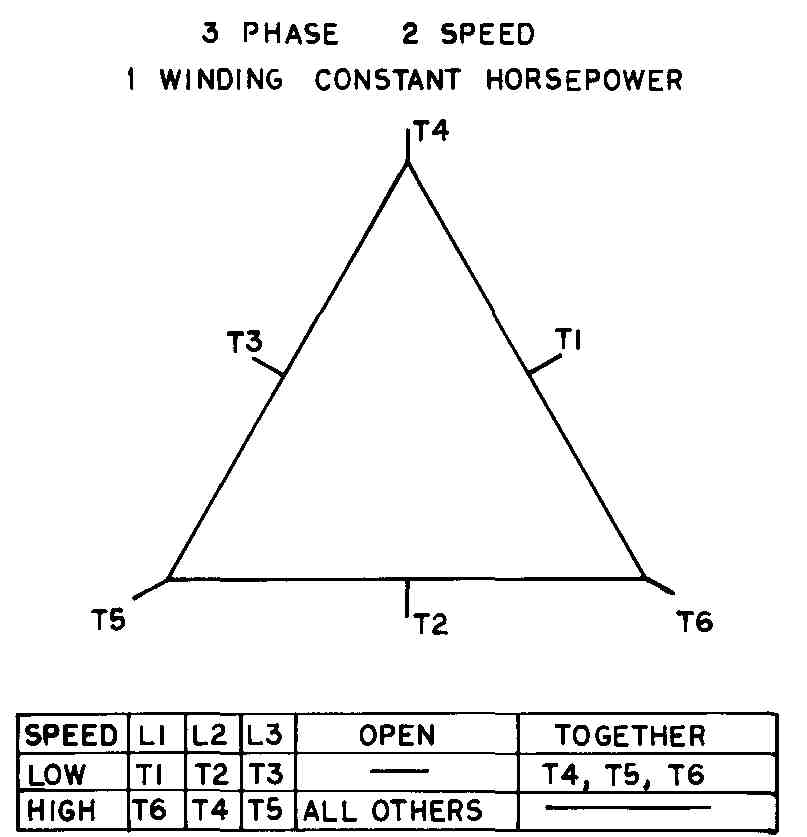
FIG. 49 (PROB. 14.) A connection diagram of three-phase, two-speed,
single- winding constant-horsepower motor.
11. A computer-based control system numerically controls a rotary drill press and a multiple-turret boring machine. In addition, the peripherals are a CRT terminal and a line printer. Draw the flow diagram, using FIG. 28 as a guide. Use 8 X 11 paper.
12. Draw a balloon tag of an indication ammeter on loop 101. A level alarm on loop 37.
13. FIG. 48 is a balloon drawing of a pressure transmitter feeding a pressure indicator, a pressure recorder, and a low-pressure switch, which in turn feeds a low-pressure alarm. Redraw this circuit. Use 8 X 11 paper.
14. FIG. 49 is a connection diagram of a three-phase, two-speed, one winding, constant-horsepower motor. Draw it and connect it for low-speed operation.