AMAZON multi-meters discounts AMAZON oscilloscope discounts
After studying this Section, you will be able to:
- Draw a block diagram, flow diagram, and a single line diagram.
- List the rules for a correctly drawn block, flow, and single line diagram.
Electronics systems are created from ideas. To advance these ideas, we must look at them on paper. Putting our thoughts on paper will help us organize ideas and check if our ideas are workable.
The arrangement of our ideas on paper is called a diagram. You are going to study three different types of diagrams in this Section.
BLOCK DIAGRAMS
Block diagrams are the most elementary of all the electronic drawings. These diagrams show only the essential units of the system. The units are normally represented by rectangular blocks. See . FIG. 1.
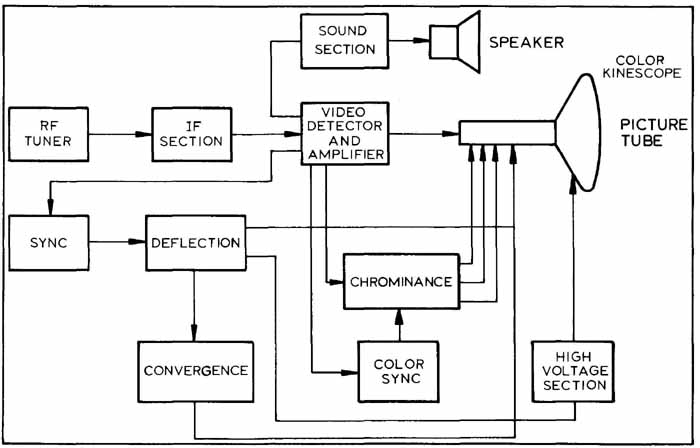
FIG. 1. An elementary block diagram of a basic color television receiver.
Note: all the units are shown as rectangles except for the speaker and
picture tube which are shown by symbol.
The blocks are tied together with lines. The path of the signal or energy may be shown by the lines or by arrows. Arrows show its direction. Block diagrams are used by computer programmers to aid in program development. This diagram will not show graphical symbols or reference designations.
A simplified block diagram of a television receiver would look like FIG. 2. Take a look at what the diagram accomplishes.
The engineer will sketch a block diagram of the television system. Using this diagram he/she will help decide what each of the units is supposed to do. The engineer established the following requirements: (As you look at FIG. 2, match each number with its unit.)
1. Low voltage power supply. This unit will convert the 120 volt alternating current to the appropriate direct current voltage levels.
2. An RF tuner. The radio-frequency (RE) tuner will need to select the desired channel and reject all others. It will be designed so that the signal will also be amplified.
3. An IF amplifier. The intermediate-frequency (IF) amplifier will provide additional amplification for the video and sound signals.
4. A video detector and amplifier. This section will set up the picture and demodulate (decode) the IF signal.
5. A sound section. This is where the audio amplification and power output takes place.
6. Synchronization section. This section will separate the horizontal and vertical pulses and route them to their respective deflection sections. It must keep the pulses synchronized as it transmits them.
7. Deflection section. The horizontal and vertical movement of the electron beam is provided by this unit.
8. High-voltage section. This section will set up the 1 5-20KV source which is necessary to develop a sharp, bright picture.
When the engineer has the basics for the television set figured out, he/she will assign the project to the drafter.
Block diagrams are used in sales literature, ser vice manuals, electronics catalogs, and operator manuals. Compared to other diagram types, the block diagram is understood better by persons un familiar with electronics. It shows the functional relationship of each stage in the simplest way.
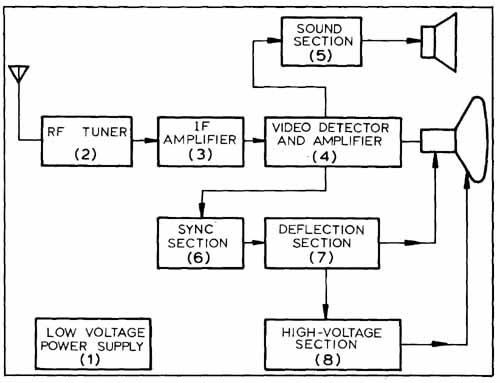
FIG. 2. A typical block diagram for a simple television receiver. Numbers
in the blocks will correspond to written explanation in the paragraph
on block diagrams.
RULES FOR DRAFTING BLOCK DIAGRAMS:
1. Blocks within a diagram should normally be the same size, FIG. 3.
2. The block containing the most information will establish the block size for the drawing, as shown in FIG. 3.
3. Inputs to the rectangles should come in the left side or top of the block. See FIGs. 4 and 5.
4. Outputs should go out the right side or bottom of the block, FIGs. 4 and 5.
5. Interconnection lines must run horizontally or vertically with all corners at 90 degrees, as shown in FIG. 6.
6. Lines running parallel to each other should be grouped with a larger space between every third line. This helps the reader’s eye follow each line. See FIG. 7.
7. Minimize crossed lines, FIG. 8.
8. Minimize jogged lines, FIG. 8.
9. If symbols are used, they should be from ANSI Y32-2, FIG. 9.
10. Lettering between elements of the system should either be done above, above and below, below, or in the line, FIG. 10.
Block diagrams and flow diagrams use basically the same rules. Let’s look at flow diagrams to see their similarities and differences.
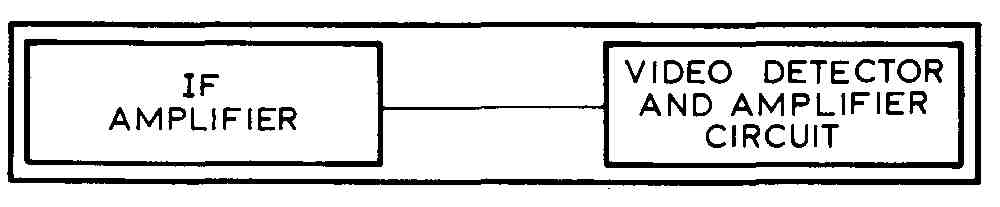
FIG. 3. One of eight examples of block diagrams and design rules. This
demonstrates rule 1 and 2.
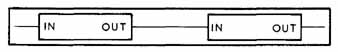
FIG. 4. An example of rule 3 and 4.
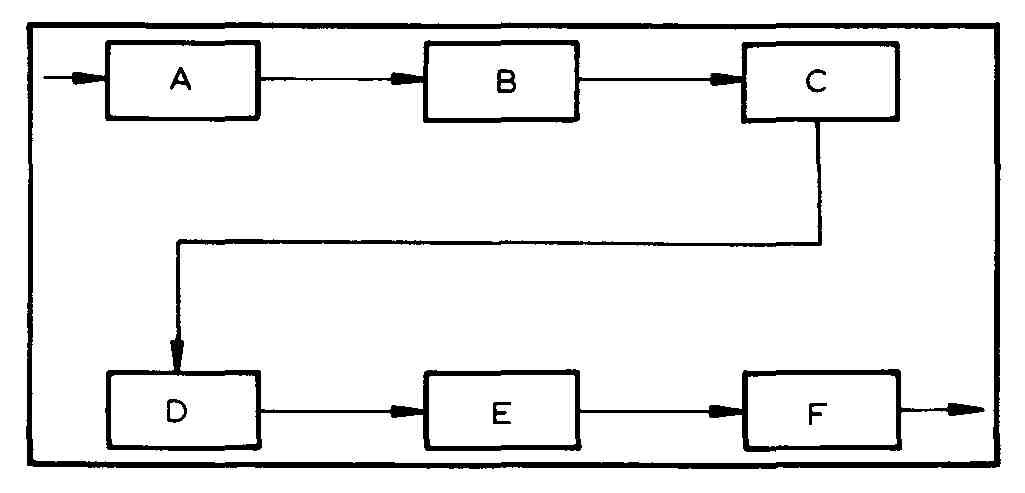
FIG. 5. An example of rule 3 and 4 when paper size dictates layout.
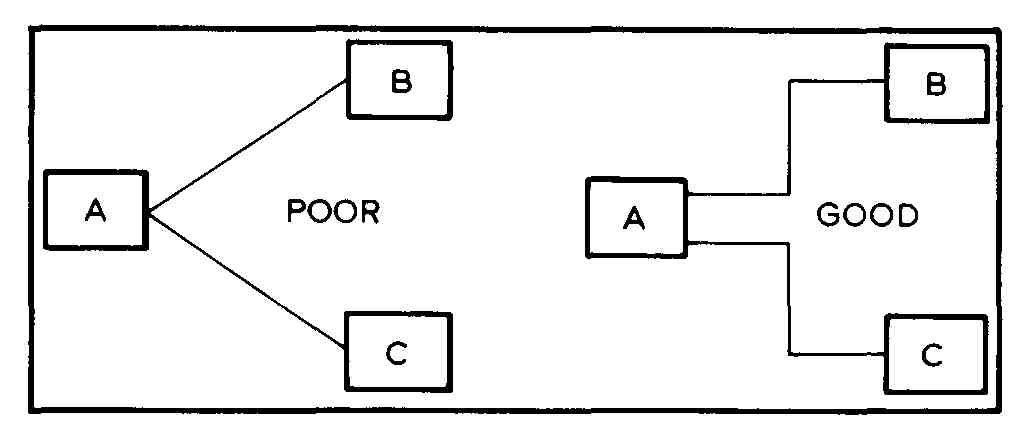
FIG. 6. An example of rule 5.
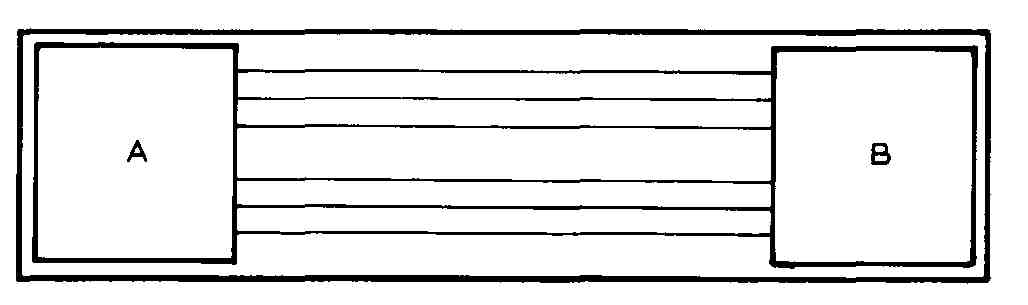
FIG. 7. An example of rule 6.
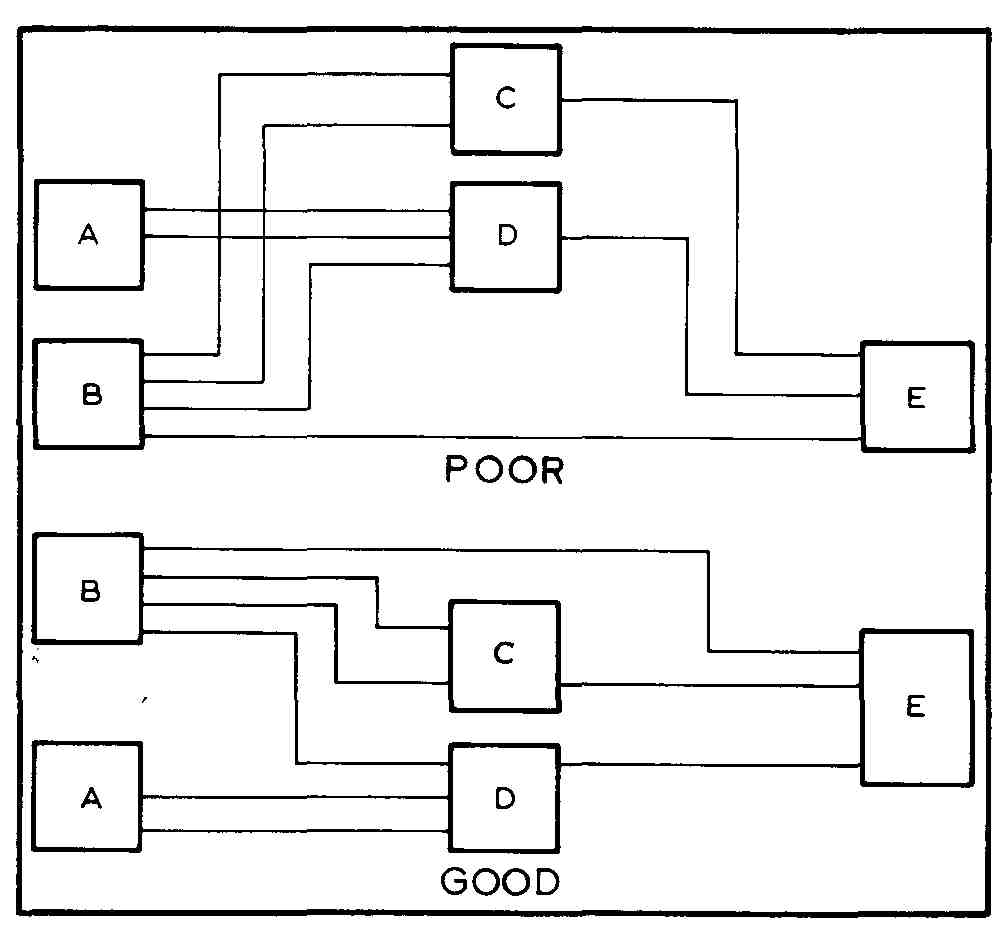
FIG. 8. An example of rule 7 and 8.
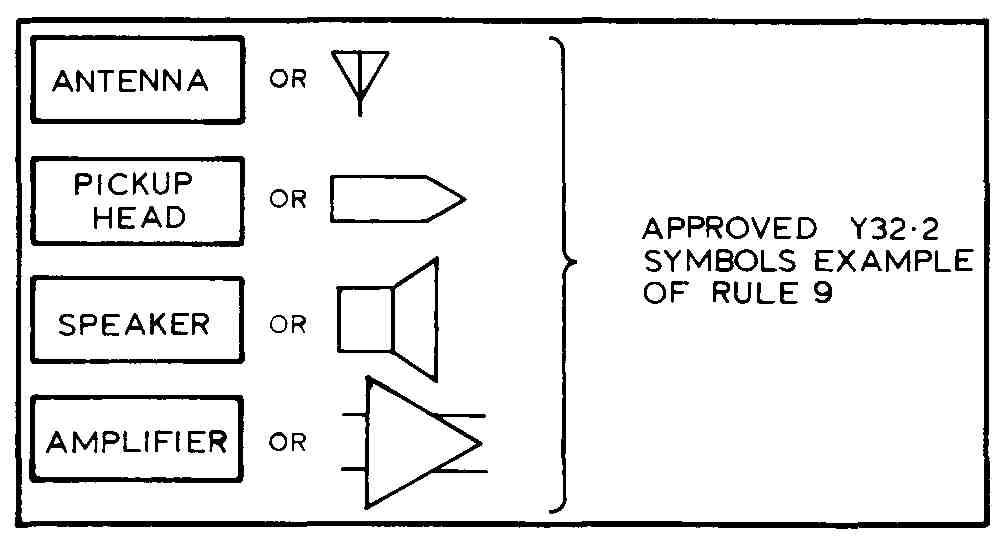
FIG. 9. An example of rule 9.
Flow diagrams are sometimes called flowcharts.
Flow diagrams show the sequence of events in a process or operation. The sequence will normally start at the top of the sheet and go down, FIG. 11. Sometimes the block diagram will go left to right horizontally. The logical steps of a computer program can be neatly shown by the flow diagram, FIG. 12. A program is coded by writing down the successive instructions that will cause the computer to perform logical operations.
RULES FOR DRAFTING FLOW DIAGRAMS
1. Sequence is from top to bottom.
2. Draw all boxes same width.
3. Box height can vary.
4. Use thick lines on boxes, medium lines on arrows.
5. For arrows going back to earlier steps, make side spacing at least 114 the width of a box.
6. Use hand lettering within guidelines.
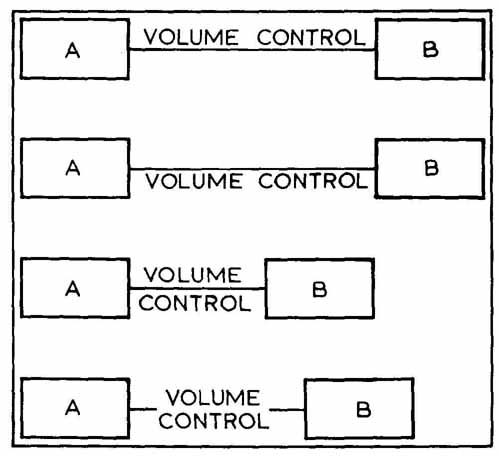
FIG. 10. An example of rule 10.
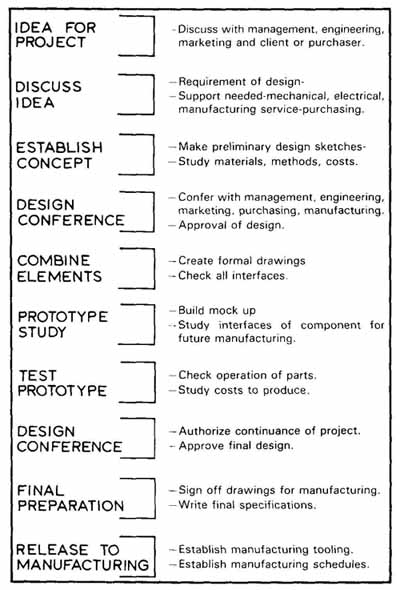
FIG. 11. A typical flow diagram has operation sequence from top to
bottom of page.
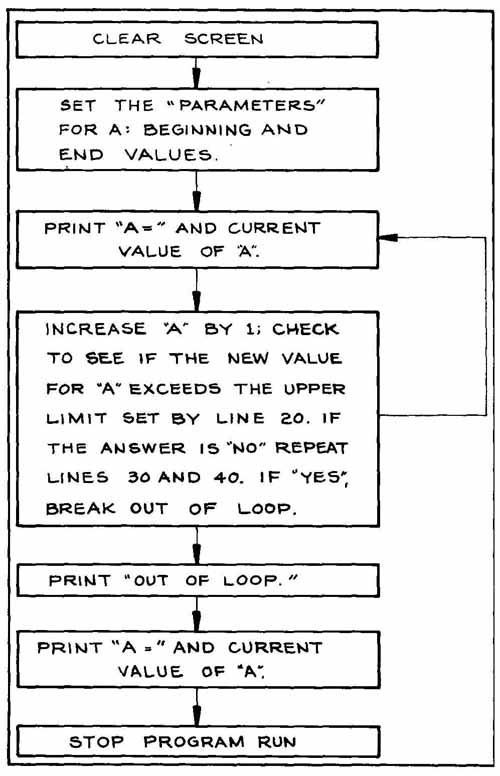
FIG. 12. A flow diagram of a for-next computer program.
SINGLE LINE DIAGRAMS
The next step following a block diagram, may be a single line diagram. See FIG. 13. This diagram is a form of schematic, which uses a single line to show component interconnections. The single line may represent many lines in the actual circuit. It will omit the detailed information shown on schematics or connection diagrams.
Single line diagrams will show:
1. The relationships between circuits.
2. Meters, instruments, switches, relays, and other power circuit devices.
3. Ratings of circuits which are essential to the overall understanding. Generator ratings for example; include: kilowatt capacity, power factors, voltage, cycles, revolutions per minute, and number of windings.
4. Neutral and ground connections.
5. Feeder circuits.
6. The gene layout of the circuit.
The layout will show only the information needed for clarity.
RULES FOR DRAFTING SINGLE LINE DIAGRAMS:
FIG. 13. A typical single line diagram.
1. Line thickness may vary, FIG. 13. Thick lines indicate primary information lines, medium lines indicate connection to power source.
2. Circles are used to portray meters, motors, instruments, and other rotary equipment.
3. Rectangles depict resistors, switches, components, and other major equipment parts.
The single line diagram is the closest drawing to the schematic. Schematic drawings will be covered in Section five. Section four will cover the individual electronic symbols and reference designations. We must have an understanding of the components, their symbols, and references before continuing our study.
REVIEW QUESTIONS:
1. What does a block diagram show?
2. How can we show the path and direction of the signal or energy?
3. List the major differences between a block and flow diagram.
4. List what a single line diagram shows.
5. Flow diagrams may also be called ______
6. Why is it important to put our ideas on paper?
7. List where block diagrams are used.
8. What does a flow diagram show?
9. What is the closest diagram to the schematic?
10. Why do we group lines with a larger space between every third line when they are running parallel?
11. The type of diagram least understood by those untrained in electronics is the:
a. Flow diagram.
b. Single line diagram.
c. Block diagram.
12. If arrows in a flow diagram go back to previous steps, make the spacing at the side of the chart at least _____ the width of a box.
13. Draw boxes in a flowchart with ___ (thicker, thinner) lines than for arrow lines.
PROBLEMS:
PROB. 1. Draw a block diagram from information given in FIG. 14. Follow the rules for a properly drawn block diagram.
PROB. 2. Draw a block diagram of FIG. 15. Follow the 10 rules.
PROB. 3. Draw a single line diagram of FIG. 16.
PROB. 4. Draw a flow diagram of FIG. 17.
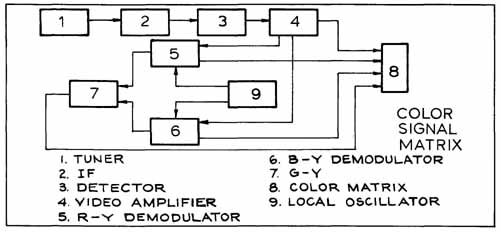
FIG. 14. Redraw this color television block diagram.
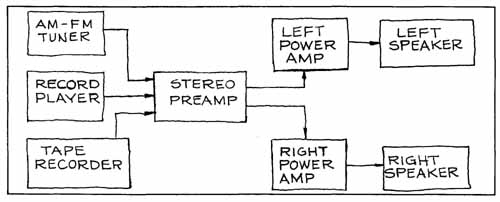
FIG. 15. Draw a block diagram from this sketch of a stereo system.
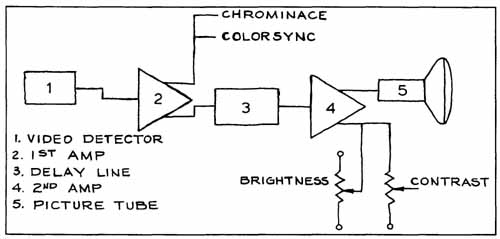
FIG. 16. Draw a single line diagram of this television amplifier system.
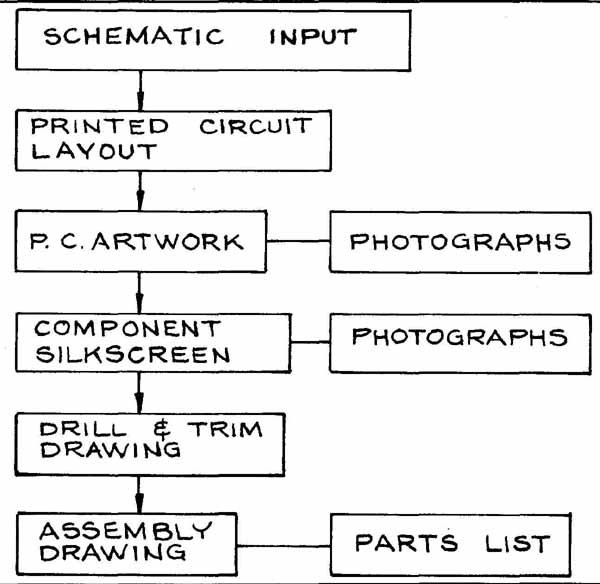
FIG. 17. Draw a flow diagram of a printed circuit board development.