AMAZON multi-meters discounts AMAZON oscilloscope discounts
Graphics
Graphics display a pictorial view of the process. They should be easy to configure (i.e., do not require programming), should have a menu-driven construction, and should be easy to change.
Password protection may be required on some graphics (e.g., PID tuning parameters and trip settings). When generating graphics, the system should display only what is needed.
AMAZON multi-meters discounts AMAZON oscilloscope discounts
Often, graphics are implemented so as to replace control panels. In such applications, the implementation requires that all panel functions be shown in the new system-that includes
• indicators, controllers, hand switches, lights, and mimic display (shown in the graphics),
• recorders (shown through the trending and reporting packages), and
• annunciators (shown through the alarm management package).
When implementing graphics, the designer should keep in mind that "information" is needed by the operator-not just data. When building graphics, the designer should present only the required information and avoid clutter. Congested displays are very hard to read and a rule of thumb is to leave at least a third of the display blank.
The mind of a human being translates incoming information in an analog way since most of the parameters encountered in daily life are analog-and not digital. Therefore, when showing the level in a tank, a bar graph (i.e., analog display) is more informative than, and as important as, the actual value of the level (i.e., digital value). Analog values should be displayed in engineering units beside bar graphs, and the display terminology should be the same throughout. Error messages should be clear (e.g., not "entry error," but "entry error: allowable range is between 40 to 70%"). In addition, colors will not improve a badly formatted screen. If possible, start with a black-and-white screen, generate a legible layout, and then proceed with colors. Color blindness should be considered, that is, do not rely on color alone to indicate status or functions-add labels, change shapes, and so on.
Color provides more information in less space and helps improve visualization-for example by reducing the response time by drawing the operator's attention to a specific area. When using colors, the system designer should ensure that the meaning of colors is consistent throughout the facility, that large background areas have a neutral color (black or gray), and that no more than seven to ten colors are used.
If text is to be shown, it is generally limited to labels or brief messages. Text color should have a contrasting background to facilitate reading, i.e., dark text should have a light background and vice versa. Blinking messages are hard to read-blinking the background is a better option.
The system designer should label all the equipment with their corresponding tag numbers and mimic flow lines to show process flow.
Using the proper sequence in graphic displays facilitates the operator's reactions to process events. Typically, the first graphic is an index of all the graphics in the system, the second is an overview of the whole plant, the following graphics are more detailed, and so on. In some cases, a control loop overview is added. This graphic would group a large number (100 to 200) of important control functions showing only deviations from set point. It is recommended that one or more graphics be used to indicate PES health status. Such graphics take their information from various parts of the control system and its components.
When critical action keys are embedded in the graphics, they should always be in the same location, regardless of the displayed graphic. This minimizes the chance of operator error.
Alarms
Alarms display the process malfunctions. They should be date- and time-stamped when they occur (printing every alarm on occurrence), when they are acknowledged, and when they go back to normal. The last two (or sometimes more) unacknowledged alarms should be displayed at the bottom of any graphic display. Graphics and alarms should be integrated functionally, that is, graphic symbols are subject to standard alarm sequencing through the changing of color and/or shape.
Alarm occurrence, operator acknowledgement of the alarm condition, and the return to normal status should be reported to the screen (i.e., to the operator). The operator should be able to monitor the latest alarm activities from any screen he or she is looking at, and when an alarm occurs, the operator should be made aware of it immediately. As a result of an alarm condition, the operator should be able to switch the screen displays directly to the appropriate location to take corrective action. The switching should be made with a minimum number of key strokes or mouse clicks.
In some cases, alarms are triggered, not just on reaching a set point, but also when the rate of change of a process variable is exceeding an expected rate of change, even though the set point has not been reached yet. This allows the operator to take a corrective action before the actual alarm set point is reached.
At least three alarm priorities should be selectable for all alarm points. For example, red (or 1) should be for high priority, yellow (or 2) for medium, and white (or 3) for low priorities. On system startup, priorities 2 and 3 would be disabled to limit the display of abnormal conditions and to allow the operator to concentrate on the activities at hand. When startup is completed, all priorities can be reactivated. In addition, alarms should be grouped in "areas." This allows all alarms in an area to be isolated if this area is shut down, thus again avoiding an unnecessary flood of useless alarms into the control room. When this area is back in service, its alarms are reactivated.
Trends
Online trending displays the historical data. It should be available as part of the graphic display, and historical data should be accessible from disk and displayed with selectable time spans.
A high-end trending package has the capability of:
• displaying either a single trend or multiple trends on one full screen view,
• embedding trends into graphics,
• placing analog and discrete values on the same display,
• displaying any value (e.g., variable inputs, set points, output values, discrete on/off statuses),
• changing the trend's color when it goes into alarm,
• using different colors to display different trended points,
• sampling points at small time intervals (this is dependent on the controller's scan time),
• changing the measured span and time span of individual points or of a whole group,
• zooming, through a cursor, to the lowest time increment (i.e., the sampling time), and
• storing large amounts of historical data for future retrieval (this is dependent on the system's memory and sometimes removable media is required for archiving large amounts of data).
When implementing trends and after deciding which points will be trended, the system designer should ensure that trend layouts, labeling, and color use are consistent throughout the system.
Reports
Reports may be triggered by events or by time and incorporate online (incoming) data or historical data (from disk). Reports should be simple to create.
Special Design Considerations
When implementing PESs, in addition to selecting the best system for the job, users must assess many other issues such as safety and system failure, software, and environmental conditions.
Safety and System Failure
Safety is a moral and legal issue. It is the system designer's responsibility to ensure that control systems are applied safely. Therefore, potentially hazardous conditions require reliable emergency circuits that are designed for such applications. It is difficult to anticipate the failure mode of a PES because of the nature of its components. Using a master safety relay and/or external watchdog may improve the PES's safety.
The master safety relay ensures instant control over the system's outputs. When deenergized, the relay cuts the power supply to the output modules with no effect on the remaining components. That is, the monitoring of process conditions remains in operation. Typically, the relay is deenergized by a re-setable shutdown function (e.g., push/pull emergency shutdown pushbutton).
The external watchdog consists of a check function in the program that operates with an external timing function. The check function is a software exercise in which statuses are changing with each scan to ensure that the PES memory is not stuck in a logic state. The outside timer is adjusted to a time that corresponds to three or four scans of the program. If within these scans the timer does not reset, a set of contacts will open, deenergizing the master safety relay. Major PES vendors have a "standard design" for implementing external watchdogs.
In a PES, the inputs and outputs are the most vulnerable to damage because they are exposed to external influences. Typically, the failure mode of input modules cannot be ensured since they are solid-state devices. The designer may need to check if the failure of an input circuit causes a false input into the control system and therefore results in various outputs responding accordingly. Outputs, which are also normally solid-state devices, tend to fail shorted, which causes the external load to be continuously energized. Typically, the failure mode of loads (such as control valves) that are connected to the output of the control system should be fail-safe in the deenergized position. That is, on loss of signal or power, a valve would go to a position that is deemed safe from a process point of view. Both inputs and outputs are affected by transient voltage. Transient voltages are normally of very short duration, and if they exceed the specified peak voltage, sensitive electronics will be damaged. For example, the discrete solid-state output would no longer be capable of turning to the Off mode and would be stuck in the On mode.
Control units, which are comprised of elements such as the processor and memory boards, may be affected and even destroyed by electromagnetic or electrostatic interference. This can cause a total shutdown, or worse, a partially defective program with the system still in operation.
PES components may also pick up electric noise from their surroundings, causing erratic mal functions (generally, a hard problem to diagnose).
Failure of the power supply can be easily assessed. However, it is important to assess the effect of the sudden reactivation of power. Would this cause erratic action at the output modules? The different components of a control system may functionally fail if they are removed or short-circuited while the system is powered. That's why some systems require the power to be off before devices are connected to or removed from them.
PESs in critical applications-that is, protecting safety and health-must be installed in compliance both with the regulations and codes in effect at the site (e.g., OSHA, ISA, NFPA, IEC, etc.) and the vendor's requirements (see Section 10). Such systems should be protected from unauthorized changes, and the failure mode of loads should be fail-safe. Plants should avoid using conventional PESs such as regular PLCs for safety alarm and trip applications because of government regulations and because of such device's unpredictable failure modes. Quite often, plants must use redundant or triple fault-tolerant redundant systems to improve reliability and failure mode of PESs.
Control system duplication (i.e., redundant systems) consists of two computer-based systems operating in parallel, one controlling and one as a backup (see FIG. 23). The backup monitors the controlling one and determines its health. If the controlling one fails, the backup takes over immediately. In critical applications, shutdown is initiated if a disagreement develops between the two systems. It is good practice to ensure that the two systems are from different vendors and that the implementation is performed by two independent teams to avoid common mode failure.
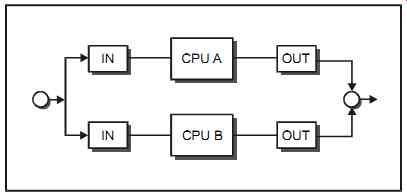
FIG. 23 Parallel redundant systems.
Control system triplication (fault-tolerant triple redundancy) is used where the consequences of a shutdown are unacceptable. In such systems, three complete control systems operate in parallel using voting functions. The voting is done by software and hardware. If one system fails, the other(s) remain operational. If only one control system fails, safety shutdown does not occur (see FIG. 24). Control and I/O functions are a continuous two-out-of-three vote, and they are normally repaired on line without affecting the process. Control system triplication is the safest form of industrial "off-the-shelf" PESs.
PES-based fault-tolerant systems will keep operating correctly with an internal failure. They are normally used for high-reliability safety instrumented systems (SISs) that require the advantages of a PES. Fault-tolerant systems that employ two-out-of-three (2oo3) voting are also called "triple modular redundant" (TMR) systems. When three sensors are used, 2oo3 voting can determine the bad sensor, alarm this condition, and isolate it from the loop.
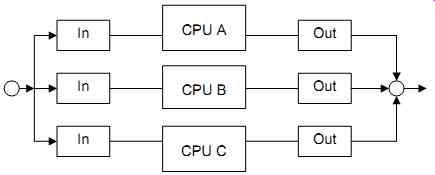
FIG. 24 Two-out-of-three PES voting system.
In addition to regulations, the successful and safe implementation of PESs depend on good engineering practices. Typically, the following points are implemented:
• Use security keys and/or passwords to prevent easy access.
• Avoid first versions of new software and wait until the bugs are out.
• Write-protect all disks except those to be written to.
• Boot from hard disk or from the same write-protected disk.
• Never use pirated software; use only licensed software.
• Perform frequent backups.
• Keep system programs on program disks and production data on data disks.
• Grounding systems are critical when using PESs as logic solvers. They must be implemented in close compliance with the vendor's recommendations.
Software
Partial software failure is typically caused by erroneous programming or by an involuntarily introduced error (e.g., electrical noise transmitted to memory). This type of failure tends to be a lot more difficult to pinpoint and diagnose than total software failure or hardware problems.
Of all system components, software is the most prone to error. For that reason, it is good practice for plants to ensure that all software changes are closely controlled. This is sometimes a difficult task, particularly during plant startup. Software must be tested before a process is commissioned. This can be done with hardwired test equipment (test switches, lamps, etc.) or with computer-based simulation (for medium to large applications). When a subcontractor is developing software, the plant must transmit exact requirements to the subcontractor, and the quality of the final product should be checked at different stages of the development process.
Application software must be customized for each job. However, plants should try, as much as possible, to avoid custom software when off-the-shelf software is available (such as for communication software between different devices). Custom software always requires a debugging period, which increases in length with the complexity of the program. Murphy's laws on custom software speak volumes.
• "Nothing is as simple as it seems." (Software always ends up being larger than originally thought.)
• "Everything takes longer than expected." (Software always takes more time than estimated.)
• "When it fails, it's at the worst possible time."
(This always happens at startup, so allow for a careful test period before implementation) PES programs are executed according to a schedule that reflects priorities and intervals. The two most common types are non-preemptive scheduling and preemptive scheduling. In non-preemptive scheduling, a task will continue to execute until all its program functions are done.
It is more straightforward than preemptive scheduling but tends to have poor control characteristics on fast processes (all tasks are delayed if one task takes longer). Moreover, with non-pre emptive scheduling is not possible to predict exactly when a task will execute. This type of scheduling should not be used for time-critical applications.
In preemptive scheduling, program execution occurs on several priority levels. The higher-priority tasks will execute if a lower-priority task is not completed. When the high-priority task is completed, the lower-priority task will then resume.
A PES can be programmed off line or on line. Off-line programming is the most common programming method and is used for the initial creation and downloading of a program. Online programming provides the tools for testing, troubleshooting, and last-minute changes during commissioning and startup. Online programming takes effect immediately, so its implementation should be carefully thought out.
Environmental Conditions
Control systems are susceptible to poor grounding, temperature, dust, corrosion, humidity, shock, vibration, and electromagnetic and electrostatic energy. In addition, signal wiring inside and outside of most PESs may act as antennas and pick up electrical noise when they are not properly shielded or when walkie-talkies are used in the vicinity of the PESs (see also Section 11 on control centers).
PESs must be grounded according to the code requirements and the vendor recommendations.
This includes grounding and shielding process for both power and signal wiring as well as enclosures. Good grounding provides a safe path for faulty currents, minimizes electric shock hazard by reducing the potential differences between conductive surfaces, and protects the equipment from electrical noise and transients. A poorly grounded system is a continuous source of hard-to-detect problems.
Most PESs have an operating temperature range of 32 to 125°F (0 to 55°C). For that reason, heat must be dissipated properly and hot spots avoided. Air cooling can achieve this and is available in natural convection, fan-forced, or air conditioning methods.
Office-type PCs should not be used as operator workstations unless they are located in a clean environment. In spite of their additional cost (20% to 50% more), industrial-quality PCs are usually used in manufacturing facilities. The three most common types of enclosures for PESs are general-purpose for indoor applications (these are typically used in clean control rooms), drip-proof types for indoor applications (typically used in industrial-quality rooms such as motor control centers [MCCs]), and watertight/dust-tight types for in-plant and outdoor applications.
Network Topologies
Network topologies connect individual devices. Such connections allow the devices to share and exchange information. The most frequently used in the process industries are the star, the bus, and the ring network systems.
Star Topology
In a star topology, each device is connected by a point-to-point link to a central hub that acts as the single switching device (see FIG. 25). The communication processing load is on that central hub. When a device wants to transmit data, it first sends a request to the central hub asking for a connection to a specific destination. Once the link is set by the central hub, data is exchanged between the two devices as if they were connected on a point-to-point link. The star topology is the most simple and least costly of the three topologies. Each device operates independently and loss of communication between a node and the central hub does not affect other nodes. Star topologies typically have no redundancy.
A variant of the star topology is the mesh topology where each device has its own switching device and therefore a one-to-one communication is provided. Each device has a single link to each of the other devices, hence the mesh look (and name). A mesh topology is expensive and complex.
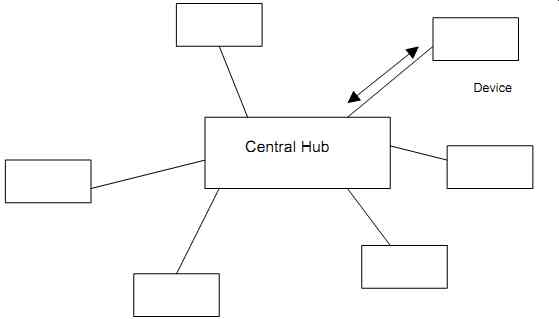
FIG. 25 Star topology.
Bus Topology
In a bus topology, also known as a multi-drop topology, all devices are connected to a passive link (or bus), basically a cable (see FIG. 26). All devices on the network listen to all messages but a device will respond only to the messages addressed to it.
Bus failure will affect communication and therefore redundant buses are sometimes used.
Since all devices on the bus share this common transmission link, only one device can transmit at any one time. Each device wishing to transmit data has to wait for its turn and then transmit.
The receiving device recognizes its address from the traveling packet and copies it. This topology is very flexible and can handle a large number of devices with a variety of data types and data rates. However a cable break disables a large portion of the network.
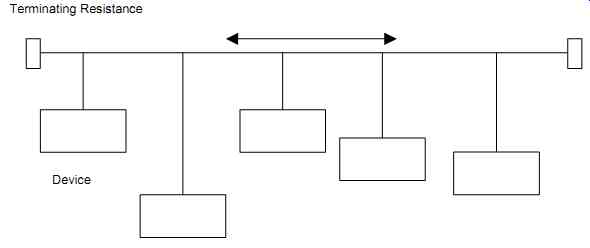
FIG. 26 Bus topology.
Ring Topology
In a ring topology, also known as loop topology, repeaters are connected to each other in point to-point links. Therefore, each repeater is connected to two other repeaters. Data is transmitted in packets circulating in one direction (see FIG. 27). Each packet contains the destination's address, some control information, and data to be transmitted. Each device attaches to a repeater. The ring topology provides excellent throughput, however it is limited to the number of devices on its network. Where redundancy is required, a second ring is implemented and communication moves in the opposite direction.
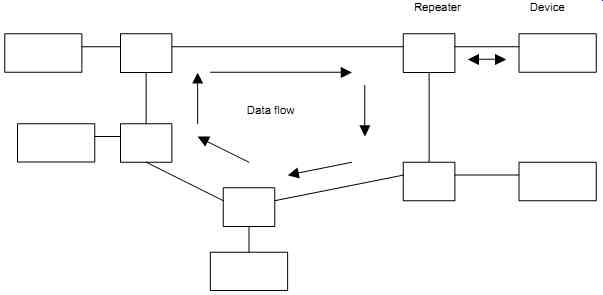
FIG. 27 Ring topology.
Transmission Media
The most common transmission media for networks are twisted pair (shielded and unshielded), coaxial (and twin axial), and fiber optic (see FIG. 28).
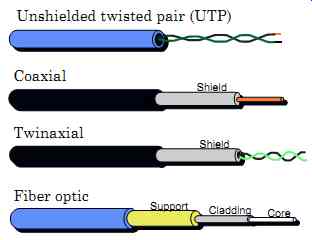
FIG. 28 Most common transmission media.
Twisted Pair (shielded and unshielded)
Twisted pair, as its name implies, consists of a pair of insulated copper wires twisted together to minimize the effects of electromagnetic interference. A cable is a number of such pairs grouped together in a bundle and wrapped in a protective sheath. A shielded pair of wires protects the signal from unwanted noise generated from electromagnetic interference (EMI) and radio frequency interference (RFI). The shield is made of metallized polyester or of a metallic woven material. EMI is created when the wires are in close proximity to electrical motors and fluorescent lighting. RFI is generated by radio equipment such as walkie-talkies.
Twisted pair is typically used in point-to-point wiring and within a single building. For longer distances, coaxial or fiber optic is used-however, they are more expensive than the twisted pair. Twisted pair can transmit both analog and digital signals and the shielded type has excellent noise immunity. The star, bus, and ring network topologies can all use twisted pair.
Coaxial (and twin axial)
The coaxial cable consists of two conductors, an outer cylinder that can be solid or braided, and an inner conductor that can be solid or stranded. In between the inner conductor and the outer cylinder is a solid dielectric material. The outer cylinder is covered by an insulating jacket. Coaxial cables must be handled carefully during installation. The twin axial is a variation of the coaxial cable. It has two coaxial cables inside a shield and an insulating jacket for overall protection.
Coaxial cable is a versatile transmission medium as it carries large amounts of data and can be used in point-to-point or multipoint configurations. It is commonly used for the bus network topology (and sometimes for the ring topology). Coaxial cabling is used for analog and digital signaling-known as broadband and baseband respectively. Its noise immunity is better than twisted pair. Coaxial cabling is more expensive than twisted pair but less expensive than fiber optic transmission.
Fiber Optic
A fiber optic cable consists of a glass or plastic core, a cladding, and a support with an outer protective jacket. The optical fiber transmits a modulated light wave signal by means of internal reflection. Light from a laser or light-emitting diode (LED) source enters the cylindrical core and is propagated. At the other end, the light signal is demodulated into an electronic signal. The laser light source is more efficient and provides greater data rates than the LED. How ever, the LED light source is less expensive, has a longer life span, and operates over a higher temperature range.
Fiber optic is commonly used in point-to-point links and the signal can travel over very long distances. Since it does not carry electrical signals, it is immune to electrical interference and ground loops. In addition, it can be safely routed through hazardous and explosive environments. Optical fiber links are more expensive than twisted pair or coaxial cables.
Selecting Vendors
Once a technical specification is prepared, the plant issues a request for quotation to potential suppliers. The number of suppliers bidding on the job will vary with the project requirements.
However, two is a minimum, three to four is reasonable for a good and fair comparison, and five to six is a maximum. Beyond that, bidding becomes a monumental task, particularly on large projects. Plant personnel can use the following checklist to assess potential suppliers and decide if they should be on the bidder's list. Note that this list should be used in addition to preparing a technical specification.
• What does this vendor offer over the competition?
• What experience does the vendor have in this type of application?
• How far is the vendor from the plant (i.e., availability of service, support, spares)?
• Does the vendor provide onsite commissioning and maintenance?
• What training does the vendor offer customers?
• Are maintenance contracts available?
• How many people are in the vendor's service group? Is there an organization chart?
• What is the service facility like?
• What is the duration of the standard guarantee? Are any extensions available?
• Will the vendor guarantee the life cycle of this product? For how long?
• Does the vendor have a quality program? Is it available for review?
• Is the vendor accredited by a quality organization?
• How does the vendor test control systems?
• What documentation is supplied with the system? Are examples available for review?
• Is the software developed in house or is it contracted out?
• Will the vendor comply with all the requirements of the plant (including engineering documentation)?
• What is the vendor's capability in handling projects?
• Is the vendor willing to submit at the bidding stage the name and résumé of the control engineer assigned to the project? Will the vendor keep this person on the job until the end of the project?
• Which portion of the project (if any) may the vendor subcontract out?
• What is the vendor's financial health (the plant's accounting and purchasing departments can help here)? How long has it been in business, and in this type of business? Testing
PES systems must be tested before the process is commissioned and started up. Testing can be done either on site after the system is installed or at the vendor's facility. The latter approach is known as a factory acceptance test (FAT) and can save a lot of precious (and expensive) time on site. In FAT, all inputs should be simulated, and all outputs monitored.
Justification
Implementing a new computer-based control system to replace an old one, quite often an analog type, requires justifying the cost. The first step in the justification process is identifying the telltale signs that point to the need for a new control system. The next step is to justify the new system by determining the cost of implementation and deciding which of the quoted systems is best for the application.
A technical audit is a good starting point to identify the weak points of the existing control system. The following is a list of telltale signs that plant management should watch for:
• Sliding market share.
• Inability to keep up with the competition.
• Unhappy customers.
• Recurring emission problems.
• Large inventories of raw materials and finished products.
• Inconsistent and/or poor quality.
• Unreliable plant trip and alarm systems.
• Poor or nonexistent production data.
• Inflexible production capabilities and long startup times.
• Poor productivity with too many staff.
• Errors when production data are manually recorded.
• Many man-hours wasted in reading data from unreliable sources.
• Too much time wasted in checking manually copied data.
• Inability to obtain immediate feedback and production knowledge.
• Inflexible production facilities and customers who are pressing to accept low-volume, unprofitable orders.
• Existing facilities take a long time to set up.
• Production costs keep going up.
• Environmental regulations cannot be complied with.
• Budgets cuts prevent plant from making investments and improvements.
• Production priorities are constantly changing, startup and shutdown costs are heavy, and accommodating customer delivery requirements is difficult.
• Existing production facilities make it impossible to meet the required quality of service, introduce new products, and implement technological know-how, and the time available to respond to market demand is getting shorter.
• Customers are demanding, but the plant cannot deliver, more specialized products and specialized packaging, better quality and service, better delivery times, and specific delivery accommodations.
Many of these telltale signs are interrelated. For example, poor quality produces more scrap, increases pollution and the need for raw material, raises costs, and decreases profits.
Once the justification process has started it should move fast since delays generate hesitation, and hesitation generates doubt and uncertainty (and nothing in the end gets done). Restarting the whole process becomes even more difficult. It should be noted that the control system is not the only answer to all the problems just mentioned. Other key factors in improving production are the quality of raw materials, the capabilities of the process equipment, and employee morale. New control systems must be implemented into existing plants, where possible, with minimal interruption to plant production and with the knowledge that this investment is worth taking.
Problems encountered in the justification process are caused by difficulties in measuring and quantifying the real economic benefits. Management wonders: Is it worth it? Is the risk worth taking? Accountants are poor engineers (what cannot be justified has a value of 0), and engineers are poor accountants (they find it hard to generate those numbers for justification). PES decision makers are generally split into two camps: believers and nonbelievers. From the believers' standpoint, justification is generally not needed. Modern controls are a way of existence (the only way), and sometimes believers are convinced of unrealistic, unachievable savings levels (which adds fuel to the fire of the nonbelievers). On the nonbelievers' side, engineers' judgments are seen as only guesses. Nonbelievers usually have no experience with modern controls (or perhaps a bad experience), they tend to be distrustful of advanced controls, and they need proof in black and white.
The cost of implementation consists of an initial cost and an ongoing cost. The initial cost includes the cost of hardware and software, the control room building (if the existing one is not reusable), the engineering, the installation, and other miscellaneous costs encompassing training, travel costs, startup, and the like. Engineering costs may include project engineering, engineering contractors, programming, system checks, preparing manuals, and commissioning and startup assistance. Installation costs may include moving the control equipment to the plant and into the control room; wiring all inputs and outputs, the power supply, and the grounding; and testing the complete installation. The cost of ongoing maintenance covers system repairs and upgrades, training, new maintenance personnel, maintenance agreements available from system vendors (or third-party service companies), and hardware/software updates.
Benefits
A control system is implemented because it provides certain benefits, and these benefits dictate the requirements of the control system. For example, if increased productivity requires automatic plant startup, the control system should have the capability of doing just that. Both the benefits and the tools that provide such benefits form the core of a functional specification (i.e., the requirements are the basis upon which a system is selected and implemented). Many of the benefits of PESs are interrelated. For example, consistent quality reduces scrap, pollution, raw material usage, inventory, and setup time.
The following is a list of typical PES benefits:
1. Increased annual sales because delivery dates are reliable (the process is under good control).
2. Customers willing to pay extra for quality (which reduces their waste), generating a positive public relations image to customers, vendors, and the media.
3. Better market and customer response since PESs are easily reprogrammable (lowering the cost of new product introduction), provide greater production flexibility (allowing a variety of setups/products/production levels at a much lower setup and changeover time), and do not require rewiring (a disadvantage of relay-based systems).
4. Pollution reduction through improved control strategy and monitoring capability (meaning that action is taken before emissions occur by forecasting malfunctions). In addition, the PES stores the results of all analyzer data and retrieve them on demand (allowing practical handling of historical data).
5. Consistent quality by reducing scrap, minimizing problems related to waste disposal, and reducing production costs by reducing the interruption of production, warranty costs, costs for the investigation of defects, quality control costs, liability suits, product downgrading, downtime, and so on. This consistent quality will translate into increased sales to satisfied customers who have tracking capabilities (customers' requirements or specifications can be automatically tied to lot analyses).
6. Increased productivity through automatic startup and shutdown, faster and greater attention to detail, tracking of numerous conditions and reacting quickly and predictably to them, and maintaining the process within specific limits. As a result of this productivity, the operator can concentrate on important activities, gain the confidence to operate within a narrower range and tighter margins (pushing the process to higher limits of production), and spend the necessary time to optimize production (especially in batch and new recipe environments).
7. Increased safety by decreasing accidents. This is done by forecasting process conditions, analyzing the types and occurrences of alarms, and tripping the production process before a catastrophe occurs.
8. Optimized production by maintaining in memory a database of production information, responding to process shifts before they affect product quality, using built-in statistical process control capabilities, forecasting delivery delays before they occur, providing a basis for training new operators and engineers, acting as a repository of knowledge from previous and present operators and engineers, providing modeling and simulation of production processes under different conditions, and aiding production and sales in the introduction of new products (which can be launched earlier and faster).
9. Inventory reduction by matching online raw material inventories with production requirements, reducing work-in-progress inventory, and reducing inventory space.
10. Accurate and timely information reporting, which is accomplished by analyzing and displaying real-time data (with reports) for evaluating performance, forecasting problems, generating statistics, and performing diagnostics. Also, a PES can enable better production data to be reported (improving the decision-making process), make it possible for production and environmental data with quality control results to be tracked, and enable full time, online record keeping (for summarizing what and how much was produced, unit costs, raw material usage, etc.). The accurate information the plant needs is available when it is needed with minimal paperwork (eliminating clipboards, manual calculations, and human errors and freeing time for problem solving and improving management and the operation).
11. Long operating life since PESs have few or no moving parts (mainly disk drives). The PES's input/output modules, CRTs, and disk drives tend to be the weakest links.
12. Additional benefits, including built-in diagnostics to facilitate maintenance and trouble shooting, ease of modification and configuration, and competitive cost when compared to large analog/relay systems, which are not easily expandable. Also, the engineering does not need to be completed when ordering a PES; an approximate input/output count with spares and a functional specification should suffice.
Implementation
In existing plants with old control systems, implementing a modern control system is generally first done on a small scale for a part of the plant. This provides a learning curve with minimum impact. In existing plants, it is common to start with a process
• that is now driving the cost up.
• with as rapid a payback as possible.
• with the fewest number of people and equipment.
• that produces a large number of several end products.
• with a large price differential between the feed and end products.
• with expensive raw materials, expensive cleanup cost, or expensive operating cost.
• with high energy consumption.
• that is hazardous (operators are kept away from production). Users should keep a few points in mind.
1. Management's support and commitment for the new system must be established. The management must ensure that the system's operators do not believe the new system will be used to "beat on" them. Instead, the new system is to help everybody do a better job.
2. Assemble a dedicated team led by a champion who will devote his/her full time to the project.
3. It is preferable to acquire an off-the-shelf system that can be easily understood by plant personnel, is well supported by the vendor, and is easily expandable.
4. Always avoid islands of automation; communication problems can become expensive nightmares.
5. Do not automate chaos.
6. Implement where success is sure. Implementation can take as little as a few months or as long as several years; it all depends on the scope.
7. Involve operators and maintenance personnel in selecting the system.
8. In new plants, implementation will be done all at once, often on a large scale. In these cases, experience is needed because there is no room for error.
Maintenance
PES maintenance should be performed by trained personnel. It is normally carried out with the system's power disconnected. If maintenance must be performed while the PES is energized, safety practices and the vendor's recommendations must be followed.
Enclosures are susceptible to contamination by dust. Dust buildup leads to lack of air flow and diminished performance by circulating fans and heat sinks. Dust also absorbs moisture, creating a conductive path rather than the expected isolation. Where fans are used make sure that the filters are kept clean to avoid restricting the cooling air. Also make sure the fans are in good shape, that is, no worn-out noisy bearings (you can hear this noise) and no foreign objects (e.g., paper clips, etc.) lodged near the fan's inlet. Bent or chipped blades must be replaced.
Also, plant personnel should clean the fins of heat exchangers to maintain convection cooling.
Moisture corrodes unprotected circuit boards, particularly where other atmospheric contaminants are added, such as corrosive gases and vapors. Therefore, where air is used to cool enclosures, use clean, dry, and oil-free instrument air.
Connections for all components must be kept tight. Poor connections lead to poor system performance and arcing. Grounding connections must be secure. To help reduce maintenance costs, plant personnel should follow the vendor's recommendations; avoid excessive tempera ture, dust, vibration, and humidity; never allow food or drinks at the operator's workstations; and ensure that power supply quality meets the vendor's recommendations.