AMAZON multi-meters discounts AMAZON oscilloscope discounts
(cont. from part 2)
15. SWEEP FREQUENCY GENERATOR
A sweep frequency generator is a special type of signal generator which generates a sinusoidal output whose frequency is automatically varied or swept between two selected frequencies. One complete cycle of the frequency variation is called a sweep. The rate at which the frequency is varied can be either linear or logarithmic, depending upon the design of a particular instrument. However, the amplitude of the signal output is designed to remain constant over the entire frequency range of the sweep.
Sweep-frequency generators are primarily employed for measurement of responses of amplifiers, filters, and electrical components over various frequency bands. The frequency range of a sweep-frequency generator usually extends over three bands: 0.001 Hz−100 kHz (low frequency to audio), 100 kHz−1,500 MHz (RF range), and 1 − 200 GHz (microwave range). Performance of measurement of bandwidth over a wide frequency range with a manually tuned oscillator is a time-consuming task. With the use of a sweep frequency generator, a sinusoidal signal that is automatically swept between two chosen frequencies can be applied to the circuit under test and its response against frequency can be displayed on an oscilloscope or X-Y recorder.
Thus, the measurement time and effort is considerably reduced. Sweep generators may also be employed for checking and repairing amplifiers used in TV and radar receivers.
The block diagram of an electronically tuned sweep frequency generator is shown in FIG. 31.
As shown in FIG. 31 , the main component of a sweep-frequency generator is a master oscillator, usually an RF type, with several operating ranges which are selected by a range switch. The frequency of the output signal of the signal generator may be varied either mechanically or electronically.
In the mechanically varied models, the frequency of the output signal of the master oscillator is varied (tuned) by a motor-driven capacitor.
In the electronically tuned models, the frequency of the master oscillator is kept fixed and a varying frequency signal is produced in another oscillator, called the Voltage Controlled Oscillator (VCO). The VCO contains an element whose capacitance depends upon the voltage applied across it. This element is employed for varying the frequency of the sinusoidal output of the VCO. The output of the VCO is then combined with the output of the master oscillator in a special electronic device, called the mixer. The output of the mixer is sinusoidal, whose frequency depends on the difference of frequencies of the output signals of the master oscillator and VCO. For example, if the master oscillator frequency is fixed at 10.00 MHz and the variable frequency is varied between 10.01 MHz to 35 MHz, the mixer will give sinusoidal output whose frequency is swept from 10 kHz to 25 MHz.
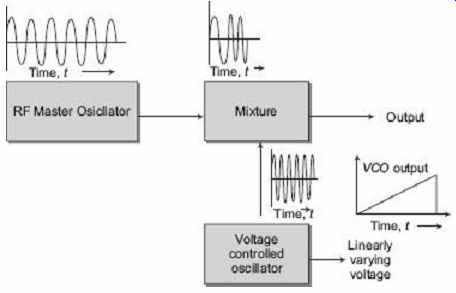
FIG. 31 Electronically tuned sweep generator
The sweep rates of sweep frequency generators can be adjusted to vary from 100 to 0.01 seconds per sweep. A voltage varying linearly or logarithmically according to sweep rate can be used for driving the X -axis of an oscilloscope or X-Y recorder synchronously.
In the electronically tuned sweep generators, the same voltage which drives the VCO serves as this voltage.
The frequency of various points along the frequency-response curve can be interpolated from the values of the end frequencies if it is known how does the frequency vary (i.e. linearly or logarithmically).
A basic system for the sweep generator is shown in FIG. 32 . A low-frequency sawtooth wave is generated from some form of oscillator or waveform generator. The instantaneous voltage of the sawtooth wave controls the frequency of an RF oscillator with its centre frequency set at the centre frequency of the device under test (filter or IF channel etc). Over a single sweep of frequency, RF output voltage from the device, as a function of time, is a plot of the filter response. By rectifying and RF filtering in a simple AM detector, the output is converted to a dc voltage varying as a function of time and this voltage is applied to the vertical input of the CRO. By synchronizing the sweep of the CRO with the sawtooth output, the device response is plotted on the CRO screen.
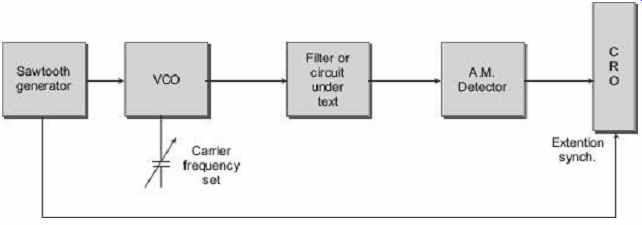
FIG. 32 Basic sweep-generator arrangement
To achieve this for a range of frequencies, it is easiest to sweep a single frequency (say 1 MHz) and heterodyne this to the test frequency required. The system developed is shown in the block diagram of FIG. 32 . A 1 MHz oscillator is frequency modulated by the output of a sawtooth generator operating at 33 Hz. The modulated output is beat with an external signal generator set to provide the difference frequency centered at the centre frequency of the filter or IF circuit under test. The output of circuit under test is fed to a simple AM detector which provides varying dc output level to feed the CRO vertical input. By synchronizing the CRO sweep circuit to the 33 Hz sweep generator, a plot of test circuit response is displayed in terms of amplitude versus frequency.
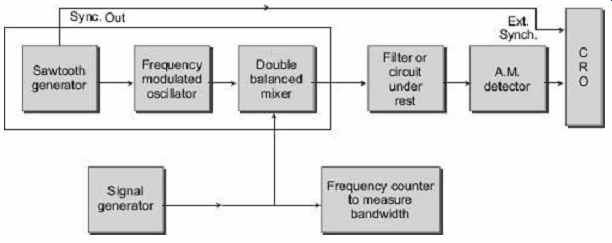
FIG. 33 The heterodyne sweep generator system-sweep
frequency width is independent of output frequency
The Heterodyne Sweep Generator
Circuit detail of the heterodyne sweep generator is shown in FIG. 34. The operation is described as follows:
The XR205 sawtooth generator N I drives a voltage-controlled oscillator N 2 operating at a fixed centre frequency of 1 MHz. This is a very stable IC package type XR 2209 which can operate at 1 MHz with its frequency set by external R and C components. Its output at Pin 8 is a triangular waveform and this is shaped to a sine wave by LP filter L1, C 10 , L2 and C11. The sweep-frequency span is controlled by the amplitude of the sawtooth wave and this is set by the potentiometer R8.
The 1 MHz sweep output is mixed with an external variable signal source (such as a standard signal generator) in a double balanced mixer N 3 . This balances out the two input signals and delivers two frequencies which are the sum and difference of the input signal frequencies. The well-known MC1496 is used for this function and provides a high output level of mixed signals up to around 20 MHz with output falling off as 25 MHz is approached. Its low-frequency performance is limited to around 100 kHz by the primary inductance of coupling transformer T I , wound on a small ferrite toroidal core. Output level is set by the potentiometer R 24 coupled via emitter follower stage V1 to provide low output impedance. For satisfactory operation, the signal level from the external signal source needs to be around 0.1 to 0.5 VPP.
To set up for a given output frequency, it is only necessary to set the external signal generator to a frequency 1 MHz removed from the required frequency. No tuning is required in the sweep generator itself. Of course, there is always a second image frequency component at the output, but as the filter or IF channel being tested is itself a selective band-limiting device, the image component is rejected from reaching the detector circuit.
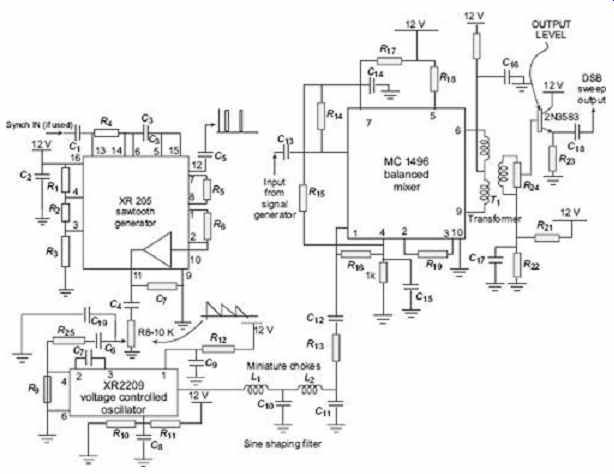
FIG. 34 Heterodyne sweep generator (100 kHz
to 25 MHz) showing sawtooth generator, voltage controlled oscillator and
mixer circuits
From an operational point of view, the precise centre frequency of the fixed internal sweep oscillator is not important. However, by setting it right at 1 MHz, the frequency required from the external oscillator becomes obvious without putting pencil to paper or referring to the calculator. The precise frequency of the oscillator can be set to 1 MHz by trimming the value of C7. The XR2209 is a very stable oscillator provided its supply voltage is held constant. Hence, the 12 V supply to the sweep generator must be regulated.
The MC1496 ( N 3 ) used was the TO5 package and the pin numbers shown are for that package. The pin numbers for the DIL package would be different. Packages N 1 and N 2 are both DIL types.
16. WAVE ANALYZER
It is well known that any periodic waveform can be represented as a sum of a dc component and a series of sinusoidal harmonics. Analysis of a waveform consists of determination of the values of amplitudes, frequency and sometimes phase angle of the harmonic components. Graphical and mathematical methods may be used for the purpose but methods are quite laborized. The analysis of a complex waveform can be done by electrical means using a bandpass filter network to single out the various harmonic components. Networks of these types pass a narrow band of frequency and provide a high degree of assumptions to all other frequencies.
A wave analyzer, in fact, is an instrument designed to measure relative amplitude of single frequency components in a complex waveform. Basically, the instrument acts as a frequency selective voltmeter which is turned to the frequency of one signal while rejecting all other signal components. The desired frequency is selected by a frequency calibrated dial to the point of maximum amplitude. The amplitude is indicated either by a suitable voltmeter or a CRO.
There are two types of wave analyzer, depending upon frequency ranges used: (i) frequency selective wave analyzer and (ii) heterodyne wave analyzer.
16.1 Frequency Selective Wave Analyzer
This wave analyzer is employed in audio-frequency-range (20 Hz to 20 kHz) measurement. It consists of a narrow band pass filter which can be tuned to the frequency of interest. The block diagram of this analyzer is shown in FIG. 35 . The waveform to be analyzed in terms of its separate frequency components is applied to an input attenuator that is set by the meter range switch on the front panel. A driver amplifier feeds the attenuated waveform to a high- Q active filter. The filter consists of a cascaded arrangement of RC resonant sections and filter amplifiers. The passband of the whole filter section is covered in decade steps over the entire audio range by switch capacitors in the RC sections. Close-tolerance polystyrene capacitors are generally used for selecting the frequency ranges. Precision potentiometers are used to tune the filter to any desired frequency within the selection passband. The final amplifier stage supplies the selected signal to the meter circuit and to an unturned buffer amplifier. The buffer amplifier can be used to drive a recorder or an electronic counter. The meter is driven by an average type detector and usually has several voltage ranges as well as a decibel scale. The bandwidth is very narrow, typically about 1% of the selected frequency. FIG. 36 shows a typical attenuation curve of a wave analyzer.
16.2 Heterodyne Wave Analyzer
This wave analyzer is used to measure the frequency in megahertz range. The block diagram of this wave analyzer is shown in FIG. 37 . The signal as input is fed through an attenuator and amplifier before being mixed with a local oscillator signal. The frequency of this oscillator is adjusted to give a fixed frequency output which is in the pass band of the amplifier. In the next stage, this signal is mixed with a second crystal oscillator, whose frequency is such that the output from the mixer is centered on zero frequency. The subsequent active filter has a controllable bandwidth, and passes the selected component of the frequency to the indicating meter. Good frequency stability in a wave analyzer is achieved by using frequency synthesizers, which have high accuracy and resolution, or by automatic frequency control. In an automatic frequency control system, the local oscillator locks to the signal, and so eliminates the drift between them.
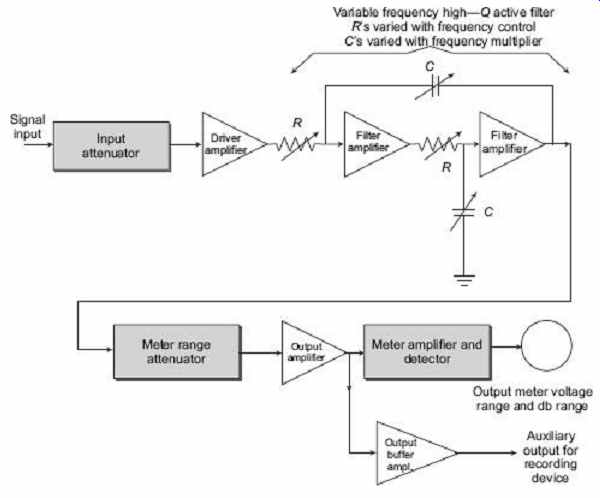
FIG. 35 Block diagram of a frequency selective
wave analyzer
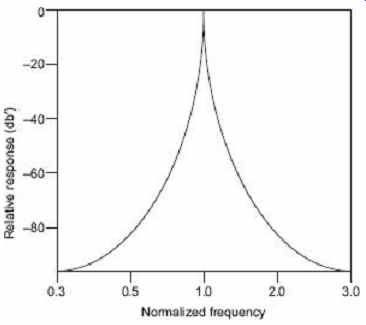
FIG. 36 Attenuation of a wave analyzer
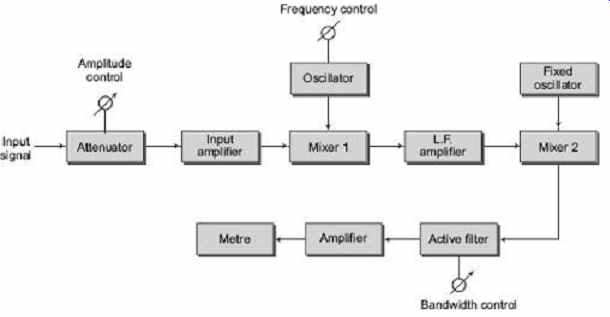
FIG. 37 Block diagram of a heterodyne wave analyzer
16.3 Applications of Wave Analyzers
Wave analyzers have very important applications in the field of i) electrical measurements, ii) sound measurements, and iii) vibration measurements.
Wave analyzers are used industrially to detect and reduce the sound and vibration generated by rotating electrical machines and equipment. A good spectrum analysis with a wave analyzer shows various discrete frequencies and resonances that can be related to the motion of machines.
17. HARMONIC DISTORTION ANALYZERS
Generally, the output waveform of an electronic device, such as an amplifier, should become an exact replica of the input waveform. However, in most of the cases that does not happen due to the introduction of various types of distortions. Distortions may be a result of the inherent non-linear characteristics of components used in the electronic circuit. Non-linear behavior of circuit elements introduces harmonics in the output waveform and the resultant distortion is often termed Harmonic Distortion (HD).
Types of Distortion
The various types of distortions which occur are explained below.
1. Frequency Distortion
This distortion occurs due to the amplification factor of the amplifier is different for different frequencies.
2. Phase distortion
This distortion occurs due to the presence of energy-storage elements in the system, which cause the output signal to be displaced in phase with the input signal. If signals of all frequencies are displaced by the same amount, the phase shift distortion would not be observed. However, in actual practice, signals at different frequencies are shifted in phase by different angles and therefore, the phase-shift distortion becomes noticeable.
3. Amplitude Distortion
Harmonic distortion occurs due to the fact that the amplifier generates harmonics of the fundamental of the input signal. Harmonics always give rise to amplitude distortion, for example, when an amplifier is overdriven and clips the input signals.
4. Inter-modulation Distortion
This type of distortion occurs as a consequence of interaction or heterodyning of two frequencies, giving an output which is the sum or difference of the two original frequencies.
5. Cross-over Distortion
This type of distortion occurs in push-pull amplifier due to incorrect bias levels.
6. Total Harmonic Distortion
A non-linear system produces harmonics of an input sine wave, the harmonics consists of a sine wave with frequencies which are multiples of the fundamental of the input signal.
The Total Harmonic Distortion (THD) is measured in terms of the harmonic contents of the wave, as given by In a measurement system, noise is read in addition to harmonics, and the total waveform, consisting of harmonics, noise and fundamental, is measured instead of the fundamental alone. Therefore, the measured value of the total harmonic distortion (THD M ) is given by FIG. 38 shows the block diagram of a harmonic distortion analyzer which is used to measure THD. The signal source has very low distortion and this can be checked by reading its output distortion by connecting directly into the analyzer. The signal from the source is fed into the amplifier under test. This generates harmonics and the original fundamental frequency. The fundamental frequency is removed by a notch filter. In the manual system, as shown in FIG. 38 (a), the switch S is first placed in the position 1 and the total content of fundamental and harmonics ( E T ) is measured. Then the switch is moved to the position 2 to measure just the harmonics E H . the value of THD is then found using following equation:
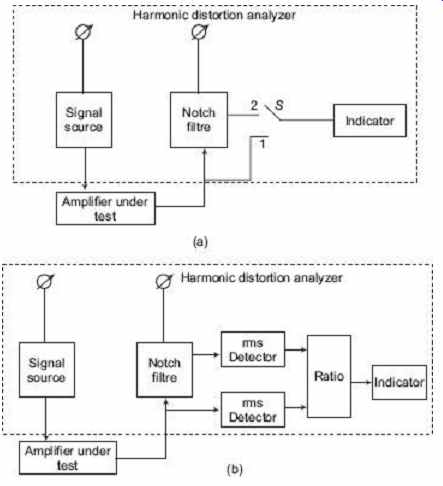
FIG. 38 Simplified block diagrams of fundamental
suppression harmonic distortion analyzers: (a) Manual reading (b) Ratio
reading
The meter can be calibrated by putting the switch in the position 1 and adjusting the reading for full scale deflection. With the switch position 2, the meter reading is now proportional to THD. FIG. 28 (b) shows an alternative arrangement, where the value of E T and E H are read simultaneously and their ratio calculated and displayed as THD on the indicator. For good accuracy, the notch filter must have excellent rejection and high pass characteristics. It should attenuate the fundamental by 100 db or more and the harmonics by less than 1 db. The filter also needs to be tuned accurately to the fundamental of the signal source. This is difficult to achieve manually and most distortion analyzers do this automatically. A common form of notch filter is a Wien bridge. This balances at one frequency only and at this frequency, the output voltage at the bridge null detector is minimum.