AMAZON multi-meters discounts AMAZON oscilloscope discounts
(cont. from part 3 )
18. SPECTRUM ANALYZER
A spectrum analyzer is a wide band, very sensitive receiver. It works on the principle of "superheterodyne receiver" to convert higher frequencies (normally ranging up to several 10s of GHz) to measurable quantities. The received frequency spectrum is slowly swept through a range of pre-selected frequencies, converting the selected frequency to a measurable dc level (usually logarithmic scale), and displaying the same on a CRT. The CRT displays received signal strength (y-axis) against frequency (x-axis).
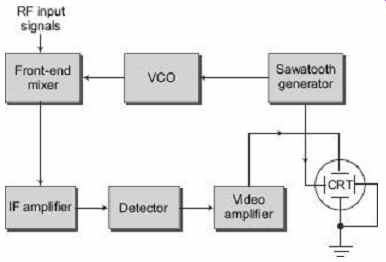
FIG. 39 Simplified block diagram of a super-heterodyne
receiver
As seen from FIG. 39 , it consists of the following parts:
1. Front-end mixer
2. Voltage controlled oscillator
3. Sawtooth generator
4. IF amplifier
5. Detector
6. Video amplifier
7. Cathode Ray Tube (CRT)
The front-end mixer is where the RF input is combined with the local oscillator (VCO) frequency to give IF (Intermediate Frequency) output. The IF frequencies are then fed to an IF amplifier, then to a detector. The output of the detector is fed to the video amplifier.
The output from the video amplifier is given to CRT (vertical axis), and the output of the sawtooth generator is given to the horizontal axis of the CRT. Thus, we see the signal amplitude against the time sweep (which in turn represents the frequency).
Normally, the frequency conversion takes place in multiple stages, and band-pass filters are used to shape the signals. Also, precision amplifiers and detectors are used to amplify and detect the signals.
Obviously, signals that are weaker than the background noise could not be measured by a spectrum analyzer. For this reason, the noise floor of a spectrum analyzer in combination with RBW is a vital parameter to be considered when choosing a spectrum analyzer. The received signal strength is normally measured in decibels (dbm). (Note that 0 dBm corresponds to 1 mWatt of power on a logarithmic scale). The primary reasons for measuring the power (in dBm) rather than voltage in spectrum analyzers are the low received signal strength, and the frequency range of measurement. Spectrum analyzers are capable of measuring the frequency response of a device at power levels as low as −120 dBm. These power levels are encountered frequently in microwave receivers, and spectrum analyzers are capable of measuring the device characteristics at those power levels.
18.1 Spectrum Analyzer Vs Oscilloscope
1. A spectrum analyzer displays received signal strength ( y -axis) against frequency ( x axis).
An oscilloscope displays received signal strength ( y -axis) against time ( x -axis).
2. A Spectrum analyzer is useful for analyzing the amplitude response of a device against frequency. The amplitude is normally measured in dBm in spectrum analyzers, whereas the same is measured in volts when using oscilloscopes.
3. Normally, an oscilloscope cannot measure very low voltage levels (say, −100 dBm) and are intended for low-frequency, high-amplitude measurements. A spectrum analyzer can easily measure very low amplitudes (as low as −120 dBm), and high frequencies (as high as 150 GHz).
4. The spectrum analyzer measurements are in frequency domain, whereas the oscilloscope measurements are in time domain.
5. Also, a spectrum analyzer uses complex circuitry compared with an oscilloscope. As a result of this, the cost of a spectrum analyzer is usually quite high.
A signal is usually defined by a time-varying function carrying some sort of information. Such a function most often represents a time-changing electric or magnetic field, whose propagation can be in free space or in dielectric materials constrained by conductors (waveguides, coaxial cables, etc.). A signal is said to be periodic if it repeats itself exactly after a given time T called the period. The inverse of the period T , measured in seconds, is the frequency f measured in hertz (Hz).
A periodic signal can always be represented in terms of a sum of several (possibly infinite) sinusoidal signals, with suitable amplitude and phase, and having frequencies that are integer multiples of the signal frequency. Assuming an electric signal, the square of the amplitudes of such sinusoidal signals represents the power in each sinusoid, and is said to be the power spectrum of the signal. These concepts can be generalized to an aperiodic signal; in this case, its representation (spectrum) will include a continuous interval of frequencies, instead of a discrete distribution of integer multiples of the fundamental frequency.
The representation of a signal in terms of its sinusoidal components is called Fourier analysis. The (complex) function describing the distribution of amplitudes and phases of the sinusoids composing a signal is called its Fourier Transform (FT). The Fourier analysis can be readily generalized to functions of two or more variables; for instance, the FT of a function of two (spatial) variables is the starting point of many techniques of image processing. A time-dependent electrical signal can be analyzed directly as a function of time with an oscilloscope which is said to operate in the time domain. The time evolution of the signal is then displayed and evaluated on the vertical and horizontal scales of the screen.
The spectrum analyzer is said to operate in the frequency domain because it allows one to measure the harmonic content of an electric signal, that is, the power of each of its spectral components. In this case, the vertical and horizontal scales read powers and frequencies. The two domains are mathematically well defined and, through the FT algorithm, it is not too difficult to switch from one response to the other.
Their graphical, easily perceivable representation is shown in FIG. 40, where the two responses are shown lying on orthogonal planes. It is trivial to say that the easiest way to make a Fourier analysis of a time-dependent signal is to have it displayed on a spectrum analyzer. Many physical processes produce (electric) signals whose nature is not deterministic, but rather stochastic, or random (noise). Such signals can also be analyzed in terms of FT, although in a statistical sense only. A time signal is said to be band-limited if its FT is nonzero only in a finite interval of frequencies, say ( F max − F min ) = B. Usually, this is the case and an average frequency F0 can be defined. Although the definition is somewhat arbitrary, a (band-limited) signal is referred to as RF (radio frequency) if F 0 is in the range 100 kHz to 1 GHz and as a microwave signal in the range 1 to 1000 GHz. The distinction is not fundamental theoretically, but it has very strong practical implications in instrumentation and spectral measuring techniques. A band-limited signal can be described further as narrow band, if B / F 0 < = 1, or wide band otherwise.
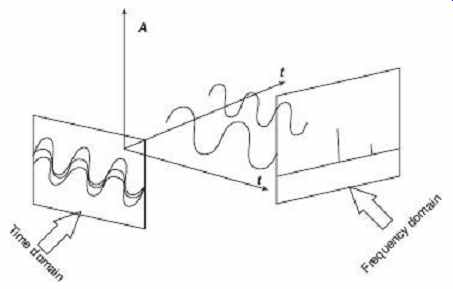
FIG. 40 How the same signal can be displayed
The first step in performing a spectral analysis of a narrow-band signal is generally the so-called heterodyne down-conversion: it consists in the mixing (beating) of the signal with a pure sinusoidal signal of frequency F L , called Local Oscillator (LO). In principle, mixing two signals of frequency F0 and F L in any nonlinear device will result in a signal output containing the original frequencies as well as the difference ( F0 − F L ) and the sum ( F0 + F L ) frequencies, and all their harmonic (multiple) frequencies. In the practical case, a purely quadratic mixer is used, with an LO frequency F L < F 0 ; the output will include the frequencies ( F 0 − FL ), 2 FL , 2 F 0 , and ( F 0 + F L ), and the first term (called the intermediate frequency or IF) will be easily separated from the others, which have a much higher frequency. The bandwidth of the IF signal will be the same as the original bandwidth B ; however, to preserve the original information fully in the IF signal, stringent limits must be imposed on the LO signal, because any deviation from a pure sinusoidal law will show up in the IF signal as added phase and amplitude noise, corrupting the original spectral content. The process of down converting a (band-limited) signal is generally necessary to perform spectral analysis in the very-high-frequency (microwave) region, to convert the signal to a frequency range more easily handled technically. When the heterodyne process is applied to a wideband signal (or whenever F L > F min ), "negative" frequencies will appear in the IF signal. This process is called double sideband mixing, because a given IF bandwidth B (i.e., (FL + B /2) will include two separate bands of the original signal, centered at F L + IF ("upper" sideband) and F L − IF ("lower" sideband).
This form of mixing is obviously undesirable in spectrum analysis, and input filters are generally necessary to split a wide-band signal in several narrow-band signals before down conversion. Alternatively, special mixers can be used that can deliver the upper and lower sidebands to separate IF channels. A band-limited signal in the frequency interval ( F max − F min ) = B is said to be converted to baseband when the LO is placed at F L = F min , so that the band is converted to the interval ( B − 0). No further lowering of frequency is then possible, unless the signal is split into separate frequency bands by means of filters.
After down conversion, the techniques employed to perform power-spectrum analysis vary considerably depending on the frequencies involved. At lower frequencies, it is possible to employ analog-to-digital converters (ADC) to get a discrete numerical representation of the analog signal, and the spectral analysis is then performed numerically, either by direct computation of the FT (generally via the fast Fourier transform, FFT, algorithm) or by computation of the signal autocorrelation function, which is directly related to the square modulus of the FT via the Wiener-Khinchin theorem.
Considering that the ADC must sample the signal at least at the Nyquist rate (i.e. at twice the highest frequency present) and with adequate digital resolution, this process is feasible and practical only for frequencies (bandwidths) less than a few megahertz. Also, the possibility of a real-time analysis with high spectral resolution may be limited by the availability of very fast digital electronics and special-purpose computers. The digital approach is the only one that can provide extremely high spectral resolution, up to several hundred thousand channels. For high frequencies, several analog techniques are employed.
18.2 A Practical Approach to Spectrum Analysis
Spectrum analysis is normally done in order to verify the harmonic content of oscillators, transmitters, frequency multipliers, etc. or the spurious components of amplifiers and mixers. Other specialized applications are possible, such as the monitoring of Radio Frequency Interference (RFI), Electromagnetic Interference (EMI), and Electromagnetic Compatibility (EMC). These applications, as a rule, require an antenna connection and a low-noise, external amplifier. Which are then the specifications to look for in a good spectrum analyzer? We would suggest the following:
1. It should display selectable, very wide bands of the EM radio spectrum with power and frequency readable with good accuracy.
2. Its selectivity should range, in discrete steps, from a few hertz to megahertz so that sidebands of a selected signal can be spotted and shown with the necessary details.
3. It should possess a very wide dynamic range, so that signals differing in amplitude six to eight orders of magnitude can be observed at the same time on the display.
4. Its sensitivity must be compatible with the measurements to be taken. As already mentioned, specialized applications may require external wide-band, low-noise amplifiers and an antenna connection.
5. Stability and reliability are major requests but they are met most of the time.
Occasionally, a battery-operated option for portable field applications may be necessary.
A block diagram of a commercial spectrum analyzer is shown in FIG. 41 .
Referring to FIG. 41 , we can say that we are confronted with a radio-receiver-like superhet with a wide-band input circuit. The horizontal scale of the instrument is driven by a ramp generator which is also applied to the voltage-controlled LO [2].
A problem arises when dealing with a broadband mixing configuration like the one shown above, namely, avoiding receiving the image band.
The problem is successfully tackled here by upconverting the input band to a high valued IF. An easily designed input low-pass filter, not shown in the block diagram for simplicity, will now provide the necessary rejection of the unwanted image band.
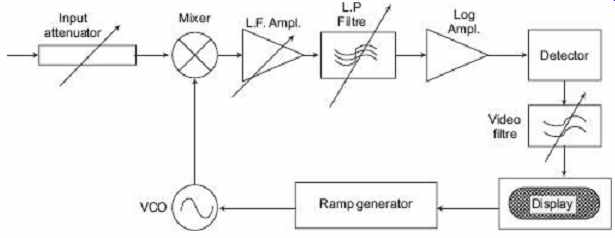
FIG. 41 Block diagram of a commercial spectrum
analyzer
Nowadays, with the introduction of YIG bandpass filter pre-selectors, tunable over very wide input bands, up conversion is not always necessary. Traces of unwanted signals may, however, show up on the display although at very low level (less than −80 dBc) on good analyzers.
A block diagram of a commercial spectrum analyzer exploiting both the mentioned principles is shown in FIG. 41 . This instrument includes a very important feature which greatly improves its performance: the LO frequency is no longer coming from a free-running source but rather from a synthesized unit referenced to a very stable quartz oscillator. The improved quality of the LO , both in terms of its own noise and frequency stability, optimizes several specifications of the instrument, such as frequency-determining accuracy, finer resolution on display, and reduced noise in general.
Further, a stable LO generates stable harmonics which can then be used to widen the input-selected bands up to the millimeter region. As already stated, this option requires external devices, e.g. a mixer. The power reference on the screen is the top horizontal line of the reticle. Due to the very wide dynamic range foreseen, the use of a log scale (e.g., 10 dB/square) seems appropriate. Conventionally, 1 mW is taken as the zero reference level:
...accordingly, dBm is used throughout. The noise power level present on the display without an input signal connected (noise floor) is due to the input random noise multiplied by the IF amplifier gain. Such a noise is always present and varies with input frequency, IF selectivity, and analyzer sensitivity (in terms of noise figure 13.). The "on-display dynamic range" of the analyzer is the difference between the maximum compression-free level of the input signal and the noise floor. As a guideline, the dynamic range of a good instrument could be of the order of 70 to 90 dB.
An input attenuator, always available on the front panel, allows one to apply more power to the analyzer while avoiding saturation and nonlinear readings. The only drawback is the obvious sensitivity loss. One should not expect a spectrum analyzer to give absolute power-level readings to be better than a couple of dB.
For the accurate measurement of power levels, the suggestion is to use a power meter.
An erratic signal pattern on display and a fancy level indication may be caused by the wrong setting of the "scan time" knob. It must be realised that high-resolution observation of a wide input band requires proper scanning time. An incorrect parameter setting yields wrong readings but usually an optical alarm is automatically switched on to warn the operator.
18.3 Spectrum Analyzer Applications
1. Device Frequency Response Measurements
You can use spectrum analyzers for measuring the amplitude response (typically measured in dbm) against frequency of the device. The device may be anything from a broadband amplifier to a narrowband filter.
2. Microware Tower Monitoring
You can measure the transmitted power and received power of a microware tower.
Typically, you use a directional coupler to tap the power without interrupting the communications. In this way, you can verify that the frequency and signal strength of your transmitter are according to the specified values.
3. Interference Measurements
Any large RF installations normally require site survey. A spectrum analyzer can be used to verify and identify interferences. Any such interfering signals need to be minimized before going ahead with the site work. Interference can be created by a number of different sources, such as telecom microwave towers, TV stations, airport guidance systems, etc.
Other measurements that could be made using a spectrum analyzer include the following:
• Return-loss measurement
• Satellite antenna alignment
• Spurious signals measurement
• Harmonic measurements
• Inter-modulation measurements
Given below are some important features available with few portable spectrum analyzer of 9 kHz to 26.5 GHz:
• Colour display
• Continuous 30 Hz to 26.5 GHz sweep
• Fast digital resolution bandwidths of 1, 3, 10, 30 and 100 Hz
• Adjacent channel power, channel power, carrier power, occupied bandwidth percentage and time-gated measurements standard
• Precision timebase and 1 Hz counter resolution
• Measurement personalities for digital radio and phase noise measurements
• Easily transfer screen image or trace data to PC
Note: The above specifications are given as an example only, and may not accurately represent the actual equipment specifications.
QUIZ:
Objective-type Questions
1. Which one of the following oscillators is used for generation of high frequencies? (a) RC phase shift (b) Wien bridge (c) LC oscillator (d) Blocking oscillator
2. A triangular wave can be generated by (a) integrating a square wave (b) differentiating a square wave (c) integrating a sine wave (d) differentiating a sine wave
3. Harmonic distortion is due to (a) change in the behavior of circuit elements due to change in temperature (b) change in the behavior of circuit elements due to change in environment (c) linear behavior of circuit elements (d) nonlinear behavior of circuit elements
4. A spectrum analyzer is a combination of (a) narrow band super-heterodyne receiver and CRO (b) signal generator and CRO
(c) oscillator and wave analyzer
(d) VTVM and CRO
5. A spectrum analyzer is used across the frequency spectrum of a given signal to study the (a) current distribution (b) voltage distribution (c) energy distribution (d) power distribution
Short-answer Questions
1. What is the initial condition for an oscillator to start?
2. What are the Barkhausen conditions of oscillations?
3. Why are LC resonant circuits impractical at audio frequencies?
4. Why is a crystal oscillator preferred in communication transmitters and receivers?
5. What is a function generator?
6. What is the basic difference between a square-wave generator and pulse generator?
7. What is a Schmitt trigger circuit? Discuss the applications of a Schmitt trigger circuit.
8. What is a VCO? Explain its working principle.
Long-answer Questions
1. Classify oscillators on the basis of design principle. How can an amplifier be converted into an oscillator? What is the role of resonance in an oscillator circuit?
2. What is an oscillator? How does it differ from an amplifier? What are the major parts of an oscillator circuit?
3. Draw the circuit diagram of a Hartley oscillator and explain its operation.
4. Draw the circuit diagram of a Colpitts oscillator and explain its operation.
5. Enumerate the advantages of RC oscillators. Explain the working of an RC phase shift oscillator.
6. Draw and explain the circuit of the Wien bridge oscillator. Derive the expression for frequency of oscillation for such an oscillator. Will oscillations take place if the bridge is balanced?
7. What are the requirements of pulse? Draw a circuit diagram of a generator which produces such pulses.
8. Explain the working of a function generator producing sine, square and triangular waveforms. Draw its block diagram.
9. Draw the circuit diagram of a stable multivibrator. How does it generate square wave?
10. Describe with a block diagram a sweep-frequency generator and its applications.
11. Discuss the working of a wave analyzer.
12. With the help of a block diagram, explain the working of a harmonic distortion analyzer.
13. What is a wave analyzer? Explain the working principle of a heterodyne wave analyzer.
14. Distinguish the principles of the working of a spectrum analyzer and a wave analyzer. Draw the block diagram of a spectrum analyzer. Indicate the common applications of a spectrum analyzer.