AMAZON multi-meters discounts AMAZON oscilloscope discounts
1. INTRODUCTION
After collecting information about the state of some process, the next consideration is how to present it in a form where it can be readily used and analyzed. This chapter, therefore, starts by covering the techniques available to either display measurement data for current use or record it for future use. Following this, standards of good practice for presenting data in either graphical or tabular form are covered, using either paper or a computer monitor screen as the display medium.
Nowadays, a wide variety of recorders are used in industry, laboratory and various fields Covering all these in a chapter is a formidable task. An attempt has therefore been made to classify the more common types of chart recorders. The definition of a chart recorder is "a device for producing, as a permanent record in analog form, the change of a variable signal (x) against time (t) (whether this be continuous or intermittent )" . In this section, only electrically actuated recorders will be considered, although in many applications, such as the recording of pressure, mechanically actuated devices are used.
However, with the increasing requirement for display as well as recording at a remote central point, where the information is also required to be passed for data processing, there is a greater tendency nowadays to use electrical methods employing suitable transducers.
Many techniques now exist for recording measurement data in a form that permits subsequent analysis, particularly for looking at the historical behavior of measured parameters in fault diagnosis procedures. The earliest recording instruments used were various forms of mechanical chart recorders. Whilst many of these remain in use, most modern forms of chart recorder exist in hybrid forms in which microprocessors are incorporated to improve performance. The sections below discuss these, along with other methods of recording signals including digital recorders, magnetic tape recorders, digital (storage) oscilloscopes and hard-copy devices such as dot-matrix, inkjet and laser printers,
X-Y recorders, ultraviolet recorders and thermal array recorders.
Classification of Recorders
There are many ways for classifying recorders; the popular one is according to the type of signal to be recorded, which is as follows:
1. Analog recorders
a. Graphic recorder
i. Strip chart recorder
• Galvanometer type
• Null type
• Potentiometric recorders
• Bridge recorders
• LVDT recorders ii. Circular chart recorders iii. X-Y Recorders
b. Magnetic tape recorders
c. Oscillographic recorders
d. Others [hybrid, paperless, ultraviolet and thermal dot matrix recorder]
2. Digital recorders
2. ANALOG RECORDERS
These kinds of recorders are used to record analog signals in the form of a chart paper for keeping the record permanently. Despite the present emphasis by the electronics industry on digital instrumentation, the use of analog recorders is still popular. As they present an instantaneous visual indication of the data being recorded, they it in an analog way, which is often more meaningful than digital indication to people in the laboratory or on the production line. There are basically three types of analog recorders available: graphic, oscillographic and magnetic tape recorders.
2.1 Graphic Recorders
A graphic recorder is basically a measuring device which is able to produce in real time a hard copy of a set of time functions with the purpose of immediate and/or later visual inspection. The curves/lines are mostly drawn on a (long) strip of paper (from a roll), often called strip chart recorder. When the curves are drawn on a circular paper, it is called a circular chart recorder, and when two independent variables are to be recorded on a piece of paper with respect to each other, it is called an X-Y recorder.
1. Strip Chart Recorder
A strip chart recorder records physical variable with respect to the independent variable time on a long paper kept in the form of a roll. The independent variable time (t) then corresponds to the strip-length axis and the physical variables measured (y) are related to the chart width. Tracings are obtained by a writing process at sites on the chart short axis (y) corresponding to the physical variables magnitudes with the strip being moved at constant velocity to generate the time axis. Graphs cannot be interpreted if essential information is absent; scales and reference levels for each physical variable recorded and for time are all necessities. Additional information concerning the experimental conditions of the recording is also necessary and is preferably printed by the apparatus (data, investigated item, type of experiment, etc.). FIG. 1 shows different components of a strip chart recorder. A typical industrial strip chart recorder is shown in FIG. 2
Strip chart recorders consist of a roll or strip of paper that is passed linearly beneath one or more pens. As the signal changes, the pens deflect producing the resultant chart. Strip chart recorders are well suited for recording of continuous processes.
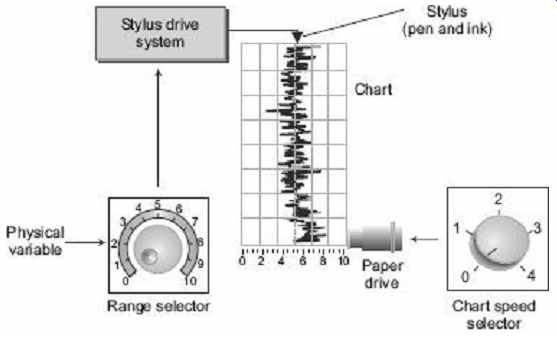
FIG. 1 Strip chart recorder
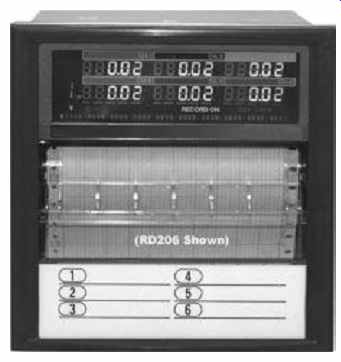
FIG. 2 Industrial strip chart recorder [Manf:
Omega Corporation]
A strip chart consists of the following:
(a) Chart/Paper Long graph paper kept on two rollers, lower roller drags the paper vertically with the help of a motor.
(b) Chart Speed Selector Controls the speed of the roller at some specified speed selected by the operator and hence controls the time scale.
(c) Range Selector Amplifier or attenuator which is to be adjusted according to the amplitude level of physical variable. If the physical variable to be recorded is of very low amplitude then it needs to be amplified with proper gain. The gain value is adjusted by selecting proper range.
(d) Stylus Driving System Moves the stylus in proportion to the physical variable to be recorded, in most recorders, a synchronous motor is used for driving the paper.
(e) Stylus Create marking/impression on the moving graph paper [most recorders use a pointer attached to the stylus, which (pointer) moves over a calibrated scale thus showing instantaneous value of the quantity being measured].
The most commonly used mechanisms employed for making marks on the papers are:
(i) Pen and ink: Marking with ink-filled stylus
(ii) Thermal type: Marking with heated stylus on temperature sensitive paper (e.g. fax paper)
(iii) Impact type: Marking with pressure sensitive paper (e.g. carbon paper)
(iv) Electrostatic stylus: Marking with charged stylus on plain paper
(v) Optical type: Marking with light ray on photosensitive paper
Strip chart recorders are commonly used in laboratory as well as process measurement applications. Modern strip chart recorders have the facility of
(i) Simultaneous recording and display of multipoint data
(ii) Universal input: The recorders accept wide range of dc voltage, all common thermocouple and RTD. Often these ranges can be programmed for each channel.
(iii) Universal power voltage of 100 V ac to 240 V ac, 50/60 Hz
(iv) Alarm Display/Printings
(v) Chart illumination
convenient to confirm printed signal in the night or in dark places.
There are various kinds of strip chart recorders. According to their working principles, these are divided in mainly two categories. One works on the principle of the galvanometer and other is called null type.
(a) Galvanometric Type
Galvanometric instruments usually use a d'Arsonval galvanometer as the basic movement. This galvanometer consists of a moving coil (shown in FIG. 3 ) suspended either on pivots or a taut ligament. The coil is then able to rotate in the field produced by a permanent magnet. When a small current is applied to the coil, a field is created which reacts with that of the permanent magnet, and the coil rotates. A control spring in a pivoted instrument and the ligament with a taut suspension provide an opposing torque. Thus, depending on the current applied, equilibrium will be established.
A pointer shows the deflection. In practice, this principle is applied in several ways. In direct-writing moving-coil instruments, an arm with a pen attached, which is fed from an ink reservoir, is directly connected to the moving coil. The pen then writes in sympathy with the coil movement on a chart, which may be either in strip form or circular from.
Such instruments are capable of recording full-scale deflections from upwards of l00 mV dc and 500 mV ac. Corresponding currents are 500 mA dc and 1 mA ac. Direct-writing instruments can be fitted with a variety of chart-drive mechanisms ranging from an alternating-current synchronous motor, with or without spring wound reserve (which enables the recorder to continue to operate for a reasonable period), to a completely mechanically driven clock mechanism. This latter feature, of course, makes the instruments portable and for suitable for field use. There are many possible variations.
Some manufacturers offer up to as many as six movements writing independently on one chart. With the use of shunts and current and voltage transformers, ranges may be extended for higher values. On some types, control facilities for high and low alarms are also fitted.
(b) Potentiometric Type
With the development of ac amplifier techniques in the mid 1930s, the requirement for increased sensitivity in process control could be satisfied by the use of a closed-loop recorder. In addition, the mechanism, though more complicated, could be made much less susceptible to vibration. The self-balancing potentiometer type of instrument consists of a bridge circuit. Across one arm of the bridge is a reference voltage, and across the other arm is a feedback network (shown in FIG. 4 ). Initially, the bridge is adjusted so that the servo amplifier and its motor are in balance and stationary. When a signal is fed to the amplifier, the output causes the servomotor to drive a balancing potentiometer, which in turn refers a feedback voltage to the amplifier input. When the two signals are equal and opposite, the system balances and the servomotor stops. If a pen unit is attached to the motor/potentiometer mechanized drive, at the point of balance, the pen will show the proportional value of the input signal. As with galvanometric instruments, this principle may be applied in various ways.
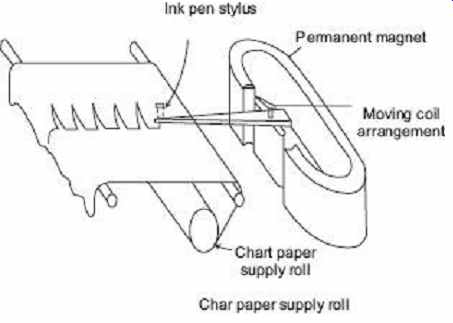
FIG. 3 Galvanometer type recorder
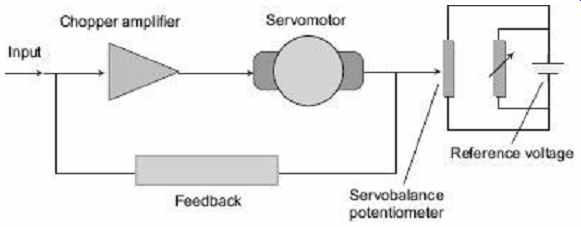
FIG. 4 Potentiometric type recorder
This kind of recorders having very high input impedance, infinity at balance conditions, and a high sensitivity.
The most common application of potentiometric recorder is for recording and control of process temperatures. Self-balancing potentiometers are unduly used in industry because of the following reasons:
(i) Their action is automatic and thus eliminates the constant operation of an operator.
(ii) They draw a curve of the quantity of being measured with the help of a recording mechanism.
(iii) They can be mounted on the switchboard or panel and thus act as mounting devices for the quantity under measurement.
(c) Single-Point and Multi-point Recorders Instruments that record changes of only one measured variable are called single-point recorders.
A multi-point recorder may have as many as 24 inputs, with traces displaced in six colors.
2. Circular Chart Recorder
A circular chart recorder records data in a circular format. The paper is spun beneath one or more pens as shown in FIG. 5 . The pens are deflected in proportion to the varying signal resulting in a circular chart. Circular chart recorders are ideal for batch processes where a set process time is known. The charts are normally designed to rotate in standard time periods, such as 1 hour, 24 hours, 7 days, etc., although many recorders are flexible enough to accommodate non-standard time periods.
These recorders were developed mainly to take advantage of the availability and convenience of a spring-wound clock and synchronous motor movements to drive the chart in a circular direction. The circular chart used here has concentric circles ruled on it to form its scales as shown in FIG. 5 . In addition, there are printed arcs extending from the centre of the chart to the paper's edge. As the pen of the recorder is moved, it swings along these arcs; these arcs are called the 'time arcs'. The speed of the rotation of the chart is usually one revolution per 24 hours or per seven days or any other speed, which can be conveniently obtained by using a synchronous motor with suitable gear assembly. The radial position of the pen at any time indicates the instantaneous value of the quantity under measurement. A typical industrial circular recorder is shown in FIG. 6 .
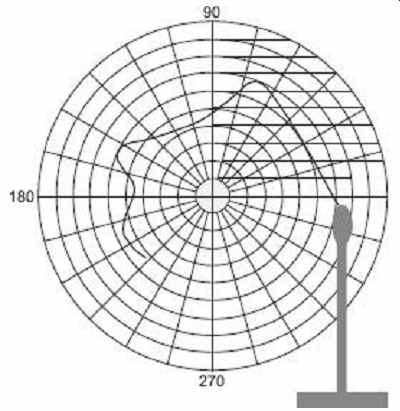
FIG. 5 Circular chart recorder
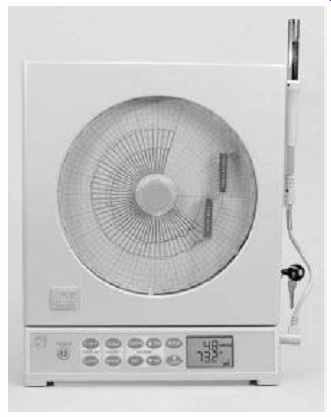
FIG. 6 Industrial circular chart recorder [Manuf: Omega]
Chart diameter is limited to a maximum of 0.3 m. Speed of the chart is also limited, resolution along the scale length is usually non-uniform and the charts do not run for a long period. Magnitude of several variables can be recorded on a single chart which makes it easy and convenient to analyze the interrelationship of various measurements and also saves the panel mounting space.
The various drives for circular charts are classified as follows:
(a) Mechanical (spring clock drive) (b) Pneumatic (air lock drive) (c) Electric (synchronous regulated dc motor or motor wound spring) (d) Dual powered drive (duplex), i.e. a synchronous motor and spring clock mechanical drive (e) Externally controlled drives Circular chart recorders are particularly suitable for direct actuation by a number of mechanical sensors such as bellows, bourdon tubes, etc.
3. X-Y Recorder
With the development of the potentiometric principle, users were aware that a record was often required as the resultant of two varying signals, and thus the X-Y plotter was introduced ( FIG. 7 ). Today, X-Y plotters are as flexible as conventional potentiometric instruments, except that they have two completely independent servo systems to operate the X and Y channels. The two most popular sizes are A4 and A3 (297 mm × 210 mm, 420 mm × 297 mm, respectively). Sensitivities similar to those obtainable with Y - t instruments are achieved, and, often, the more comprehensive instruments are also fitted with a time axis t , which provides single or repetitive time sweeps against the Y axis.
XY recorders accept two inputs and create a chart or graph of one input versus the other.
They are commonly used to determine the relationship between the two inputs. For example, in a chemical process, an XY recorder might be used to monitor the effect temperature has on the pressure of the process. A typical industrial XY recorder is shown in FIG. 7 .
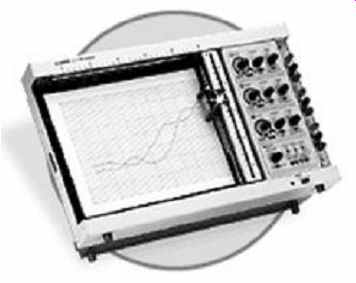
FIG. 7 Industrial XY recorder [Manuf: Omega]
This system has a pen which can be positioned along the two axes with the writing paper remaining stationary. There are two amplifier units, one amplifier actuates the pen in the Y -direction as the input signal is applied, while the second amplifier actuates the pen in the X -direction. The movements of the pen in X -and Y -directions are automatically controlled by means of a motor, pulleys and a linear potentiometer. Obviously, trace of the marking pen will be due to the combined effects of two signals applied simultaneously. In these recorders, an emf is plotted as a function of another emf There are many variations of X-Y recorders. With the help of these recorders and appropriate transducers, a physical quantity may be plotted against another physical quantity. FIG. 8 shows a block diagram of a typical analog X-Y recorder.
A signal enters in each of the two channels.
The signals are attenuated to the inherent full-scale range of the recorder (often 0.5 mA). The signal then passes to a balance circuit where it is compared with an internal reference voltage.
The error signal (i.e. the difference between the input signal voltage and the reference voltage) is fed to a "chopper" which converts dc signal to an ac signal.
The signal is then amplified in order to actuate a servomotor which is used to balance the system and hold it in balance as the value of the quantity being recorded changes.
The action described above takes place in both the axes simultaneously. Thus, we get a record of one variable with respect of another.
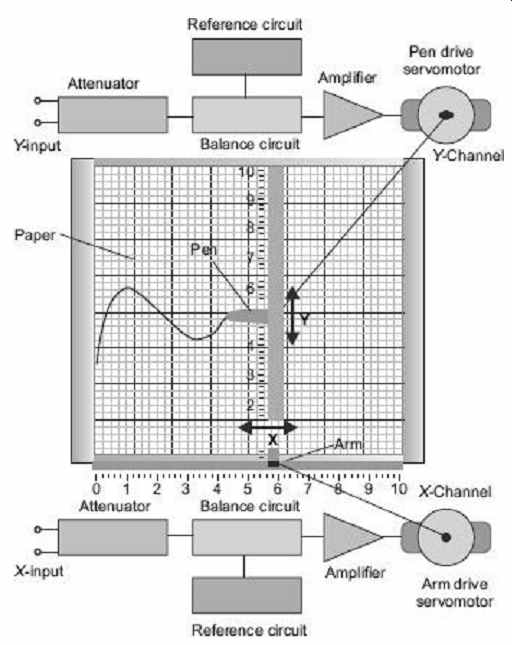
FIG. 8 Different components of an XY recorder
Advantages
1. The instantaneous relationship between two physical quantities can be recorded.
2. The relationship between either electrical or non-electrical quantities can be recorded.
3. In modem types of recorders, zero offset adjustments are available.
Applications A few examples in which use of X-Y recorders are used are as under:
1. Plotting of stress-strain curves, hysteresis curves and vibrations amplitude against swept frequency
2. Pressure-volume diagrams for LC engines
3. Pressure-flow studies for lungs
4. Lift drag wind tunnel tests
5. Electrical characteristics of materials such as resistance versus temperature
6. Plotting the output from electronic calculators and computers
7. Speed-torque characteristics of motor
8. Regulation curves of power supplies
9. Plotting of characteristics of vacuum tubes, zener diodes, rectifiers and transistors, etc.
4. Hybrid Recorders
Hybrid chart recorders represent the latest generation of chart recorder and basically consist of a potentiometric chart recorder with an added microprocessor. The microprocessor provides for selection of range and chart speed, and also allows specification of alarm modes and levels to detect when measured variables go outside acceptable limits. Additional information can also be printed on charts, such as names, times and dates of variables recorded. Microprocessor-based, hybrid versions of circular chart recorders also now exist. A typical industrial hybrid recorder is shown in FIG. 9.
A hybrid recorder can function as a recorder or data logger. Like a standard recorder, the hybrid recorder can generate a chart of the inputs. However, it can also produce a digital stamp of the data similar to a data logger. They are commonly available in multichannel designs although one print head normally handles all channels. This makes the hybrid recorder a cost-effective solution for multichannel systems although the response time is not as fast as recorders which have a unique pen for each channel.
5. Paperless Recorders
Paperless recorders are one of the latest types of recorders to emerge on the market.
Paperless recorders display the chart on the recorders' graphic display rather than print the chart on paper. The data can normally be recorded in internal memory or to a memory card for later transfer to a computer. The major benefit of paperless recorders is conservation of paper and easy transfer to a computer. A typical industrial paperless recorder is shown in FIG. 10 .
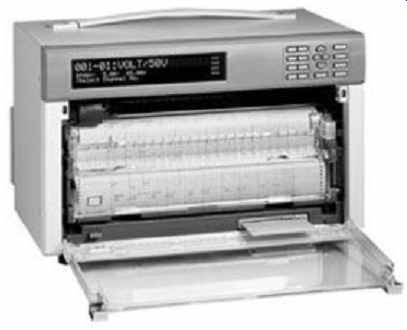
FIG. 9 Industrial hybrid recorder [Omega]
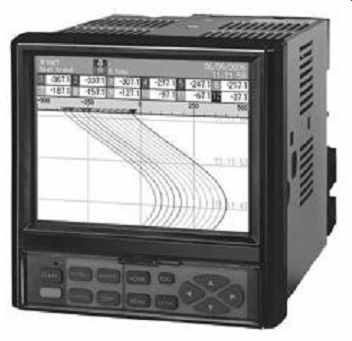
FIG. 10 Industrial paperless recorder [Omega]
6. Ultraviolet Recorders
The limited bandwidth problem of galvanometric recorders are due to system moment of inertia and spring constants can be reduced limited to the maximum bandwidth to about 100 Hz. Ultraviolet recorders work on very similar principles to standard galvanometric chart recorders, but achieve a very significant reduction in system inertia and spring constants by mounting a narrow mirror rather than a pen system on the moving coil. This mirror reflects a beam of ultraviolet light onto ultraviolet sensitive paper. It is usual to find several of these mirror-galvanometer systems mounted in parallel within one instrument to provide a multi-channel recording capability, as illustrated in FIG. 11 . This arrangement enables signals at frequencies up to 13 kHz to be recorded with a typical inaccuracy of ±2% full scale, while it is possible to obtain satisfactory permanent signal recordings by this method. Special precautions are necessary to protect the ultraviolet sensitive paper from light before use and to spray a fixing lacquer on it after recording.
Such instruments must also be handled with extreme care, because the mirror galvanometers and their delicate mounting systems are easily damaged by relatively small shocks. In addition, ultraviolet recorders are significantly more expensive than standard chart recorders.
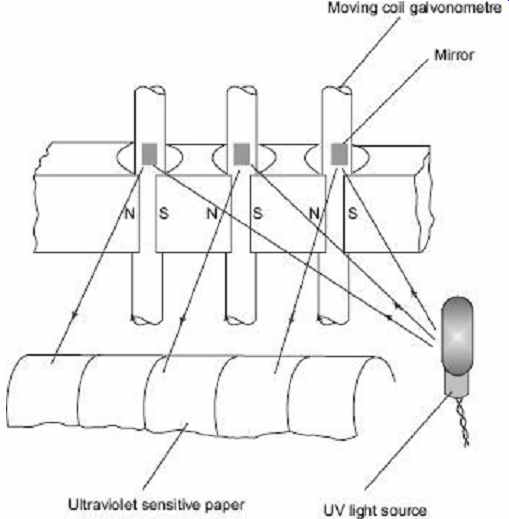
FIG. 11 Internal recording components of UV recorder.
7. Thermal Dot Array Recorders
Thermal dot array recorders have the advantage of not having any moving parts. The writing mechanism is an array of equidistant writing points which covers the total width of the paper. For writing, medium thermo-sensitive papers are generally used. In this array the writing system consists of miniature electrically heated coils. Maximum writing frequency is determined by thermal properties of the coils which are in close contact with the chart paper and the electric activating pulse. Heating of the thermo-sensitive paper results in a black dot with good long-term stability. The heating pulse is controlled in relation to the chart velocity in order to obtain sufficient blackness at high velocities.
Tracing blackness or line thickness is seldom used for curve identification; and alphanumeric annotation is mostly applied. Different types of grid patterns can be selected by the user. Moreover, alphanumeric information can be printed for indicating experimental conditions. Ordinate axis resolution is determined by the dot array: primarily, 8 dots/mm; exceptionally, 12 dots/mm (as in standard laser printers). Most of the dot array instruments are intended for high-signal-frequency applications: per channel sampling frequencies of 100, 200, and even 500 kHz are used in real time. These sampling frequencies largely exceed the writing frequencies; during the writing cycle, data are stored in memory and for each channel within each writing interval, a dotted vertical line is printed between the minimal and the maximal value. For example, a sine wave with a frequency largely exceeding the writing frequency is represented as a black band with a width equal to the sine amplitude. In this way, the graphs indicate the presence of a phenomenon with a frequency content exceeding the writing frequency.
2.2 Magnetic Disk and Tape Type Recorder
At present, magnetic recording technology dominates the recording industry. It is used in the forms of hard disk, floppy disk, removable disk, and tape with either digital or analog mode. In its simplest form, it consists of a magnetic head and a magnetic medium, as shown in Fig. 12. The head is made of a piece of magnetic material in a ring shape (core), with a small gap facing the medium and a coil away from the medium. The head records (writes) and reproduces (reads) information, while the medium stores the information. The recording process is based on the phenomenon that an electric current I generates a magnetic flux f as described by Ampere's law. The flux f leaks out of the head core at the gap, and magnetizes the magnetic medium which moves from left to right with a velocity V under the head gap. Depending on the direction of the electric current i , the medium is magnetized with magnetization M pointing either left or right. This pattern of magnetization is retained in the memory of the medium even after the head moves away.
Magnetic tapes are still popular in several areas such as:
1. Medical research
2. Patient monitoring
3. Surveillance
4. Spying
5. Production control
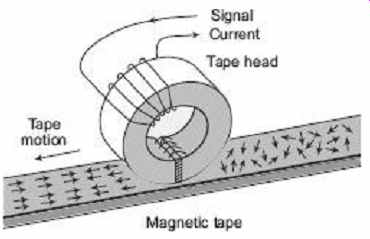
FIG. 12 Magnetic tape recording
1. The Magnetic Tape
Before actually going into the details of the magnetic tape recorder, it is better to know about the tape which is used for this purpose. Actually, the tape is made out of a special type of plastic material which is stable and can withstand continuous rubbing against the head. Normally, this material is either PVC or Mylar which are quite resistant to wear and stretching is necessary for the tape to remain useful for a long period of time. On top of this plastic base, there is a thin layer of magnetic material, usually iron oxide. The particles of this magnetic material are shaped in the form of tiny needles and occupy the top portion of the plastic base. The typical thickness of the tape is of the order of 25 micrometers.
During recording, an electrical signal causes current to flow through the coil producing a magnetic field in the gap, as shown by the blue lines of force in FIG. 12. As the electrical signal varies in amplitude and frequency, so does the magnetic field. The tape consists of a plastic film coated with a material that is magnetized by the field as it passes over the gap. As the magnetic field varies in strength, so does the magnetism stored on the tape. During playback, the tape passes over the same head (it is called the record/playback head). This time the magnetism stored on the tape induces a voltage in the head coil. This voltage is amplified and used for retrieval of the recorded signal.
(a) Principle behind Magnetic Recording-Hysteresis Loop
Those of you who have studied physics must surely remember that there are two magnet types, namely permanent magnet and temporary magnet. In a temporary magnet, the magnetism is induced as a result of some force which aligns the magnetic particles along a specific axis. This force could be due to rubbing of another magnetic material or an electromagnetic field applied using a varying current.
Take a look at the typical magnetization curve in FIG. 13 , which shows the graph of the magnetizing force H against the flux density B . When a material is in purely nonmagnetized state and a magnetizing force is applied, the fl flux density rises along the dotted line OAC . But now if the current is brought to zero, the flux does not reduce to zero but a residual flux remains and the current has to be extended into the negative region (opposite direction) to bring B to zero again.
Hence, a loop is formed of the overall process as can be seen from the diagram and this is known as the magnetization curve for the material or is also known as the hysteresis loop . Now this property may be undesirable in several situations but here you can intuitively imagine a great use for the same. Once the signal is applied to the magnetic tape via the recording head, the section of the tape gets magnetized in accordance with the signal which leaves a residual flux on the tape. This acts to store that signal on the tape which can be played back using the playback head.
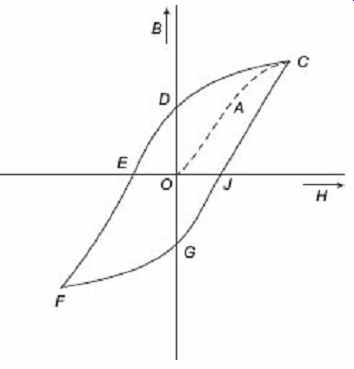
FIG. 13 Hysteresis loop
(b) The Basic Arrangement
The basic circuit of a magnetic recording and playback system is quite simple and can be understood by seeing FIG. 14 , which shows the entire arrangement. Of course, this is a highly simplified sketch without the inside nuts and bolts, yet it is useful to take a broad view of the system.
As you can see, the entire system consists of two portions-a mechanical arrangement to make the magnetic tape move across two points, and an electrical system which does the real job. The mechanical movement is achieved with the help of motor drive and a combination of rollers and belts. The electrical part is taken care of by appropriate circuits which do the work of recording, playback and amplification of sound. There are two heads which are used for recording and playback of the signals respectively.
(c) Recording and Playback
The basic principle of operation is quite simple. As the tape rubs against the recording head, it applies a magnetic field which is proportional to the input signal. This signal orients the magnetic particles in a specific format which acts as indicators to the pattern of signal stored. When the playback head rubs against the tape, the signal is reproduced since now the particles induce similar magnetic patterns in the head. If you want to read more technical details about this process you can refer to the next article on this topic (coming soon and will be linked here).
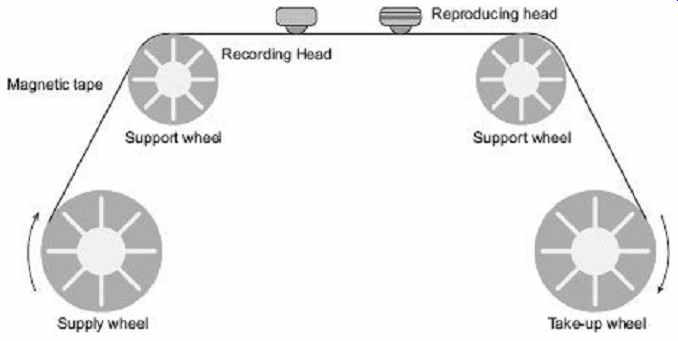
FIG. 14 Magnetic tape recording mechanism
There are several types of recording techniques which are used for recording on magnetic tapes and these can be Direct recording Frequency modulation recording Pulse duration modulation recording Digital recording We will take a look at all these methods of recording on magnetic tapes
2. Direct Recording
If the signals are recorded in an analog manner in a way so that the amplitude and frequency of the signal is recorded linearly as a variation of the amplitude, magnetization and wavelength on the magnetic tape, such a system of recording is known as direct recording. Since low distortion is required on the playback signal, this is achieved by adding a high-frequency ac bias signal to the signal being recorded.
This method of recording is most suited for audio signals rather than any other purpose.
This is so because the human ear has an in-built mechanism which averages the amplitude variation errors.
3. FM Recording
We have learnt about frequency modulation in a previous article and know that frequency modulation is all about using a sine wave carrier signal and modulating or modifying it as per the signal to be loaded on that carrier signal. Similarly, in case of FM recording in magnetic tapes, a frequency modulator is used to feed the input signal onto the carrier signal. This signal is then recorded onto the magnetic tape either with or without the ac bias signal as described in the previous section of direct recording.
FIG. 15 shows a simplified view of such a recording system without showing the internal details. As you can see, when the signal is now reproduced using the playback head, it needs to be passed through a demodulator which separates the sine carrier wave from the recorded signal and then reproduced.
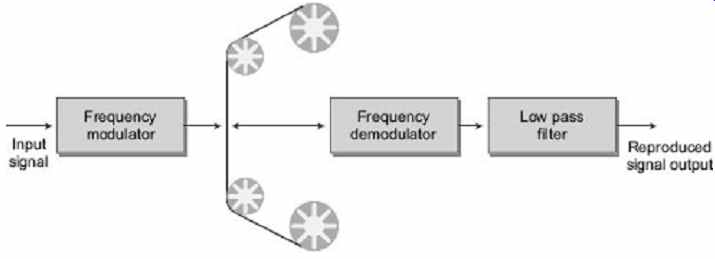
FIG. 15 FM recording mechanism
This system is more complicated in its construction and expensive to build because of the various extra circuitries involved in it. Hence, normally it is only used in situations where amplitude-variation errors are not acceptable, such as instrumentation where the parameters of some delicate industrial process are recorded. Despite this advantage, this system has a poor high-frequency response and requires a higher tape speed which needs to be precisely controlled.
4. PDM Recording
In this type of magnetic tape-recording system, the input signal is converted into a pulse signal. The duration of the pulse is in tune with the amplitude of the signal; hence the name pulse duration modulation since the duration of the pulse varies with the input signal.
Obviously, since the continuous input signal is divided into discrete pulses, this type of recording system is even more complicated and expensive than the FDM system described previously. Yet it is used in situations which require special quality recording such as situations where a large number of variables are monitored and they change very slowly.
The advantages of such a system are (a) Multi channel recording (b) Great degree of accuracy (c) Very low signal/noise ratio
5. Benefits of Magnetic Recording
Now we will take a look at some of the advantages and drawbacks of the magnetic tape systems.
(a) The frequency range of the signals stored on the tape has a very wide range and spectrum, and an equally good dynamic range.
(b) Here is very less distortion of signals stored on the tape. This is specifically useful for audio/ video purposes.
(c) Tapes can be used to store multiple signals along the same length, thus increasing efficiency.
(d) Even though you might think that electronic memories are getting cheaper, the tape still is a winner in terms of cost per bit of storage. This is mainly due to large surface area of the tape and very high data density.
(e) Time base of the stored signal data can be varied as per requirement. This means that signals recorded at fast speed can be played back at slower speed and vice versa, which is useful in several applications
2.3 Oscillographic Recorders
Although, strictly speaking, oscillographs are direct-writing instruments, they also employ a moving coil, but the writing element uses much more power and is fed from an ac amplifier feeding a driver power amplifier. The writing element, usually referred to as a "pen motor", can consume more than 100 W. The angular deflection of the motor is often restricted to as little as 17° with the result that response times of up to 150 Hz can be obtained. Oscillographs are suitable for recording high transient signals such as occurring in strain-gauge measurements and in medical applications such as measuring heartbeat and brain-response (ECGs and EEGs). The recording is usually made on inkless paper using a heated stylus.
Used primarily for applications in the test and research fields, the capabilities of oscillographic recorders and the newer digital oscilloscopes have expanded greatly over the past several years. An oscillograph is a device for determining waveforms by plotting instantaneous values of a quantity such as voltage as a function of time. A decade ago, this implied either a recording galvanometer or a CRT recorder-analog instruments that afforded the needed bandwidths in excess of 20 kHz.
As in other recorder developments, however, digital is the buzzword today and Digital Storage Oscilloscopes (DSOs) or simply digital oscilloscopes have proliferated. These may be defined as oscilloscopes that digitize an input signal for storage in memory for later display or analysis. It is a logical and relatively simple step to use the stored data to provide a chart record, and many DSOs do just that, essentially acting as data loggers.
A recent survey lists some 30 different suppliers of DSOs, many of them PC-based.
They cover a range of bandwidths-some around 40 to 50 MHz while others go as high as 350 MHz. These are sophisticated electronic instruments that have capabilities far beyond traditional analog CRT-based oscilloscopes, which have been around for many decades.