AMAZON multi-meters discounts AMAZON oscilloscope discounts
(cont. from part 1)
3. DIGITAL RECORDERS
Digital recorder record the data in the form of '1' and '0'. There are several types of digital recorders. The following section discusses data loggers and magnetic-type digital recorders.
3.1 Data Logger
Data loggers are is a stand-alone devices that can record information electronically from internal or external sensors or other equipment that provide digital or serial outputs.
1. Key Features of Data Loggers
(a) Stand-alone Operation Most data loggers are normally configured with a PC, some models can be configured from the front panel provided by the manufacturer. Once the data loggers are configured, they don't need the PC to operate.
(b) Support for Multiple Sensor Types
Data loggers often have universal input type which can accept input from common sensors like thermocouple, RTD, humidity, voltage, etc.
(c) Local Data Storage
All data loggers have local data storage or internal memory unit, so all the measured data is stored within the logger for later transfer to a PC.
(d) Automatic Data Collection
Data loggers are designed to collect data at regular intervals, 24 hours a day and 365 days a year if necessary, and the collection mode is often configurable.
Data logging and recording are both analog terms in the field of measurement. Data logging is basically measuring and recording of any physical phenomena or electrical parameter over a period of time. The physical phenomena can be temperature, strain, displacement, flow, pressure, voltage, current, resistance, power, and many other parameters. Typical industrial data loggers are shown in FIG. 16 .
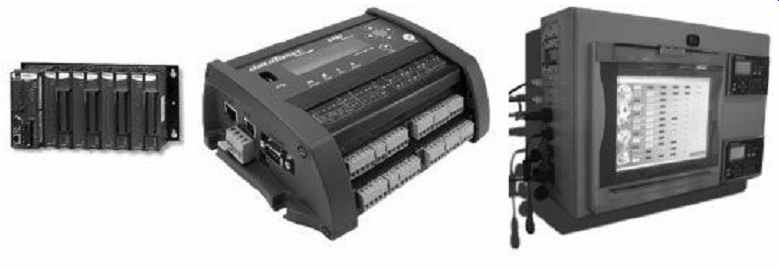
FIG. 16 Typical data loggers [National Instrument
and Omega Corp.]
The data logger collects information about the state of any physical system from the sensors. Then the data logger converts this signal into a digital form with the help of an A/D converter. This digital signal is then stored in some electronic storage unit, which can be easily transferred to the computer for further the analysis, the schematic diagram of a data-logging application in industrial environment is shown in FIG. 17 .
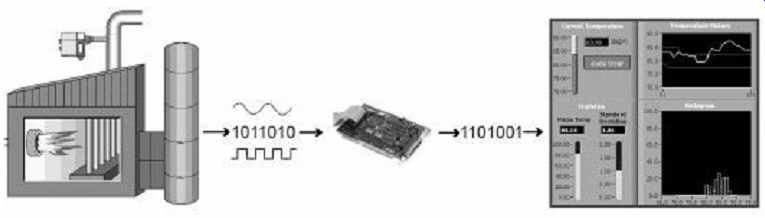
FIG. 17 Industrial data logging and display
A few basic components that every data logger must have are shown in FIG. 17 , which are:
1. Hardware components like sensors, signal conditioning, and analog-to-digital converter, etc.
2. Long-term data storage, typically onboard memory or a PC
3. Software for collecting data, analyzing and viewing
2. Functions of Data Loggers
Beyond the acquiring and storing data, a data logger often performs various kinds of other jobs like offline and online analysis, display, sharing data with other devices connected with the network, reporting events and providing alarm whenever some critical situation arises. A complete data-logging application typically requires most of the elements shown in FIG. 18 .
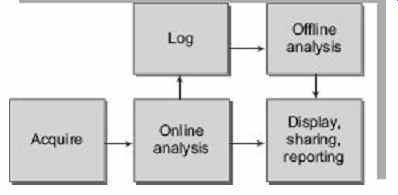
FIG. 18 Different components of data loggers
3.2 Digital Tape Recording
The very mention of the name digital tape recording brings the picture of hard drives, flash memories, etc. to our mind, but this also refers to another method of recording on the good old magnetic tape as well. FIG. 19 shows the digital tape recording mechanism.
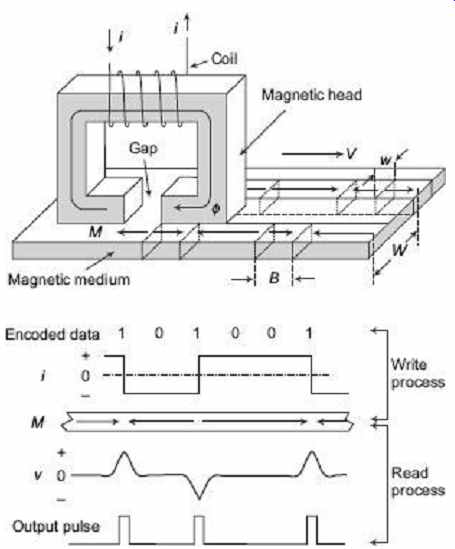
FIG. 19 Digital tape recording mechanism
The only difference is that the signals are recorded in the form of 0s and 1s which are typical of the digital world. Obviously, it would require modulation of some form or the other, to convert analog to digital signals and hence there are several methods of magnetic tape recording which fall under the category of digital recording.
Some of these methods are
1. Return-to-bias method
2. Return-to-zero method
3. Non-Return-to-zero method
The detailed description of these methods would be a bit too complicated here so we will just go through the basics of one of these, let us say the Return-to-Bias (RB) method.
Figure (19) schematically shows the digital recording/reproducing process. First, all user data are encoded into a binary format-a serial of 1s and 0s. Then a write current i am sent to the coil. This current changes its direction whenever a 1 is being written.
Correspondingly, a change of magnetization, termed a transition , is recorded in the medium for each 1 in the encoded data. During the reproducing process, the electric voltage induced in the head coil reaches a peak whenever there is a transition in the medium. A pulse detector generates a pulse for each transition. These pulses are decoded to yield the user data. The minimum distance between two transitions in the medium is the flux change length B, and the distance between two adjacent signal tracks is the track pitch W, which is wider than the signal track width w. The flux change length can be directly converted into bit length with the proper code information. The reciprocal of the bit length is called linear density, and the reciprocal of the track pitch is termed track density. The information storage area density in the medium is the product of the linear density and the track density. This area density roughly determines how much information a user can store in a unit surface area of storage medium, and is a figure of merit for a recording technique.
Much effort has been expended to increase the areal density. For example, it has been increased 50 times during 90's.
4. DISPLAY SYSTEM
The display system acts as a final link between the measuring process and the user. If the display is not easy to see and easy to understand then that process is compromised. The user's sensory capabilities and cognitive characteristics, therefore, must both be addressed in display-system selection. Furthermore, display technologies and performance capabilities are easier to evaluate in the context of their intended application. The following section discusses various kind of commonly used display system.
4.1 Cathode Ray Tube (CRT)
The Cathode Ray Tube (CRT) was developed for television in the 40s. Now it has wide range of applications in oscilloscopes, radar and monitors, etc.
It consists of a glass envelope made from a neck and cone. All air has been extracted so that it contains a vacuum. At the narrow end are pins which make connection with an internal electron gun, as shown in FIG. 20. Voltages are applied to this gun to produce a beam of electrons. This electron beam is projected towards the inside face of the screen.
Different basic component of CRTs are electron gun, electron accelerating anode, horizontal and vertical electric field coils, electron beam and a screen coated with phosphor. The electron gun generates a narrow beam of electrons. The anodes accelerate the electrons. Deflecting coils produce an extremely low-frequency electric field that allows for constant adjustment of the direction of the electron beam. There are two sets of deflecting coils: horizontal and vertical. (In the figure, only one set of coils is shown for simplicity). The intensity of the beam can be varied. The electron beam produces a tiny, bright visible spot when it strikes the phosphor-coated screen. The screen is covered with a fine layer of phosphorescent elements, called phosphors , which emit light by excitation when electrons strike them, creating a lit-up dot called a pixel.
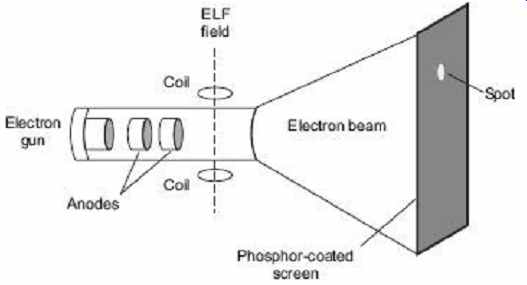
FIG. 20 Internal components of a CRT
To produce an image on the screen, complex signals are applied to the deflecting coils, and also to the apparatus that controls the intensity of the electron beam. This causes the spot to race across the screen from right to left, and from top to bottom, in a sequence of horizontal lines called the raster . As viewed from the front of the CRT, the spot moves in a pattern similar to the way your eyes move when you read a single-column page of text.
But the scanning takes place at such a rapid rate that your eye sees a constant image over the entire screen.
The illustration shows only one electron gun. This is typical of a monochrome, or single-color CRTs. However, virtually all CRTs today render color images. These devices have three electron guns, one for the primary color red, one for the primary color green, and one for the primary color blue. The CRT thus produces three overlapping images: one in red (R), one in green (G), and one in blue (B). This is the so-called RGB color model .
In computer systems, there are several display modes, or sets of specifications according to which the CRT operates. The most common specification for CRT displays is known as SVGA (Super Video Graphics Array). Notebook computers typically use liquid crystal display. The technology for these displays is much different than that for CRTs.
Cold Cathode Display
A cathode is any electrode that emits electrons as discussed in the section on CRT display.
Generally, the cathode is heated so that electron emission occur at lower potential difference these cathode are called hot cathode and are widely used in vacuum tube CRT monitor oscilloscope, etc. By taking advantage of thermionic emission, electrons can overcome the work function of the cathode with lower electric field. But in the case of cold cathode, sufficient voltage is provided so that electrons can overcome the work function and come out from the cathode at ambient temperature. Because it is not deliberately heated, such a cathode is referred to as a cold cathode. Although several mechanisms may eventually cause the cathode to become quite hot once it is operating.
Most cold cathode devices are filled with a gas which can be ionized. A few cold cathode devices contain a vacuum.
4.2 Light Emitting Diode (LED)
One of the cheapest and convenient ways to display information electronically is by using Light-Emitting Diodes (LEDs). It is basically a p-n junction photodiode when excited at forward-bias condition emits light (basic theory of LEDs are discussed in chapter on "Fiber Optic Measurements"). It can be easily interfaced with a simple electronic circuit and is durable and reliable. These LEDs are often arranged in different formats to display information. Among these, the seven segments configuration and dot matrix display are very common and widely used. The seven-segment configuration of an LED arranged in the form of the digit 8 can be restrictive in that it does not adequately allow the display of some alphanumeric characters. By contrast, the versatility of a dot-matrix arrangement allows an LED unit to display more complicated shapes. The following sections discuss the about seven-segment and dot-matrix LED display.
1. The Seven Segment Display
One common requirement for many different digital devices is a visual display. Individual LEDs can of course display the binary states, i.e. 'ON' or OFF'. But when some numbers or characters are to be displayed then some arrangement of the LEDs are required. One possibility is a matrix of LEDs in a 7 × 5 array. However, if only numbers are to be displayed then this becomes a bit expensive. A much better way is to arrange the minimum possible number of LEDs in such a way that it can represent a number requiring only 7 LEDs. A common technique is to use a shaped piece of translucent plastic to operate as a specialized optical fiber, to distribute the light from the LED evenly over a fixed bar shape. The seven bars are laid out as a squared-off figure "8". The result is known as a seven-segment LED.
Seven-segment displays having a wide range of applications. They used in clocks, watches, digital instruments, digital balances and many household appliances already have such displays.
There are basically two type of seven-segment displays-common cathode and common anode. The common-anode type is shown in FIG. 21 , where 'a', 'b', 'c', 'd', 'e', 'f' and 'g' represent individual LEDs which are arranged as shown in the figure. In order to display numbers often decimal point have to be displayed. For that, another LED has been added, which is represented by 'dp' (decimal point).
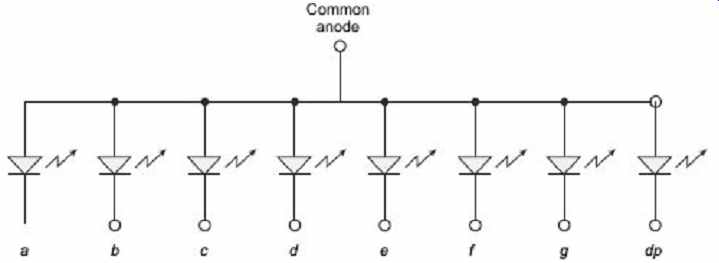
FIG. 21 Common anode connection of seven segment
display unit
A typical seven-segment display unit is shown in FIG. 22. FIG. 23 shows the pin diagram of a common anode type seven-segment display. That means that the positive leg of each LED is connected to a common point which is the Pin 3 in this case. Each LED has a negative leg that is connected to one of the pins of the device. To make it work, you need to connect the pin 3 to 5 volts. Then to make each segment light up, connect the ground pin for that LED to ground. A resistor is required to limit the current. Rather than using a resistor from each LED to ground, you can just use one resistor from V cc to the pin 3 to limit the current.
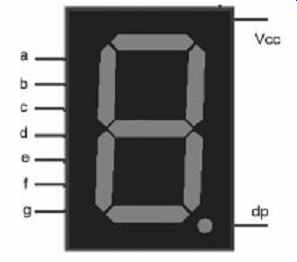
FIG. 22 Typical seven segment display unit
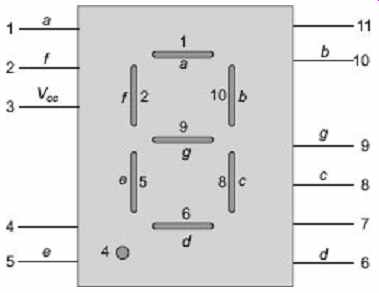
FIG. 23 Pin diagram of seven segment display unit
Table 1 shows how to form the numbers 0 to 9 and the letters A, B, C, d, E, and F.
'0' means that pin is connected to ground. '1' means that pin is connected to Vcc .
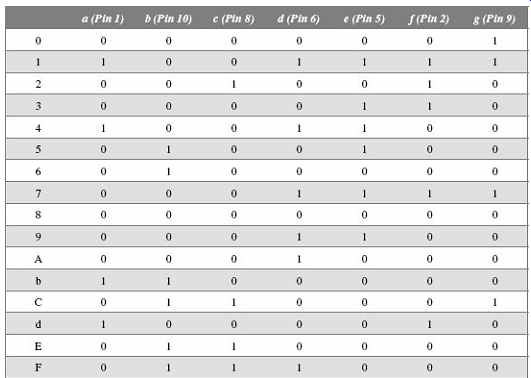
Table 1 Forming numbers and letters.
2. Dot Matrix Display
LEDs are arranged in matrix form-common configurations are 5 × 7, 5 × 8 and 8 × 8, as shown in FIG. 4. Based on the electrode connections, two kinds of LED matrices are possible, one is common anode. All the LEDs in a row having the anode are connected together. The other one is common cathode, having all LEDs in a row, the common cathode or cathodes are shorted. It is easier to understand the construction and interface capabilities of an LED matrix using an illustration. FIG. 24 depicts a matrix construction of the common-anode type. A single matrix is formed by thirty-five LEDs arranged in five columns and seven rows (5 × 7). The anodes of the fi ve LEDs forming one row are connected together. Similarly, the cathodes of the seven LEDs of a column are connected together. In this arrangement of LEDs, the cathodes are switched to turn the LEDs of a row on or off.
The matrix (unit) illustrated in FIG. 25 can be used to display a single alphanumeric character. Several such units can be placed next to each other to form a larger panel to display a string of characters.
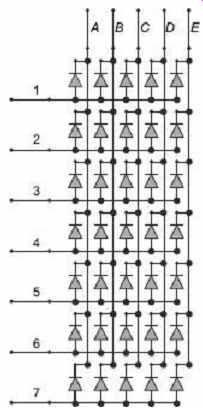
FIG. 24 LED Matrix with common-anode arrangement.
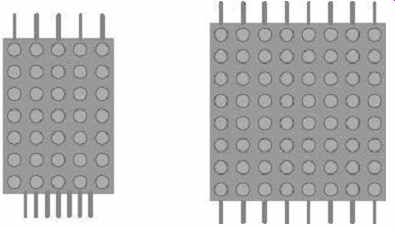
FIG. 25 5×7 and 8×8 dot matrix display
3. Display of Information using LED Matrix
From Figure 26 it is clear that switching/multiplexing of rows is required to display a character on the matrix unit. These are often done by using external hardware like latches.
Each row of the LED is driven for a brief period before switching to the next row. As the human eye retains a visual impression of an object for a short duration after the object is removed. Retention time depends on the brightness of the image. Due to this visual phenomenon termed persistence of vision, the human eye considers that the LEDs are glowing continuously and can visualize the characters.
Rapid switching between rows produces the illusion that all the rows are ON at the same time. To function as intended, two additional requirements must be met:
1. The LEDs must be overdriven proportionately or they can appear dim. The dimness occurs because a row is ON for only a fraction of time.
2. The rows must be updated often enough (e.g. each row is scanned about 30-40 times per second), to avoid display flicker. For actual character display, it is necessary to map the shape of the character to the 5x7 LED matrix. FIG. 26 illustrates the characters A and B.
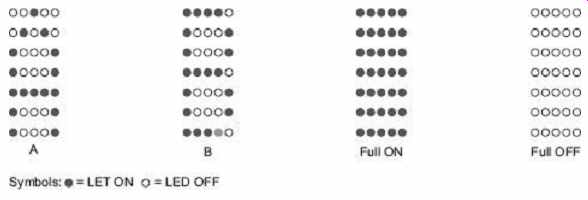
FIG. 26 Illustration of the Characters A and B
For any given character, a corresponding pattern of LED ON and LED OFF must be generated, for example, the character A, as displayed in the figure, is formed with the pattern shown in Table 2 .
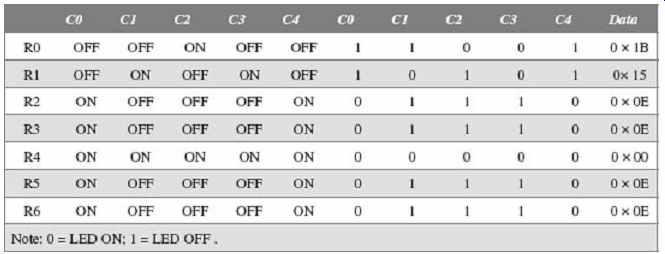
Table 2 Display Pattern for the Character A
Other characters/objects can be developed in a similar manner and stored in the memory to be used while displaying. By frequently switching the rows or columns with the proper selection of LED ON / OFF patterns, the human eye perceives the display as continuous.
4.3 Liquid Crystal Display (LCD)
The Liquid Crystal Display ( LCD) has been one of the enabling technologies of the current electronic revolution. It is an essential part of every mobile phone, every laptop and every personal organizer. Liquid crystal is an organic compound that polarizes any light that passes through it. A liquid crystal also responds to an applied electric field by changing the alignment of its molecules, and in so doing changing the direction of the light polarization that it introduces. Liquid crystals can be trapped between two parallel sheets of glass, with a matching pattern of transparent electrode on each sheet. FIG. 27 shows different layers of a typical LCD display. When a voltage is applied to the electrodes, the optical character of the crystal changes and the electrode pattern appears in the crystal. A huge range of LCDs has been developed, including those based on seven segment digits or dot matrix formats, as well as a variety of graphical forms. Many general-purpose displays are available commercially.
The liquid crystal fluid is the active medium that is used to create an image. It consists of a very large number of elongated crystals suspended in a fluid. This reservoir is sandwiched between two thin sheets of glass. Each piece of glass has a transparent conductive pattern bonded to it. The crystals are aligned in a spiral pattern until an electric field is impressed on the conductors.
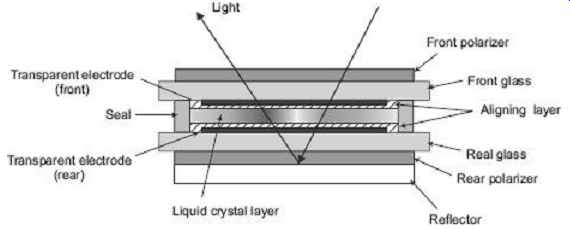
FIG. 27 Different layers of a typical LCD display
A sheet of polarizing material is bonded to the outside surfaces of both the front and rear glass covers. As incident light of random polarization enters the top polarizer, it is stopped except for that which is polarized in the proper direction. With no electric field applied, the light is twisted or its polarization is changed by the spiral pattern of the crystals. The bottom polarizer is aligned opposite of the top one but the "twisted" light is now aligned with the bottom polarizer and passes through. The display is now transparent and appears light.
A simple black-or-white LCD display works by either allowing daylight to be reflected back out at the viewer or preventing it from doing so-in which case the viewer sees a black area. The liquid crystal is the part of the system that either prevents light from passing through it or not.
The crystal is placed between two polarizing filters that are at right angles to each other and together block light. When there is no electric current applied to the crystal, it twists light by 90°, which allows the light to pass through the second polarizer and be reflected back. But when the voltage is applied, the crystal molecules align themselves, and light cannot pass through the polarizer: the segment turns black, this phenomena is shown in FIG. 28 .
Many other types of LCD displays are being developed for the laptop and CRT replacement market including full color versions. These include double and Triple Twisted Nematic (DSTN and TSTN) displays and the Active-matrix Thin-film Twisted Nematic and Metal-Insulated-Metal Twisted Nematic (TFT-TN and MIM-TN) displays.
Unfortunately, these advanced display are too expensive for most of the calculator market.
TN LCDs almost completely dominate today's calculator market due to their extremely
low power requirements, thin size and low cost.
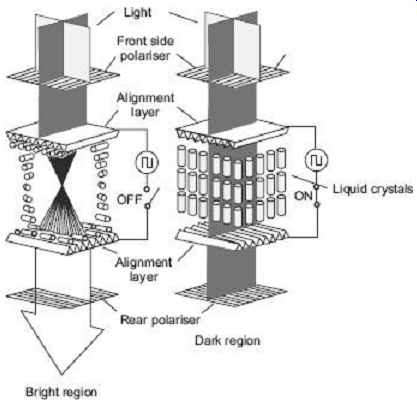
FIG. 28 Working principle of LCD
Table 3 Comparison of CRT and LCD
Cathode Ray Tubes Liquid Crystal Displays
Advantages
Fast response and high resolution possible Full color (large modulation depth of E-beam) Saturated and natural colors Inexpensive, matured technology Wide angle, high contrast and brightness
Advantages
Small in size Light weight (typ. 1/5 of CRT) Low power consumption (typ. 1/4 of CRT) Completely flat screen-no geometrical errors Crisp pictures-digital and uniform colors No electromagnetic emission Fully digital, signal processing possible Large screens (>20 inch) on desktops
Disadvantages
Large and heavy (typ. 70 × 70 cm, 15 kg) High power consumption (typ. 140W) Harmful dc and ac electric and magnetic fields Flickering at 50-80 Hz (no memory effect) Geometrical errors at edges
Disadvantages
High price (presently 3 × CRT) Poor viewing angle (typ. +/- 50 degrees) Low contrast and luminance (typ. 1:100) Low luminance (typ. 200 cd/m2)
4.4 Flat Panel Display
Flat-screen monitors, often termed Flat Panel Displays (FPDs), are becoming more and more popular, as they take up less space and are less heavy than traditional CRT monitors.
Other greater advantages of FPDs are they consume less energy when compared to CRT monitors, and also have less electromagnetic radiation. There are basically two types of Flat Panel Display (FPD)-the popular one is Liquid Crystal Display (LCD) and the other one is Plasma Display Panel (PDP).
The theory of Liquid Crystal Displays was discussed in the LCD section. Here, Plasma Display Panel (PDP) will be discussed in brief.
Plasma Display Panel (PDP)
A Plasma Display Panel ( PDP) is a type of flat panel display now commonly used for large TV displays (typically above 32"). It is often used in the home environment and is becoming increasingly popular in modern cultures.
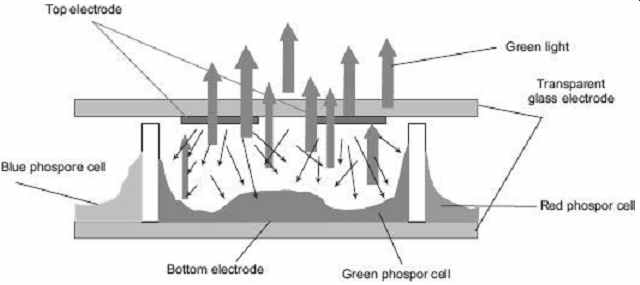
FIG. 29 Working principle of plasma display
A plasma display panel is based on emitting light by exciting gases. The gas used in plasma screens is a mixture of argon (90%) and xenon (10%). Gas is contained within cells, each one corresponding to a pixel that corresponds to a row electrode and column electrode, which excite the gas within the cell. A typical green color cell is shown in FIG. 29, where red and blue color cells are located nearby. By modulating the voltage applied across the top and bottom electrodes and by changing the frequency of excitation, the inert gas can be excited. The gas excited this way produces ultraviolet radiation (which is invisible to the human eye). With blue, green, and red phosphors distributed among the cells, the ultraviolet radiation is converted into visible light, so that pixels (made up of 3 cells) can be displayed in up to 16 million colors (256 × 256 × 256).
Plasma technology can be used to create large-scale high-contrast screens, but plasma screens are still expensive. What's more, power consumption is more than 30 times higher than for an LCD screen. A typical plasma TV of SAMSUNG Corp. is shown in Figure 30 .
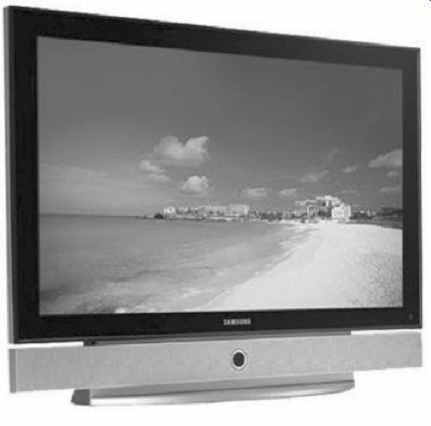
FIG. 30 Plasma TV [SAMSUNG Corp.]
4.5 Nixie Tube
Nixie tubes are nonplanar electronic devices that use the principles of glow discharge for displaying numerals or other information. These are actually gaseous glow tubes made of glass that contain two electrodes. The anode is in the form of a wire mesh and multiple cathodes that are shaped as numerals or other symbols that are to be displayed. When the cathode corresponding to the numeral to be displayed is activated, it gets surrounded by an orange gaseous glow discharge. The glass tube is generally filled with neon gas at low pressure, with a little mercury. The photograph of a Nixie tube is shown in FIG. 31.
When a sufficient potential of around 170 volts is applied between the selected cathode and the anode plate, the gas surrounding the selected cathode gets ionized and emits an orange glow. A Nixie tube should not be confused with a vacuum tube since operation of the Nixie tube does not depend on thermionic emissions of electrons from a heated cathode. The operating temperature of Nixie tube rarely exceeds 40°C. Nixie tubes are thus also called cold-cathode tube.
The most commonly available Nixie tube has ten cathodes in the shapes of the numerals 0 to 9, and may be a decimal point. These cathodes displaying different numbers are arranged one behind another. Thus, when the characters glow one at a time, each character appears at a different depth.
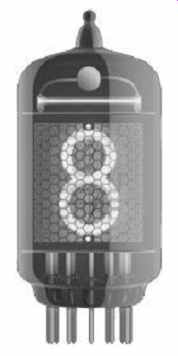
FIG. 31 Nixie tube
Nixie tubes were used in earlier days as display units in voltmeters, ammeters and other electrical and electronic measuring instruments.
QUIZ
Objective-type Questions
1. A strip chart recorder is a/an (a) analog recorder (b) magnetic tape recorder (c) oscillographic recorder (d) none of the above
2. Printing mechanism of a FAX machine is of (a) thermal type (b) impact type (c) electrostatic type (d) optical type
3. Which is not the function of data loggers? (a) Display (b) Online analysis (c) Reporting (d) Control
4. The bandwidth of a magnetic tape recorder is (a) higher than electronic recorder (b) higher than strip chart recorder (c) lower than strip chart recorder (d) higher than ultraviolet recorder
5. Power consumption of an LED display is (a) higher than LCD display (b) lower than LCD display (c) almost equal to LCD display (d) Approximately two lines higher than same size LCD
6. In a CRT, the electron beam is deflected by (a) electric field (b) magnetic field (c) both magnetic and electric field (d) gravitational field
7. Servo mechanism is used in (a) potentiometric type recorder (b) galvanometric type recorder (c) magnetic tape type recorder (d) ultraviolet recorder
8. The response time of CRT display is (a) higher that LCD display (b) lower than LCD display (c) higher than plasma display (d) lower than plasma display
9. The gas used in plasma screens is a mixture of (a) nitrogen and oxygen (b) nitrogen and xenon (c) argon and nitrogen (d) argon and xenon
10. Time scale of a strip chart recorder is controlled by (a) controlling speed of the chart paper (b) controlling the stylus drive mechanism (c) controlling the range selector (d) controlling the stylus

Short-answer Questions
1. Classify different types of recorders.
2. What are the different components of a strip chart recorder? Briefly discuss those.
3. Compare a potentiometric with galvanometric recorder.
4. State the working principle of ultraviolet recorders.
5. What are the advantages of a magnetic tape recorder over the other recording system?
6. Draw a functional block diagram of a data logger. Also discuss about each element.
7. Compare cold cathode display with hot cathode display.
8. How Does a simple black-and-white LCD display work?
9. State the working principle of plasma display.
10. How are characters displayed in an LED dot matrix display unit?