AMAZON multi-meters discounts AMAZON oscilloscope discounts
1. INTRODUCTION TO RF AND WIRELESS COMMUNICATION SYSTEM
Radio frequency (RF) is any frequency within the electromagnetic spectrum associated with radio-wave propagation. When an RF current (input signal) is supplied to an antenna, an electromagnetic field is created that is then able to propagate through space. RF field propagation technology is used in many wireless technologies.
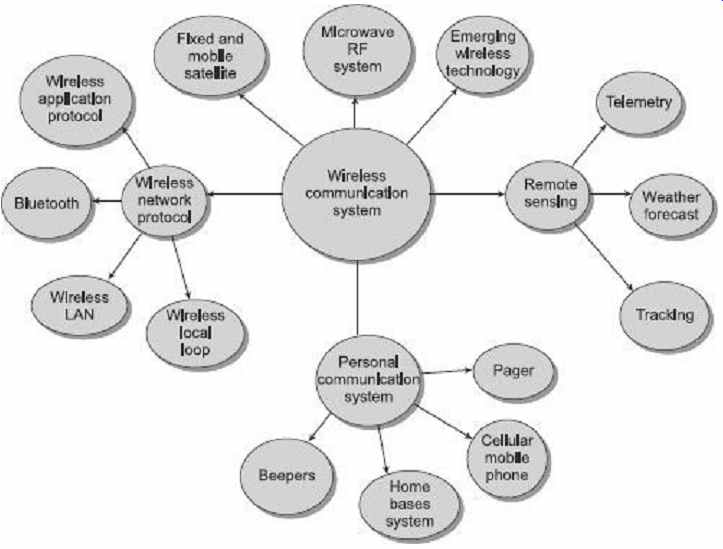
FIG. 1 Different forms of RF based wireless communication systems
RF is similar to that of wireless and high-frequency signals. However, RF has frequencies ranging from a few kHz to roughly 1 GHz. This range extends to 300 GHz by considering microwave frequencies as radio frequency.
Many of the wireless devices make use of RF fields, for example satellite communications systems, cordless and cellular telephone, radio and television broadcast stations, all operate in the RF spectrum. Some wireless devices operate at IR or visible-light frequencies, whose electromagnetic wavelengths are shorter than those of RF fields.
Wireless communication can be defined as the transfer of information over a distance without the use of electrical conductors or wires. The distance for wireless communication may be small or large depending on the distance of communication. For example, a television remote control requires a shorter distance whereas radio communications requires a longer distance and may be thousands of kilometers long.
In wireless communication systems, wider bandwidths, larger signal dynamics and higher carrier frequencies are applied in order to fulfill the demand for higher data rates.
Since the RF technology is, consequently, pushed to its operation boundaries, the intrinsic imperfections of the RF IC technology are more and more about governing the system performance of wireless modems. For RF based wireless communication, higher and even higher frequencies are always desired. This is due to the reason that higher frequencies include efficiency in propagation, immunity to some forms of noise and impairments as well as the size of the antenna required. The height of the antenna is determined on the basis of wavelength of the signal and is usually selected as one fourth of the wavelength of the signal.
During transmitting of the signal, there are always losses due to spreading of the RF energy as it propagates through free space. This space loss can be represented as where, Pt is the power of transmitter antenna, P r is the power of receiving antenna R is the distance between two antennas.
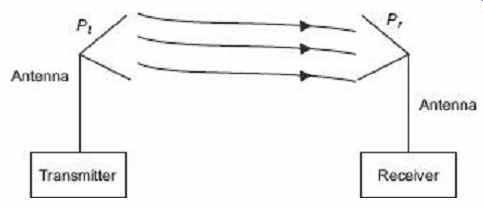
FIG. 2 The simplified block diagram of the wireless
communication system
The purpose of using of high frequencies in communication is to reduce the antenna size, increase efficiency in propagation and improve the signal-to-noise ratio. According to the following relation, As frequency and wavelength are inversely proportional, we require high frequencies to reduce the antenna size.
2. RADIO FREQUENCY AND MICROWAVE SPECTRAL ANALYSIS
The display of electromagnetic radiation as a function of wavelength is termed as electromagnetic spectrum. Based upon the wavelengths, the spectrum is divided into various frequency bands as shown in FIG. 3.
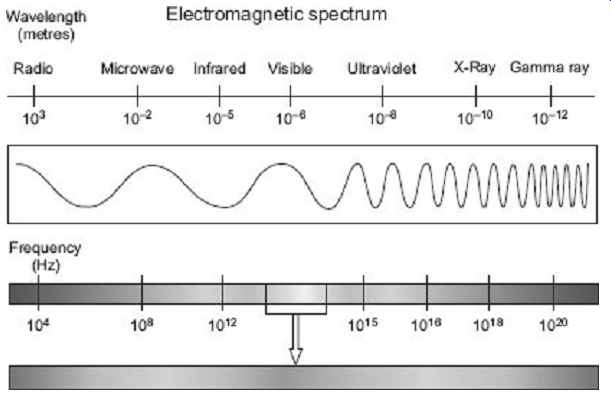
FIG. 3 Different electromagnetic wave spectra
From FIG. 3, Radio Frequency (RF) are electromagnetic waves with wavelengths of 100 km to 1 mm, which is a frequency of 300 Hz to 3000 GHz. The microwave frequencies are electromagnetic waves with wavelengths ranging from as long as one meter to as short as one millimeter, or with frequencies between 300 MHz (0.3 GHz) and 300 GHz.
With the rapid advance of wireless technology and satellite sensor technology, there is a need for more and more accurate field measurements to complement overhead data in providing higher spectral resolution over progressively broader wavelength. In spectral analysis, the following factors are considered.
Power in band Occupied bandwidth Adjacent channel power Resolution bandwidth Harmonic distortion Noise specification
2.1 Power in Band
It is the measurement of total power within any specified frequency range or band. Power in band is calculated by the following equation:
Power in band=
where, X is the input power spectrum from a specified band, fl is the low bound of the frequency band, and f h is the high bound of the frequency band. The low and high bounds of this band can be determined from the center frequency.
2.2 Occupied Bandwidth
It is the measurement of frequency band or bandwidth that contains a specified percentage of the total power of the signal. Occupied bandwidth is the inverse of power in band.
For example, if the specified percentage is 99 then the occupied bandwidth is the bandwidth that contains 99% of the total power of the signal. That is the frequency range in between the vertical lines, as shown in FIG. 4 .
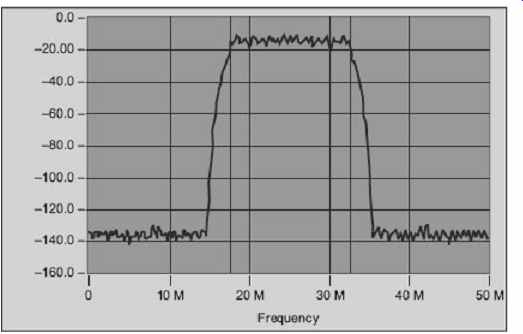
FIG. 4 Spectrum of an RF signal
2.3 Adjacent Channel Power
It basically measures the way a particular channel and its two adjacent channels distribute power. This measurement is performed by calculating the total power in the channel and also the total power in the surrounding upper and lower channels.
2.4 Resolution Bandwidth
It is determined by the smallest frequency that can be resolved. In Fourier-transform-based spectrum analyzers, the resolution bandwidth is inversely proportional to the number of samples acquired or the length of the window function. By taking more samples in the time domain or making the acquisition time longer, while keeping the sampling rate the same, the RBW will be lowered, meaning higher frequency resolution.
2.5 Harmonic Distortion
It is a measure of the amount of power contained in the harmonics of a fundamental signal. Harmonic distortion is inherent to devices and systems that possess nonlinear characteristics-the more nonlinear the device, the greater its harmonic distortion. When a signal of a particular frequency f1 passes through a nonlinear system, the output of the system consists of f1 and its harmonics f2 and f3 . FIG. 5 demonstrates this relationship.
Harmonic distortion is expressed as either power or as percentage ratio, where harmonic power distortion is P HD , which is obtained from where, P HD is the power of the harmonic distortion in dBc, P fund is the fundamental signal power in dB or dBm, and P harm is the power of the harmonic of interest in dB or dBm.
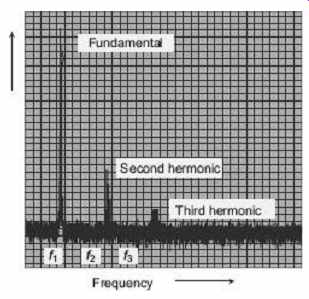
FIG. 5 Fundamental frequency f1 with second
and third harmonics
To represent in the form of percentage ratio, it is converted into voltage, and calculated using the following equation.
where V harm and V fund are the harmonic voltage and fundamental voltage respectively, In some applications, the harmonic distortion is measured as a Total percentage Harmonic Distortion (THD). This measurement requires the power summation of all the harmonics in the spectrum band, as defined in the following equation:
2.6 Phase Noise
There are various sources of noise. When the carrier signal contain noise due to phase and frequency modulation of the signal then the noise is termed phase noise. The spectrum of phase noise is normally close to the carrier spectrum, and is measured in decibels relative to the carrier frequency (dBc).
Noise floor is a specified noise level below which signals cannot be detected, under a specific measurement conditions.
3. RADIO FREQUENCY SPECTRUM ANALYSER
Analyzing signals in terms of their frequencies is called spectrum analysis . The spectrum analyzer can measure the frequencies present in a complex signal or the frequencies resulting from modulation on a carrier.
The spectrum analyzer is a measuring instrument that displays frequency components of a signal. Each frequency component contained in the input signal is displayed as a signal level corresponding to that frequency. The vertical scale displays the amplitude of each component, and the chosen frequency band is displayed horizontally.
Spectrum Analyzers (SA) are useful as electronic test equipment used in design test and maintenance of radio-frequency circuitry and equipment. A spectrum analyzer works similar to that of an oscilloscope, as a basic tool used for observing signals. The only difference between the two is that where an oscilloscope looks at signals in the time domain, spectrum analyzer looks at signals in the frequency domain.
A common spectrum analyzer has the following features:
Frequency tuning range-Measurement range of the analyzer so that all of the frequency components of the signal can be measured.
Frequency accuracy and stability-To be more stable and accurate than the signal to be measured.
Sweep width-The frequency band over which the unit can sweep without readjustment.
Resolution bandwidth-Need to be strong enough to resolve different spectral components of the signal.
Sensitivity and/or noise figure-To observe very small signals or small parts of large signals.
Sweep rate-Maximum sweep rate is established by the settling time of the filter that sets the resolution bandwidth.
Dynamic range-The difference between the largest and smallest signal the analyzer can measure without readjustment.
Phase noise-A signal with spectral purity greater than that of the analyzer conversion, oscillators cannot be characterized.
There are basically two types of spectrum analyzers-analog type and is digital-type spectrum analyzers:
An analog spectrum analyzer-uses either a variable band-pass filter whose mid-frequency is automatically tuned (shifted, swept) through the range of frequencies of which the spectrum is to be measured or a super-heterodyne receiver where the local oscillator is swept through a range of frequencies.
A digital spectrum analyzer computes the Discrete Fourier Transform (DFT), a mathematical process that transforms a waveform into the components of its frequency spectrum.
Super-Heterodyne Analyzer (SPA)
The working principle of a super-heterodyne type analyzer is very similar to an AM or FM radio receiver. In SPA, the incoming RF signal is first moderately amplified with user-adjustable gain factor and then sent to the one input of a mixer which acts like an analog multiplier. The output signal of a local oscillator as shown in FIG. 6 , goes to other input of the mixer and then the output of the mixer is the sum and difference frequency between RF and local oscillator. This signal then goes to the Intermediate Frequency (IF) port of the mixer. This IF signal is subsequently band filtered, rectified and sent to the vertically deflecting plates of the Cathode Ray Tube (CRT) in the SPA. The functional block diagram of a simple Super-Heterodyne Analyzer (SPA) is shown in FIG. 6.
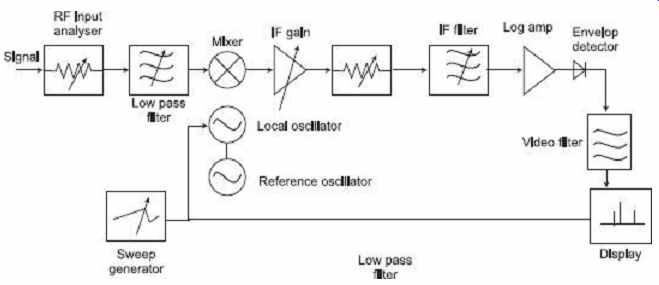
FIG. 6 Functional block diagram of a simple
super-heterodyne (SPA) analyzer
4. RF SCALAR AND VECTOR NETWORK ANALYSER
The RF network analyzer is an active test instrument which generates a signal that is applied to the device under test, and then it measures the response.
The different functional elements of a common RF network analyzer are the following:
(a) Signal Separation The signal separation element is often called test set. It provides two functions:
Measure a portion of incident signal for rationing. This may be accomplished using a splitter or directional coupler.
Separate the incident (forward) and reflected (reverse) travelling waves at the input of DUT.
(b) Receiver and Signal Detection
When the signal is passed through the device under test and separated from the source signal, it is processed in the RF network analyzer so that the results can be gained. The first stage consists of a radio receiver with a demodulator or detector. Typically, a tuned radio receiver is used to provide the best sensitivity, dynamic range as well as harmonic/spurious signal rejection.
(c) Processor and Display
The processed RF signals from the receiver and detector section are displayed in a format that can be interpreted.
4.1 Different Types of RF Analyzers
There are different types of network analyzers which are able to measure the parameters of the RF components and devices in different ways. Based on this network, analyzers can be classified as
1. Scalar network analyzer
2. Vector network analyzer
1. Scalar Network Analyzer (SNA)
The Scalar Network Analyzer (SNA) is used to measure frequency response of any device or a system. It basically consists of two components: (i) sweep generator, and (ii) spectrum generator. The sweep generator generates constant amplitude sinusoid with varying frequency starting from low to high. The minimum (low) and maximum (high) value of the frequency and the time to increase from minimum to maximum frequency are user-configurable.
The spectrum analyzer plots the frequency contents of the input signal. Now, if the output of the sweep generator is connected to the input of the spectrum analyzer then the spectrum analyzer will show a constant horizontal line on the screen. As the amplitude of all the harmonics of the sweep generator output signal are same, the line will shift vertically if the amplitude of the sweep generator output signal is increased. Now if a device under test whose frequency responses are to be obtained is placed in between the sweep generator and spectrum analyzer, meaning output of sweep generator is connected to the input of the device and output of the device is connected to the input of the spectrum analyzer, the spectrum analyzer will directly display the frequency response of the device. The straight line cannot be seen on the spectrum analyzer screen if the response of the device changes the sweep generator output according to the frequency and the response of the device at that frequency.
2. Vector Network Analyzer (VNA)
A Vector Network Analyzer ( VNA) works in similar fashion as the scalar network analyzer, the difference being that it can measure amplitude as well as phase of an RF signal. That is why it is called VNA. The sweep frequency range can be adjusted by the user. The VNA measures the frequency response of the device under test over the adjusted range of sweep frequency. First, the VNA is used to measure the incident test signal from the sweep generator (which is a constant line on the screen), then the reflected signal from the test device, by using directional coupler as shown in FIG. 7 , and after that the transmitted signal from the RF device under test. Then the VNA automatically reverses the connections to measure the same quantities looking into the device from the opposite direction. After completion of the process, the VNA displays these measured quantities as a function of frequency.
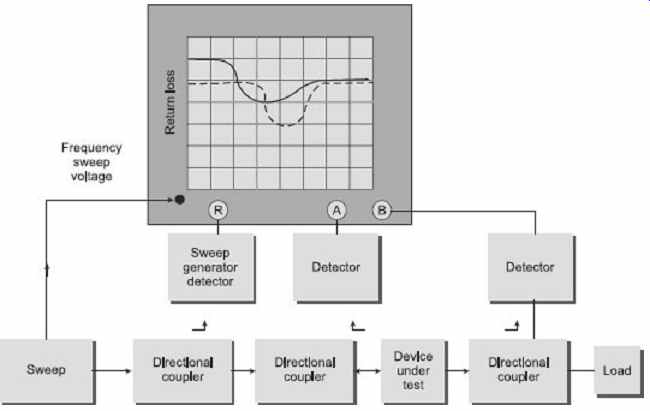
FIG. 7 Functional block diagram of a Vector
Network Analyzer (VNA)
The VNA is a common device required for RF design applications. The device is often used to characterize RF device performance in terms of network scattering parameters, or S parameters.
5. MODULATION
Modulation is defined as the process in which some characteristic parameters of a high frequency signal is varied according to the message signal. The lower frequency signal is called the modulating signal , the higher frequency signal is called the carrier , and the output signal is called the modulated signal .
According to the modulation process, modulation is of two types-analog modulation and digital modulation, discussed in the following subsections
5.1 Analog Modulation
In analog modulation, characteristic parameters of a high-frequency sinusoidal signal (called carrier signal) is varied according to the message signal, called analog modulation.
Generally, the carrier is represented as where A c is the amplitude, f c is the frequency and j is the phase.
The three characteristic parameters of the carrier signal are amplitude, phase and frequency, and these can be varied according to the message signal. So, analog modulation techniques are classified into three types. They are Amplitude modulation Phase modulation Frequency modulation
1. Amplitude Modulation (AM)
Amplitude modulation means modulating the amplitude of the given signal. In amplitude modulation, the amplitude of the carrier signal is varied in accordance to the instantaneous amplitude of the modulating signal. The complex envelop of an AM signal is given by where, the constant A has been included to specify the power level and m ( t ) is the modulating signal (may be analog or digital). This equation reduces to the following for AM signal:
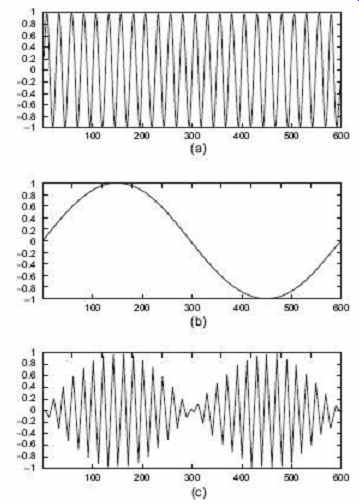
FIG. 8 (a) Original message signal (b) modulating
signal and (c) the signal after AM
FIG. 8 shows the modulating signal and the signal after AM.
2. Phase Modulation (PM)
The phase modulation is defined as a process in which the phase of the carrier is varied linearly according to the message signal. If m ( t ) is the message signal (or the modulation signal) to be transmitted with the help of a carrier signal of amplitude ac, frequency w C and phase angle f C , then the time domain equation of the phase modulated signal will become and the message signal, carrier signal and modulated signal are shown in FIG. 9 .
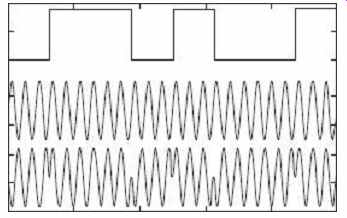
FIG. 9 Message signal, carrier signal and modulated
signal
3. Frequency Modulation (FM)
Frequency modulation means modulating the frequency of the signal, by change in carrier frequency. Frequency of carrier signal is varied by the amplitude of message signal.
Frequency modulation has many attractive improvements over amplitude modulation. It offers the advantage of almost total immunity from noise interference as it eliminates the problem of fading, which is pronounced in amplitude modulation.
Information signal = m ( t ) Carrier signal = A C cos(2 π c t )
k is the frequency deviation constant (Hz/volt) that represents the maximum shift of signal frequency from the carrier frequency in one direction
FIG. 10 shows the time domain frequency modulated signal. The figure demonstrates how a message signal modifies the frequency of a carrier signal in FM.
AM modulation requires less bandwidth when compared to FM modulation. But FM modulation requires less power when compared to AM modulation.
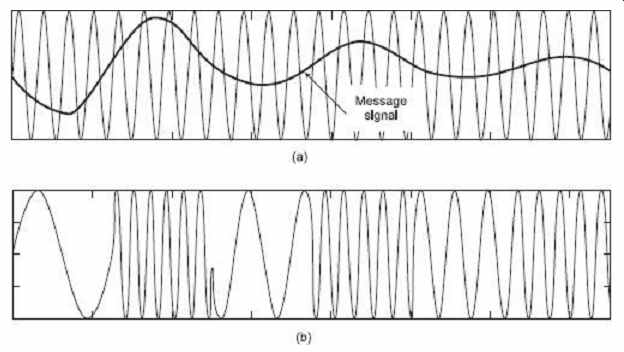
FIG. 10 Carrier wave with message signal, (b)
Frequency modulated signal
5.2 Digital Modulation
The digital-modulation process involves switching or keying the amplitude, frequency or phase of the carrier according to the incoming data. The input to the digital modulators is in binary digits based upon the keying these techniques are divided into three types:
1. Amplitude Shift Keying (ASK)
2. Frequency Shift Keying (FSK)
3. Phase Shift Keying (PSK)
By digital modulation, we can convey a large amount of information as compared to analog modulation and they also provide more information capacity, compatibility with digital data services, higher data security, better quality communications, and quicker system availability.
1. Amplitude Shift Keying (ASK)
In ASK, the amplitude of the carrier is changed according to the modulating waveform which is a digital signal (bit). The level of amplitude can be used to represent binary logic 0s and 1s. Here, two states of the carrier signal is considered, i.e. ON or OFF. In the modulated signal, logic 0 is represented by the absence of a carrier, thus it is said to be an OFF/ON keying operation. ASK demonstrates poor performance, as it is heavily affected by noise and interference. Mathematically it can be represented as;
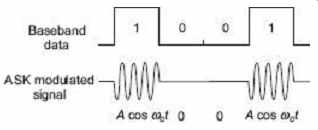
FIG. 11 ASK modulated signal
2. Frequency Shift Keying (FSK)
In FSK, the frequency of the carrier is changed according to the modulating waveform which is a digital signal. The simplest FSK is binary FSK ( BFSK). BFSK literally implies using a couple of discrete frequencies to transmit binary (0s and 1s) information. With this scheme, the "1" is called the mark frequency and the "0" is called the space frequency.
Mathematically it can be represented as ...
Early telephone-line modems used audio frequency-shift keying to send and receive data, up to rates of about 300 bits per second. FIG. 12 shows the FSK message signal, carrier signal and modulated signal.
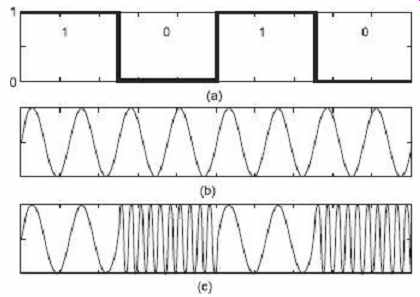
FIG. 12 (a) Message signal (b) carrier signal
(c) FSK modulated signal
3. Phase Shift Keying (PSK)
In PSK, the phase of the carrier is changed according to the modulating waveform which is a digital signal. PSK uses a finite number of phases; each assigned a unique pattern of binary bits. Usually, each phase encodes an equal number of bits. Each pattern of bits forms the symbol that is represented by the particular phase.
Mathematically it can be represented as...
...where f c is the frequency of the carrier wave, and E b and T b are energy per bit and bit duration respectively.. FIG. 13 shows the message signal and PSK modulated signal PSK has better power and frequency efficiencies compared to ASK and FSK.
PSK achieves small Bit Error Rate (BER) for the same C / N (carrier-noise ratio).
PSK has constant envelope, and is robust to time-varying fading channel.
PSK is popularly used in many communication systems such as satellite and mobile communication systems.
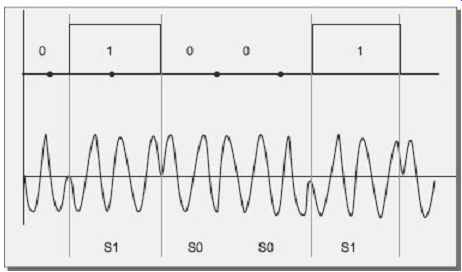
FIG. 13 Message signal and PSK modulated signal.
5.3 Modulation Measurement
Two different types of modulation measurements are developed in order to take into account both the amplitude, and phase noise on the carrier. They are Modulation Error Ratio (MER) and Error Vector Magnitude (EVM). Error vector magnitude and modulation error ratio express same kind of information and are closely related to each other. In other words, we can say that there is a one-to-one relationship between the two types of measurements.
In a digital system, Modulation Error Ratio (MER) is similar to Signal-to-Noise or Carrier-to-Noise used in analog systems. As compared to EVM, MER is easier to understand as it relates directly to the S/N (signal to noise). The amount of the margin the system has before failure can be determined by determining the MER (modulation error ratio) of a digital signal. At the time of system failure, MER is more advantageous as compared to analog systems as poor MER is not noticeable on the picture right up. On the other hand, in analog systems degradations in carrier to noise performance can be seen.
In analog systems, carrier-to-noise ratio is simply a measure of the ratio of peak video carrier power over the noise in the channel, over the system bandwidth expressed in dB.
For this type of measurement, we can also use digital channels, but unfortunately they do not provide the complete picture and due to this reason, we have to go for MER and EVM.
MER and EVM can be directly correlated with each other since they are essentially the same measurement; the only difference is on specification and performance. MER and EVM can be considered a figure of merit for the QAM signal that includes all types of impairments, not just noise as in carrier-to-noise in analog systems.
FIG. 14 shows the ideal and measured location, where, v is the ideal symbol vector, w is the measured symbol vector, q is the phase error, ( e = w - v ) is the magnitude error vector, and e / v is the EVM.
This quantifies, but does not necessarily reveal, the nature of the impairment. To remove the dependence on system gain distribution, EVM is normalized by | v |, which is expressed as a percentage. Analytically, rms value of EVM over a measurement window of N symbols is defined as
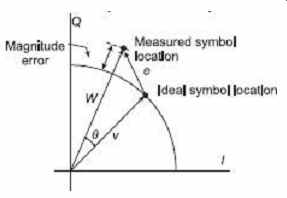
FIG. 14 Ideal and measured location
MER is defined as follows:
MER = 10 log (rms error magnitude / average symbol magnitude) measured in dB
6. COMMUNICATION SYSTEMS
Communication is the process of transferring information from one place to another. The information generated at source is transferred to the receiver through communication channel.
The basic electronic communication system can be shown in FIG. 15 as follows;
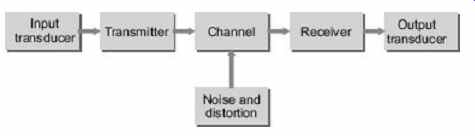
FIG. 15 Block diagram of a basic communication
system
On the source side, there is a transmitter device that makes the input electrical information suitable for efficient transmission over a given channel. In general, a transmitter modulates amplitude or frequency of a high-frequency carrier wave by an original electrical information signal which is known as the baseband signal . On the destination side, the receiver is the device that receives information from the channel and demodulates the electrical signal from it. The receiver also amplifies and removes noise and distortion from the noise contaminated received signal. The output transducer converts electrical signal from the receiver output to a form of message as required by the user. Communication can be made in two forms-analog communication and digital communication.
RF Communication System Components
The RF communication system consists of various components and each performs different functions as listed below:
PLO: Generates the RF carrier at the required frequency Modulator: Varies the frequency, amplitude, or phase of an IF carrier to put information onto it Upconverter: Shifts the modulated IF signal to RF signal Power amplifier: Increases the power level of the modulated RF carrier TX antenna: Transmits the RF carrier in the direction of the receiver RX antenna: Collects the transmitted RF signal at the receiver RF filter: Allows only a specified range of RF frequencies to pass and blocks all other frequencies LNA: Amplifies the weak received RF carrier Mixer and IF amplifier: Shifts the RF carrier to a lower frequency below the RF band and amplifies it to a level where it can be demodulated Demodulator: Removes the information from the low-frequency carrier An RF communication system block diagram is shown in FIG. 16.
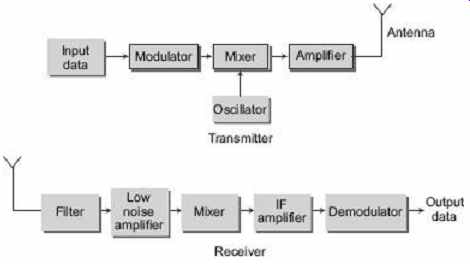
FIG. 16 RF communication system
It applies to any type of wireless RF communication system: cellular phone, wireless LAN, satellite communications system. Any RF communication system must contain all of the devices shown though performance requirements of each device vary from system to system.
7. RF VOLTAGE AND POWER MEASUREMENT
A system's output power level is frequently the critical factor in the design, and ultimately the performance of almost all radio frequency and microwave equipment. Measurement uncertainties cause ambiguities in realizable performance of a transmitter.
For the measurement of average power, a sensor along with a calibrated power meter is connected with the RF transmitter. Initially, if the output of the sensor is switched off/not allowed to enter into the power meter, the pointer of the power meter is set to zero. Then the sensor is switched on and the indication on the power meter is observed, which indicates the average power of the transmitter.
For design and application of an RF and microwave system, it is necessary to determine the power. Average power is very popular and used in specifying almost all RF and microwave systems. It is necessary to determine power level. Generally, there are three methods for measuring power at RF and microwave frequencies. Each of these methods uses different kinds of devices to convert RF power to measurable dc or low frequency signal. The methods are as follows:
1. By using a thermistor
2. By using a thermocouple
3. By using a diode detector
7.1 Power Measurement Using a Thermistor
From early times, for the measurement of RF/microwave power, bolometer sensors, especially thermistors, are being used. Presently, thermocouple and diode technologies have captured the bulk of those applications because of their increased sensitivities, wider dynamic ranges and higher power capabilities. For certain applications, a thermistor is still the sensor of choice due to its power substitution capability.
The bolometer is a temperature-sensitive resistive element, whose resistance varies due to change in temperature. The change in temperature results from converting RF or microwave energy into heat within the bolometric element. Basically, two types of bolometers are used-one is the barretter and the other is the thermistor. A barretter is a thin wire that has a positive temperature coefficient of resistance, which is not commonly used now. Thermistors are semiconductors with negative temperature coefficient.
7.2 Power Measurement Using a Thermocouple
Thermocouples work on the principle based on dissimilar metals generating a voltage due to temperature differences at hot and a cold junction of the two metals.
The two main reasons for evolution of thermocouples are:
1. They exhibit higher sensitivity than previous thermistor technology.
2. They feature an inherent square-law detection characteristic (input RF power is proportional to dc voltage out).
Since thermocouples are heat-based sensors, they are true "averaging detectors." This recommends them for all types of signal formats from CW to complex digital-phase modulations. They are more rugged than thermistors, make useable power measurements down to 0.3 mW (-30 dBm, full scale), and have lower measurement uncertainty because of better SWR.
7.3 Power Measurement Using a Diode Detector
Diodes convert high-frequency energy to dc by way of their rectification properties, which arise from their nonlinear current-voltage ( I - V ) characteristic.
Rectifying diodes have been used as detectors and for relative power measurements at microwave frequencies. For absolute power measurement, however, diode technology had been limited mainly to RF and low microwave frequencies.
7.4 Measuring RF Voltages with a Voltmeter
To measure RF voltages ranging from few hundred millivolts to several hundred millivolts, a voltmeter uses diode detectors. Generally diode detectors fallow inverse square law below 100V. So by taking the advantage of inverse square law, power detectors or voltage detectors are designed.
To achieve best sensitivity, a diode should be matched as closely as possible to source impedance. Simple diode detectors are used for designing RF voltmeter to measure voltages from 100 mV to several hundred mV. In the design of voltmeter , two types of diode detectors are used .
1. Series detector
2. Shunt detector
Out of these, shunt detectors are mostly suitable for measuring RF and microwave voltages. In this case, diodes are directly connected to ground as shown in FIG. 17.
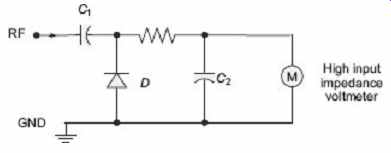
FIG. 17 Circuit diagram of a shunt type detector
In FIG. 17 (shunt detector), the diode is connected in shunt and it is grounded. The design components should have short leads to avoid any error readings and a termination resister is connected across the input to measure output of amplifier and signal sources. A small silicon diode is readily available but germanium diodes will give low offset voltages. In order to remove these offset voltages, a battery and resister (high value) is connected in the circuit.
QUIZ
Objective-type Questions
1. The bandwidth of RF including microwave is approximately (a) 20 Hz to 20 kHz (b) 1 kHz to 300 GHz (c) 3 GHz to 3000 GHz (d) 3 Hz to 300 MHz
2. Identify the wrong statement.
(a) Power in band is the measure of total power within a specified frequency range.
(b) Occupied bandwidth measures bandwidth that contains total power of the signal.
(c) Adjacent channel power measures the way a particular channel and its two adjacent channels distribute power.
(d) Resolution bandwidth measures the smallest frequency that can be resolved.
3. In Fourier transform-based spectrum analyzers, the resolution bandwidth is (a) proportion to the length of window function (b) inversely proportional to the sampling frequency (c) inversely proportional to the length of the window function (d) proportional to the sampling frequency
4. Phase noises are due to (a) modulation of the signal with carrier signal (b) noise from other signals (c) noise due to change of phase during reflection (d) noise due to change of phase during transmission in different medium
5. In the sweep generator, if the output is connected to the input of a spectrum analyzer then (a) a single vertical can be observed (b) a single horizontal line can be observed (c) a sawtooth wave can be observed (d) lot of random lines can be observed
6. Identify the correct statement.
(a) Carrier frequencies of FM signals are relatively lower than AM signals.
(b) Antennas for FM signals are larger in size than AM antennas.
(c) FM signals can travel longer distance than AM signals (d) FM signals are more immune to noise than AM signals
7. This is not a digital modulation technique:
(a) Amplitude shift keying (b) Phase shift keying (c) Frequency shift keying (d) Pulse shift keying
8. The sensor used for RF power measurement (a) Thermocouple (b) Microphone (c) Strain gauge (d) Photodiode
Short-answer Questions
1. Why is spectral analysis important in RF communication system? What are the main different factors being measured? Define each factor.
2. How are the power in band and occupied-band width interrelated? Explain in brief. How is the adjacent channel power measured?
3. How is the harmonic distortion calculated? State the possible sources of phase noise.
4. What are different features a typical spectrum analyzer must have? What are the different types of spectrum analyzer being used?
5. State the working principle of a super-heterodyne-type spectrum analyzer.
6. How does a vector network analyzer work? Write down some of its applications
7. What are the different analog-modulation techniques used in communication? Compare each of them with one another.
8. What are the different digital-modulation techniques used in communication? Compare each of them with one another.
9. How can a diode be used for measurement of RF power? Compare the bolometer with thermocouple based RF power meter
10. Explain the RF voltage measurement techniques with a proper circuit diagram.