AMAZON multi-meters discounts AMAZON oscilloscope discounts
1. History
Very fast transmission line pulse (VF-TLP) became popular to quantify the electrostatic discharge (ESD) robustness for short pulse event. This method is in the "adiabatic regime" of the Wunsch-Bell power-to-failure curve, where in contrast, the electrical overstress (EOS) events of interest are in the "steady-state" time-independent region of the Wunsch-Bell power-to-failure curve.
After completion of the standard and standard practice for the transmission line pulse (TLP) test, the new methodology for the VF-TLP was initiated.
Today, there is a standard test method for the VF-TLP test methodology. The standard practice for VF-TLP test simulation is supported by the ESD Association (ANSI/ESD--ESD-SP 5.5.2--2007).
FIG. 1 illustrates the evolution of the VF-TLP method. The method will be extended to applications to radio frequency (RF) technology, to ultrafast transmission line pulse (UF-TLP), to methods combining TLP and VF-TLP for Wunsch-Bell plot development.
2. Scope
The scope of the VF-TLP ESD test is for the testing, evaluation, and classification of components and micro- to nano-electronic circuitry. The test is to quantify the sensitivity or susceptibility of these components to damage or degradation to the defined VF-TLP test.
3. Purpose
The purpose of the VF-TLP ESD test is for establishment of a test methodology to evaluate the repeatability and reproducibility of components to a defined pulse event in order to classify or compare ESD sensitivity levels of components .
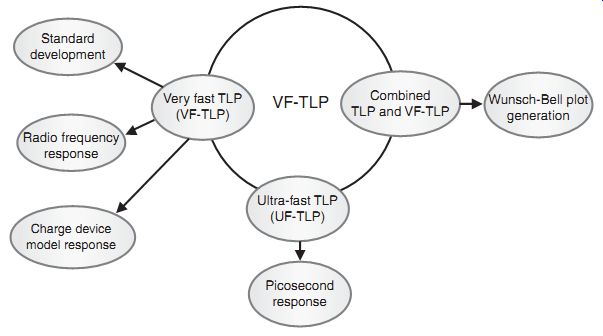
FIG. 1 Very fast TLP testing overview
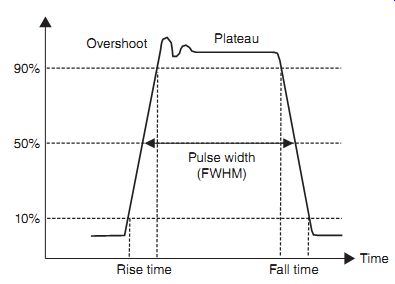
FIG. 2 Very fast transmission line pulse (VF-TLP) pulse waveform
4. Pulse Waveform
TLP testing provides a square pulse from the TLP source. The VF-TLP test system source can provide different pulse widths, rise times, and fall times. For the semiconductor industry, the VF-TLP standard was developed with a fixed pulse width for comparison of TLP testing results. The TLP results change with different pulse characteristics.
FIG. 2 shows the VF-TLP pulse waveform characteristics. The waveform characteristic can be defined by specific parameters:
• Pulse plateau
• Pulse width
• Rise time
• Fall time
• Maximum peak current overshoot
• Maximum current ringing duration
• Maximum peak voltage overshoot
• Maximum voltage ringing duration
• Measurement window.
Pulse plateau: The plateau of the pulse is the maximum value in the measurement window. The plateau is a time-averaged value after the overshoot and the oscillation region.
Pulse width: The pulse width is defined as the full width half maximum (FWHM). This is measured at 50%magnitude. For the VF-TLP standard, this defined as 10 ns . The reason with this pulse width is to make the timescale of the VF-TLP waveform equivalent to the timescale of a charged device model (CDM).
Rise time: The rise time is defined as the time it takes to rise from the 10-90% of the pulse plateau. For the VF-TLP standard, the rise time of 1 ns is used .
Fall time: The fall time is defined as the time it takes to fall from the 90-10% of the pulse plateau. For the VF-TLP standard, the fall time is equal to or greater than the rise time. For the VF-TLP standard, the fall time of 1 ns or greater is used.
Maximum peak current overshoot: The maximum peak current overshoot is defined as the magnitude of the overshoot peak current above the current plateau. The VF-TLP standard states that this should be less than 20% of the plateau current. This is defined into a short circuit.
Maximum current ringing duration: The maximum current ringing duration is defined as the length of time between the beginning of the current pulse and the time that the ringing reaches less than 5%of the plateau current. For the VF-TLP standard, the maximum current ringing duration should be less than 25% of the pulse width.
Maximum peak voltage overshoot: The maximum peak voltage overshoot is defined as the magnitude of the overshoot peak voltage above the voltage plateau. The VF-TLP standard states that this should be less than 20% of the plateau voltage. This is defined into an open circuit.
Maximum voltage ringing duration: The maximum voltage ringing duration is defined as the length of time between the first overshoot beyond the plateau voltage to the time it reaches 5% of the plateau voltage. For the VF-TLP standard, the maximum voltage ringing duration should be less than 25% of the pulse width.
Measurement window: The measurement window is the range of time within the pulse width where the voltage and current can be measured and extracted in the plateau. According to the VF-TLP standard, the measurement window should be greater than 10% of the VF-TLP pulse width .
4.1 Comparison of VF-TLP Versus TLP Waveform
Comparing the VF-TLP test source to the TLP source, both are transmission line sources. The distinction between the two sources is the VF-TLP source is significantly shorter than the TLP source. FIG. 3 shows both the TLP and VF-TLP pulse waveforms.
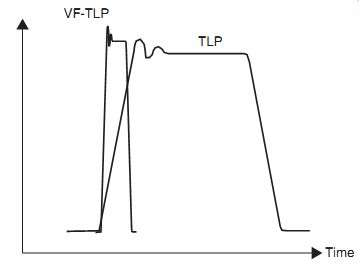
FIG. 3 Very fast transmission line pulse (VF-TLP) and TLP waveform comparison
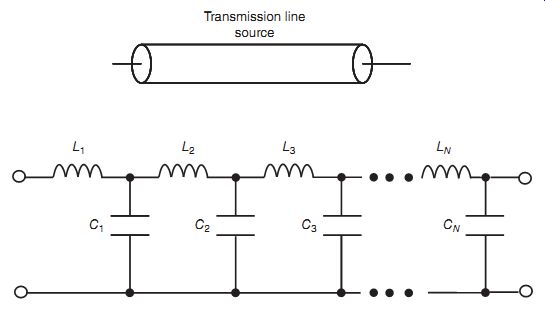
FIG. 4 Very fast transmission line pulse (VF-TLP) equivalent circuit
5. Equivalent Circuit
For the VF-TLP test system, an equivalent model circuit representation can be defined. The VF-TLP circuit is a transmission line source. The VF-TLP source is short and does not demonstrate any resistive loss. Hence, it can be represented as a lossless inductor-capacitor (LC) transmission line (FIG. 4).
6. Test Equipment Configuration
VF-TLP test systems can be placed in different configurations, as was true for the TLP testing.
In the following section, the acceptable test configurations are discussed.
6.1 Current Source
VF-TLP test system method known as the current source method is a high impedance test method. Due to the high impedance, this method is not suitable for VF-TLP methods.
6.2 Time Domain Reflection (TDR)
VF-TLP test system method is known as the time domain reflection (TDR) VF-TLP (FIG. 5). The TDR-VF-TLP method comprises the following test equipment:
• High-voltage charging source
• High-voltage charging source series resistor
• A transmission line for matching (50-Ohm)
• A transmission line switch
• A transmission line source
• A transmission line connection
• A transmission line delay
• An attenuator
• A voltage probe
• A single-channel oscilloscope.
In the TDR-VF-TLP method, the components are arranged as shown in FIG. 5. The TDR-VF-TLP system is a 50-Ohm system. The high-voltage source charges the transmission line to a high voltage through the 10MO resistor element. An attenuator is placed in series with the device under test (DUT). A single-channel oscilloscope is used with a voltage probe that measures the voltage across the DUT. A reference pulse is required if the reflected pulse overlaps the initial VF-TLP pulse.
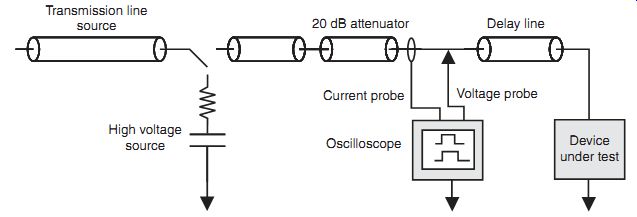
FIG. 5 Very fast transmission line pulse (VF-TLP) TDR configuration
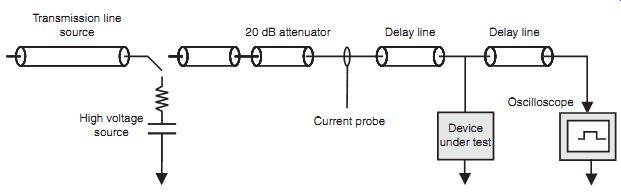
FIG. 6 Very fast transmission line pulse (VF-TLP) time domain transmission
(TDT) configuration
6.3 Time Domain Transmission (TDT)
VF-TLP test systems can be configured to look at the transmitted signal. This method is known as the time domain transmission (TDT) VF-TLP. The TDT VF-TLP method comprises the following test equipment :
• High-voltage charging source
• High-voltage charging source series resistor (10M-Ohm)
• A transmission line switch
• An attenuator
• A transmission line for matching
• A high impedance voltage probe
• A single-channel oscilloscope.
In the TDT VF-TLP method, the components are arranged as shown in FIG. 6. The TDR VF-TLP system is a 50-Ohm system. The high-voltage source charges the transmission line to a high voltage through the 10MO resistor element. No attenuator is placed in series with the DUT. A single-channel oscilloscope is used with a voltage probe that measures the voltage across the DUT. A reference pulse is required.
6.4 Time Domain Reflection and Transmission (TDRT)
VF-TLP test systems can also be configured to measure the reflected and the transmitted signal.
This method is known as the time domain reflection and transmission (TDRT) VF-TLP. The TDRT VF-TLP method comprises the following test equipment :
• High-voltage charging source
• High-voltage charging source series resistor (10-MOhm)
• A transmission line switch
• A transmission line connection
• An transmission line delay
• A transmission line termination
• A high impedance voltage probe
• A two-channel oscilloscope.
In the TDRT VF-TLP method, the components are arranged as shown in FIG. 7. The DUT is placed in a series configuration in the center of the system and allows for both reflection and transmission of the signal. The TDRT VF-TLP system is a 100-Ohm system. The high-voltage source charges the transmission line to a high voltage through the 10M-O resistor element. No attenuator is placed in series with the DUT. A two-channel oscilloscope is used with a voltage probe that measures the voltage across the DUT. The transmitted current is used for measuring the current through the DUT. A reference pulse is required.
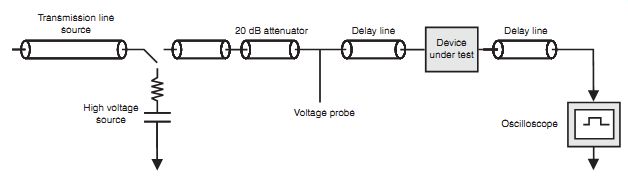
FIG. 7 Very fast transmission line pulse (VF-TLP) time domain transmission
(TDRT) configuration
6.5 Early VF-TLP Systems
In the 1970s, VF-TLP systems were used for understanding the robustness of semiconductors.
FIG. 8 shows a VF-TLP pulse system for evaluation of the EOS of an RF component.
For evaluation of the power-to-failure, a system was established that could evaluate the incident, reflected, and transmitted power through a DUT. An ultrahigh-frequency source signal was transmitted through a 0-30 dB attenuator. The signal was passed through a first directional coupler for the incident power, and a second directional coupler for the reflected power evaluation. A switch followed by a load is placed after the directional couplers to allow for isolation of UHF RF source from the DUT. In the TDRT VF-TLP system, the DUT is placed in series with the incident and the transmitted signals. A directional coupler is also utilized to evaluate the transmitted power through the DUT. The three directional coupler elements are followed by crystal detectors and 50-Ohm terminations, whose signals are transferred to oscilloscopes and camera sources; these diagnostics capture the incident power, reflected power, and transmitted power waveforms in time.
In this test system, the incident, reflected, and transmitted power waveforms were captured.
J.J. Whalen and H. Domingos showed that the time of failure is observable in the reflected power waveform prior to the end of the applied pulse waveform. In the case of the incident power pulse, a constant power pulse is observable. But, in the reflected power waveform, variation can be observed in the peak power as a function of time. It was noted that a transition occurs in the reflected power waveform, indicating a change in the power absorption and a reduction in the reflected power, followed by an abrupt increase in the reflected power characteristic. This was not observed in power waveforms of RF devices that did not fail at lower power levels.
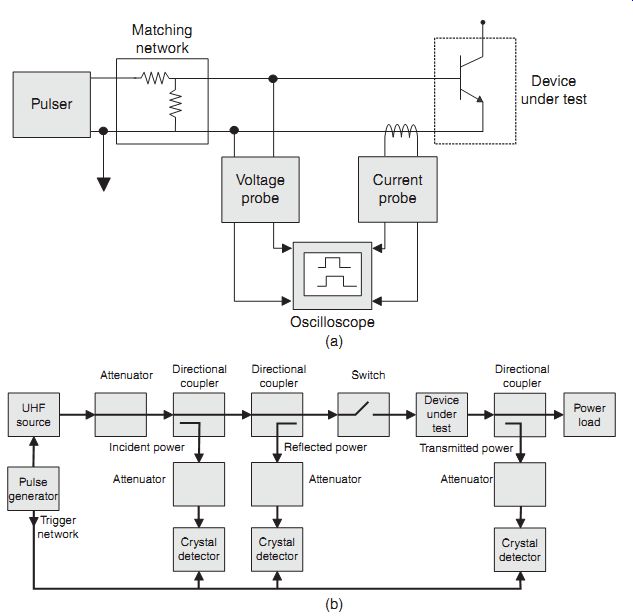
FIG. 8 (a) Very fast transmission line pulse (VF-TLP) test system with
matching network. (b) Very fast transmission line pulse (VF-TLP) test system
(Whalen and Domingos)
The absorbed energy of the DUT can be calculated by the difference between the incident energy and the sum of the reflected and transmitted energy.
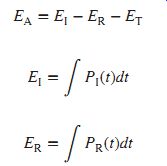
where the incident energy is
EI
= ? PI (t)dt
and the reflected energy is
ER = ? PR(t)dt
and transmitted energy is ET = ? PT(t)dt
In the case of component failure, the integration is terminated at the time-of-failure, tf.
From this test methodology, the energy-to-failure from a pulse source can be determined.
J.J.Whalen and H. Domingos also performed a square pulse test that could vary the polarity of the pulse waveform to either positive pulses or negative pulses. FIG. 8(b) shows the square pulse system utilized. As in a TLP test system, this system utilized a square pulse waveform and was able to capture the voltage and current characteristics across the DUT. In this test system, the test system integrated a pulse source with a manual trigger, a resistor matching network, and the RF DUT. To capture the voltage characteristic across the RF DUT, a voltage probe was placed across the device, whose output was transferred to an oscilloscope.
In addition, a current probe was placed over the ground return line, observing the current that lowed through the RF DUT. The output of the current probe was transferred to an oscilloscope to observe the current waveform. From the voltage and current waveforms, the voltage and current across the RF DUT were evaluated. From these characteristics, the time-of-failure was also observable by the change in the forward bias value across the RF transistor (e.g., reduction of VBE).
From the test system, the power-to-failure can be evaluated as the product of the current and voltage across the device prior to the collapse of the emitter-base voltage,
Pf = IBVBE
whereas the absorbed-energy-to-failure is the product of the power-to-failure and time of-failure, EA = Pf tf ={IBVBE}tf
From the test system, the voltage, current, and the time-of-failure are obtainable from the waveforms [10].
6.6 Commercial VF-TLP Test Systems
Commercial VF-TLP systems followed after the introduction of commercial TLP systems.
One of the first VF-TLP systems was the Barth Model 4012 VF-TLP+ (FIG. 9) [25].
The system components comprise the following:
• Tektronix Scope Model DPO 70604, 6GHz Digitizing
• High Reliability Barth Electronics Control Box/Pulse Generator
• Keithley Pico-ammeter/Voltage Source
• Main power switch/power distribution panel
• Test control computer ( Dell Optiplex Minitower; Dell 19'' lat panel; Windows XP; Keyboard; Mouse)
• High-speed business class color printer
• LabView Runtime Control and Analysis Software.
With the fast pulse width, wide bandwidth pulse current and voltage sensors are required to capture an accurate signal. To avoid signal losses, cable connections and interconnects are optimized.
The Barth Model 4012 is capable of different pulse widths, from 1 to 10 ns, as well as a variable rise time of 100, 200, and 400 ps. The test pulse voltage range is from 0 to 500V into a50-Ohm load. The test pulse current can be changed from 0 to 10A at 50-Ohm load. The sensors rise time is 30 ps (DUT voltage sensor) and 35 ps (DUT current sensor). The leakage current range is from 1 pA to 2.5mA.
The HPPI TLP-8010C is a versatile test system that can test VF-TLP, TLP, and HMM standard [26]. FIG. 9(b) shows the HPPI TLP-8010C. For VF-TLP mode of operation, fast pulses of 1 ns can be initiated. With the addition of the pulse width extender, pulse widths of 5 and 10 ns can be generated. Note that this system can also generate much longer pulse widths.
From the value of the longer pulse widths, Wunsch-Bell curves can be generated from the VF-TLP time regime, TLP regime, and longer.
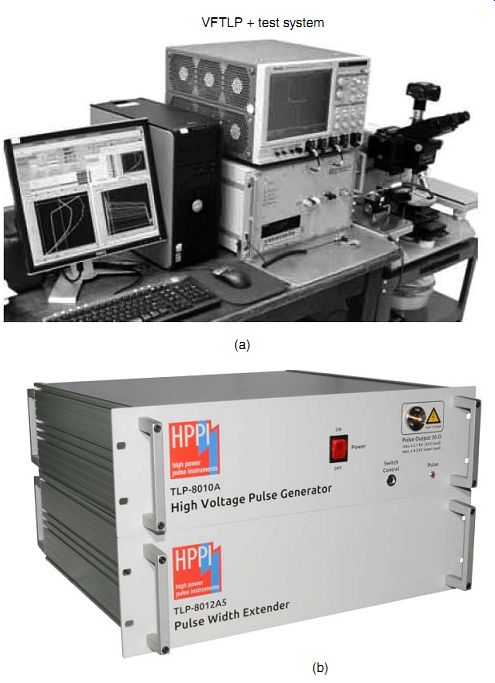
FIG. 9 (a) Very fast transmission line pulse (VF-TLP) commercial test
equipment--Barth Model 4012 VF-TLP+(Barth Electronics Inc). (b) Very fast
transmission line pulse (VF-TLP) commercial test equipment HPPI TLP-8010C
(HPPI GmBH)
7. Test Sequence and Procedure
For the VF-TLP testing, there is a test sequence and a procedure to provide the VF-TLP pulsed current-voltage characteristics. The VF-TLP test procedure uses a series of pulses with increasing pulse amplitude. The steps in the procedure are as follows:
• Select a pulse of a given pulse width, rise time, fall time, amplitude, and polarity.
• Select a step size increment.
• Test a first component.
• Select a minimum time between successive steps (e.g., greater than 0.1 s).
• Define a failure criterion.
• Apply a stress pulse of fixed width to the DUT.
• Measure and record stress pulse voltage and current, representing one I-V point on the DUT of the I-V characteristics.
• Perform a post stress evaluation of the DUT.
• If no "failure" occurs, the process is repeated with the next pulse applied at a higher magnitude; if failure occurs, the testing is stopped.
FIG. 10 illustrates a low chart of the test sequence for VF-TLP testing .
7.1 VF-TLP Pulse Analysis
For the VF-TLP testing methodology, TLP pulse event analysis is required. The TLP methodology must define a measurement window to extract current and voltage from the DUT.
7.2 Measurement Window
The VF-TLP methodology must define a measurement window to extract current and voltage from the DUT. A measurement window is chosen within the pulse event that avoids the rise time, fall time, and the region of current and voltage overshoot, oscillation, and ringing. For the VF-TLP pulse, the plateau to define the measurement window is significantly smaller than the TLP pulse plateau (FIG. 11).
The measurement is taken in a quiescent region so that an accurate value for the voltage and current is obtained. This is achieved by sampling a number of points and averaging them. The measurement time window is greater than 10% of the pulse width to allow for averaging of many data points.
7.3 Measurement Analysis--VF-TLP Voltage Waveform
In this section, the measurement analysis of a pulse waveform in a TDR TLP system is shown.
FIG. 14 illustrates a voltage characteristic for a measurement where the DUT is under 50-Ohm.
In the plot, the incident pulse is shown, as well as the reflected pulse. In a VF-TLP event, there is no overlap region of the incident and reflected pulses. The measurement window is shown in the region where the incident and reflected pulses overlap (FIG. 12).
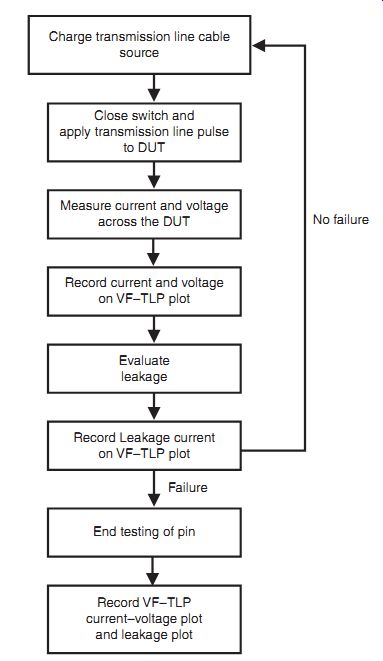
FIG. 10 VF-TLP test sequence
7.4 Measurement Analysis--Time Domain Reflectometry (TDR) Current Waveform
In this section, the measurement analysis of a pulse waveform in a TDR VF-TLP system is illustrated. FIG. 13 illustrates a current versus time characteristic for a measurement where the DUT is under 50-Ohm. In the plot, the incident pulse is shown, as well as the reflected pulse.
The incident and the reflected pulse waveforms do not overlap.
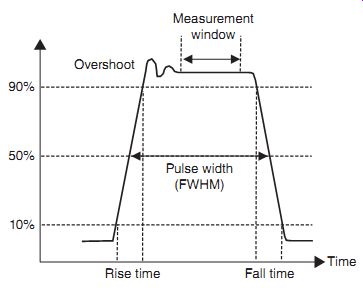
FIG. 11 VF-TLP measurement window
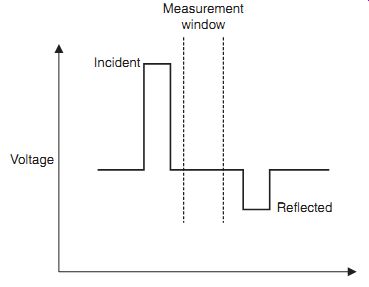
FIG. 12 VF-TLP analysis--TDR voltage waveform
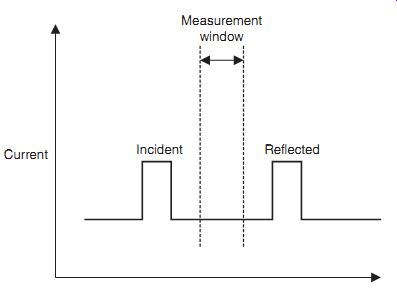
FIG. 13 VF-TLP analysis--TDR current waveform
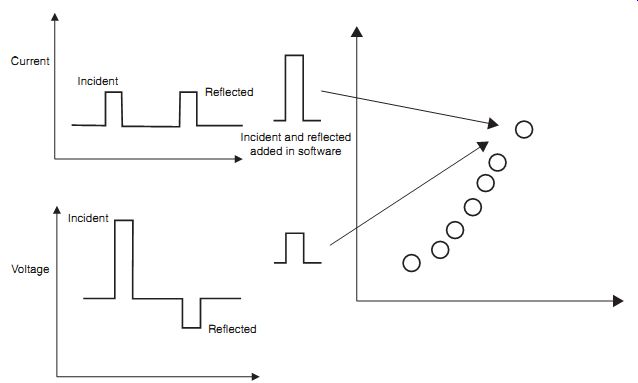
FIG. 14 Very fast transmission line pulse (TLP) I-V characteristic analysis
construction
7.5 Measurement Analysis--Time Domain Transmission (TDR) Current-Voltage Characteristics
In this section, the measurement analysis of a pulse waveform in a TDR VF-TLP system is illustrated. FIG. 14 illustrates a voltage and current versus time characteristic for a measurement as well as the current-voltage (I-V) characteristics. The measurement for the voltage and current is achieved by evaluating the average within the measurement window. These aver aged values are then recorded in the I-V plot. In addition to the (I, V) point placed on the I-V plot, the leakage current post-stress is also recorded.
8. VF-TLP Pulsed I-V Characteristics
From VF-TLP testing, a pulsed current-voltage (I-V) characteristic can be constructed. Each data point in the pulsed I-V characteristic is the current and voltage across the DUT. Each data point represents a pulse in the test sequence. The voltage on the transmission line (TL) source is increased for each step in the I-V characteristic.
FIG. 15 illustrates the current and voltage from a pulse event, and how it is projected onto the current-voltage characteristics. Each current and voltage point is an average of the measured pulse event where the information is from an average of measurements from the measurement window.
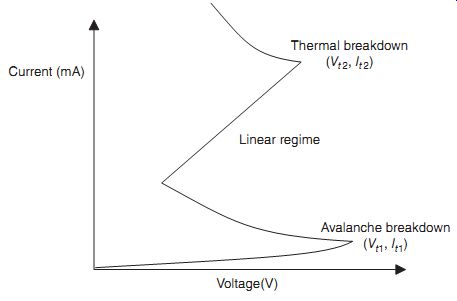
FIG. 15 Very fast transmission line pulse (TLP) I-V characteristic analysis
construction
8.1 VF-TLP Pulsed I-V Characteristic Key Parameters
The VF-TLP I-V characteristics contain key metrics. Similar to TLP testing, the VF-TLP I-V characteristics comprise the following key parameters:
• Avalanche voltage
• Trigger point
• Holding point
• Turn-on voltage
• On-resistance
• Clamping voltage
• Second trigger point
• Soft failure current
• Failure current.
8.2 VF-TLP Power Versus Time Plot
In the early development of VF-TLP testing, the focus was not on the current and voltage I-V characteristics but on power. The primary reason was the researchers were interested in the power-to-failure, not the I-V characteristics. For the power analysis, the technique was to evaluate the incident, transmitted, and reflected power as a function of time. The first system developed by J.J.Whalen and H. Domingos was a pulse system in a TDRT configuration.
In this configuration, the measured parameters were the incident, transmitted, and reflected power as a function of time. From this method, the absorbed power in the DUT was the incident power minus the reflected power and the transmitted power. Waveforms of the incident power, the reflected power, and the transmitted power as a function of time were recorded. In this methodology, the time-to-failure was observable from transitions in the power waveforms.
The energy-to-failure can be defined as
EA = EI
-ER-ET
where EI is the incident energy, ER is the reflected energy, and ET is the transmitted energy.
In the plot, the incident, reflected and transmitted power versus time is shown. In addition, the time-of-failure is also shown (FIG. 16).
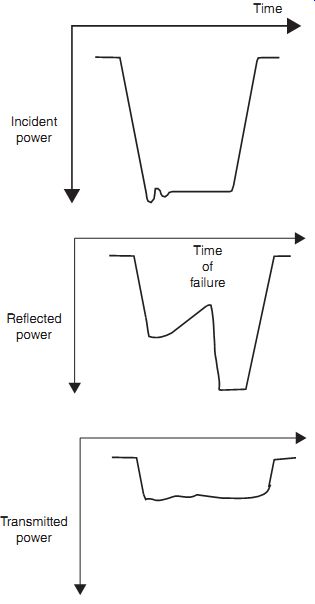
FIG. 16 Power versus time plot
8.3 VF-TLP Power Versus Time--Measurement Analysis
A second test system, published in 1979, was simplified to include a single pulse unit, a square pulse-matching network, a voltage probe, a current probe, and a dual-channel oscilloscope.
8.4 VF-TLP Power-to-Failure Versus Pulse Width Plot
FIG. 17 illustrates the power-of-failure as a function of the pulse width. In the plot, the point of the VF-TLP event is highlighted. The VF-TLP event will be in the adiabatic regime of the Wunsch-Bell plot.
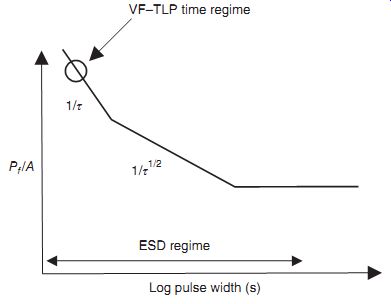
FIG. 17 Wunsch-Bell curves: power-to-failure versus pulse width
8.5 VF-TLP and TLP Power-to-Failure Plot
One of the advantages of using both the TLP method and the VF-TLP method is that a two-point plot can be constructed for estimating the power-to-failure. For construction of the Wunsch-Bell power-to-failure curve, a series of successive tests are made for different pulse widths. The Wunsch-Bell power-to-failure characteristics are formed by sweeping all possible pulse widths capable of the test system. But, nowadays, many test systems do not have the ability to change the pulse width. Using a TLP system, with one fixed pulse width, and a second VF-TLP system, with a faster pulse width, a two-point curve can be created for rough estimation of the robustness in the time regime of interest.
For each pulse width, both the TLP and the VF-TLP systems, a pulsed I-V plot is formed.
From the test, the failure point (I-V current and voltage) is extracted. This failure point is the product of the current-to-failure (If ) and the voltage-to-failure (Vf ); this can be represented as the power-to-failure (Pf ). The data is plotted as the power-to-failure (Pf ) versus the logarithm of the pulse width as shown in FIG. 18. This can be used a projection of the anticipated results for a fast pulse and slower pulse.
9. Alternate Test Methods
Today, there are alternate test systems and test methods for exploring high-speed pulse testing.
In the following section, pulse testing of RF components and UF-TLP is shown.
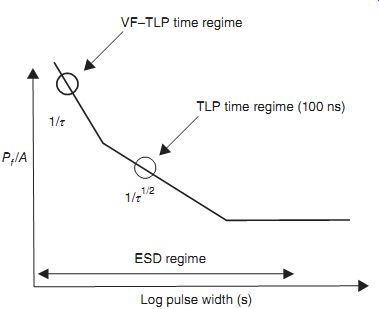
FIG. 18 Wunsch-Bell curve with VF-TLP and TLP result
9.1 Radio Frequency (RF) VF-TLP Systems
For high-speed testing and RF components, different criteria are used to determine the failure of a device or component. For RF devices and circuits, different RF parameters must be evaluated to determine the device failure. In CMOS technology for digital circuits, DC leakage current is used to evaluate the device failure.
S. Hynoven and E. Rosenbaum developed an alternate TLP system to evaluate parameters. FIG. 19(a) and (b) show a test system used for evaluation of RF parameters as the criteria for failure. This will be of increased importance for evaluation of RF components.
Evaluation of the RF parameters of devices, components, and systems will need to have this capability in the future.
9.2 Ultrafast Transmission Line Pulse (UF-TLP)
Today's VF-TLP system evaluates the sensitivity of components in the nanosecond time regime. In the future, it will be important to understand the robustness of devices and components in the sub-nanosecond to picosecond time frame.
FIG. 20 is an example of an UF-TLP system that produces pulses in the tens of picoseconds [28]. The UF-TLP system was constructed using single-pole double-throw (SPDT) switches [28]. The "transmission line" was constructed by disassembling one of the SPDT and adding a small element to store the charge. FIG. 21 shows an example of the pulse widths produced from this system.
In FIG. 22, the UF-TLP system was used to evaluate a tunneling magnetoresistor (TMR) head used in the magnetic recording industry [29].
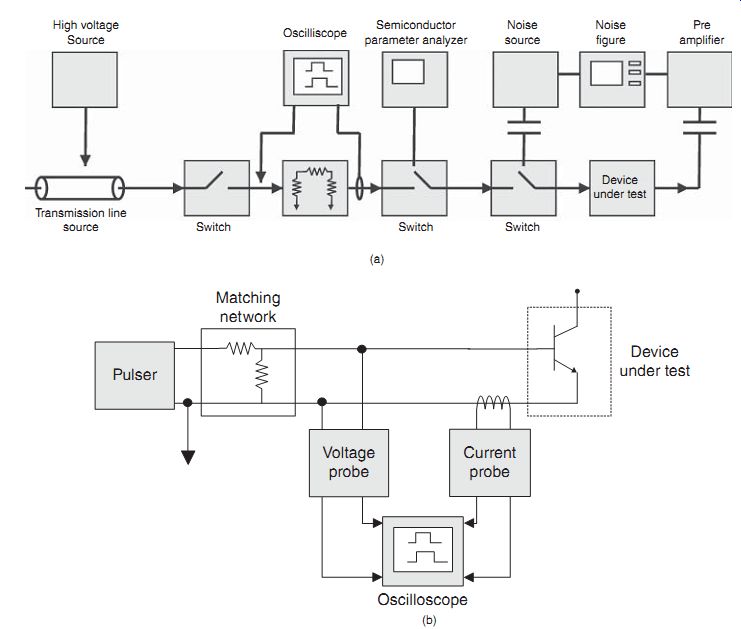
FIG. 19 (a) Very fast transmission line pulse (VF-TLP) test system.
(b) Very fast transmission line pulse (VF-TLP) test system for RF parameter
analysis with matching network
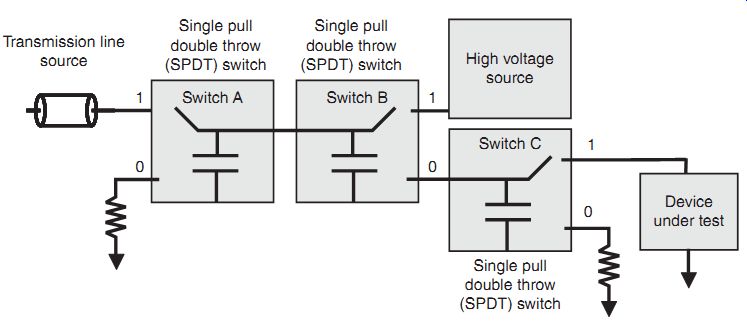
FIG. 20 Ultrafast transmission line pulse (UF-TLP) test system
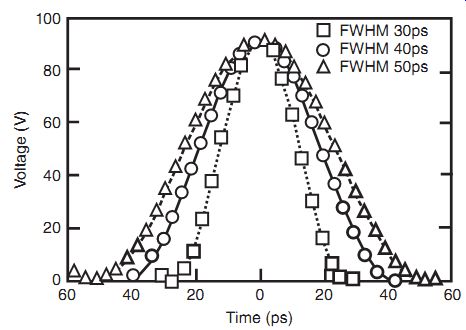
FIG. 21 Ultrafast transmission line pulse (UF-TLP) pulse waveform
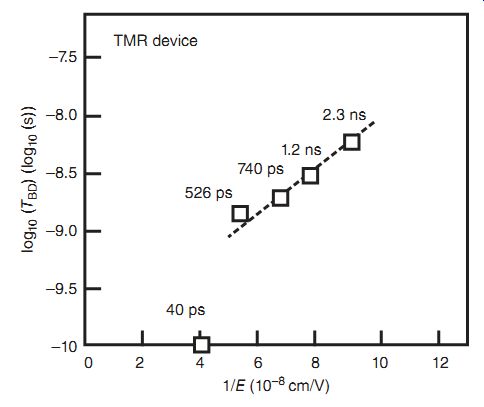
FIG. 22 Ultrafast transmission line pulse (UF-TLP) results for a tunneling
magnetoresistor (TMR) structure
10. Summary and Closing Comments
In this section, the VF-TLP model was discussed. This method had an increasing popularity due to its powerful value in semiconductor device and circuit development to evaluate high-speed interactions in the GHz regime. The ability to see the current and voltage characteristics across the DUT in the GHz time regime was of significant value to ESD engineers, circuit designers, and to failure analysis teams who need to develop, understand, or debug the response of high-speed digital logic and RF devices and circuits. This was a large step forward in increasing the technical nature of high-speed phenomena in ESD development.
Section 7 addresses system level concerns in semiconductor development known as IEC 61000-4-2. This test introduces a fast transient followed by a slower HBM-like waveform.
With the growing interest in system level EOS, the interest in this test has emerged recently in semiconductor chip suppliers to test equipment.
EXERCISES
1. How does the VF-TLP results compare to a TLP result? How does it differ?
2. What information does a VF-TLP test provide that a TLP test does not provide?
3. What is the frequency of the VF-TLP pulse? How does this compare to the application frequencies of DRAMs, SRAMs, ASICs, microprocessors, or RF products?
4. For semiconductor materials, is the VF-TLP pulse in the adiabatic, thermal diffusion, or steady state time regime? Does heat have time to diffuse in the semiconductor devices?
5. Combining VF-TLP and TLP measurements, show how segments of the Wunsch-Bell power-to-failure curve can be formed. What information can be obtained from this?
6. An RF cell phone product has a 5GHz application frequency. An RF oscillating power source is applied to the product. How can we use a VF-TLP test system to quantify the power-to-failure of a cell phone product?
7. A commercial RF tester can cost millions of dollars. The test head of the RF test system must be resistant to fast high current events. Semiconductor RF chips are inserted into the socket of the test head for RF analysis. Assume the person and the chip are precharged prior to inserting the chip into the test system. Explain the event and how the VF-TLP test system can be used to quantify the robustness of the RF test system.
8. A charged device model (CDM) pulse is initiated by charging the substrate, power grid, or package. Explain the differences between VF-TLP and CDM events. Show the current path of the VF-TLP event. Show the current path of the CDM event.