AMAZON multi-meters discounts AMAZON oscilloscope discounts
The measurement of the values of inductors (L) and capacitors (C) at radio frequencies differs somewhat from the same measurements at low frequencies. Al though similarities exist, the RF measurement is a bit more complicated. One of the reasons for this situation is that stray or "distributed" inductance and capacitance values of the test set-up will affect the results. Another reason is that capacitors and inductors are not ideal components but rather all capacitors have some inductance and all inductors have capacitance. In this section we will take a look at several methods for making such measurements.
VSWR method
When a load impedance (R _ jX) is connected across an RF source the maxi mum power transfer occurs when the load impedance (ZL) and source (ZS) impedances are equal (ZL _ ZS). If these impedances are not equal, then the voltage standing wave ratio (VSWR) will indicate the degree of mismatch. We can use this phenomenon to measure values of inductance and capacitance using the scheme shown in Fig. 16-1A. The instrumentation required includes a signal generator or other signal source and a VSWR meter or VSWR analyzer.
Some VSWR instruments require a transmitter for excitation, but others will accept the lower signal levels that can be produced by a signal generator. An alternative device is the SWR analyzer type of instrument. It contains the signal generator and VSWR meter along with a frequency counter to be sure of the actual test frequency. Whatever signal source is used, however, it must have a variable output frequency. Further, the frequency read-out must be accurate (the accuracy of the method depends on knowing the actual frequency).
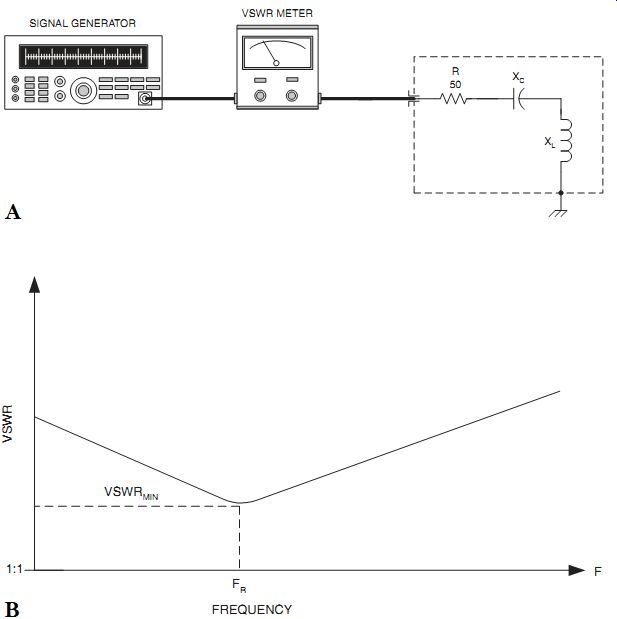
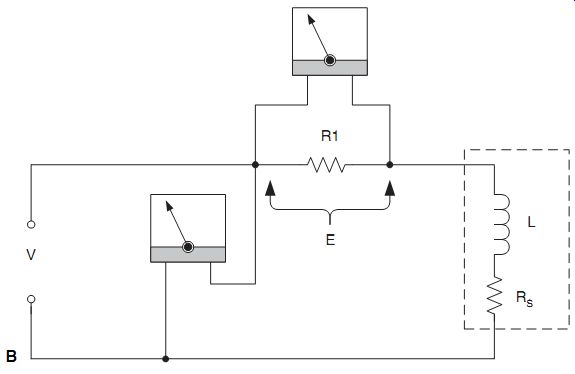
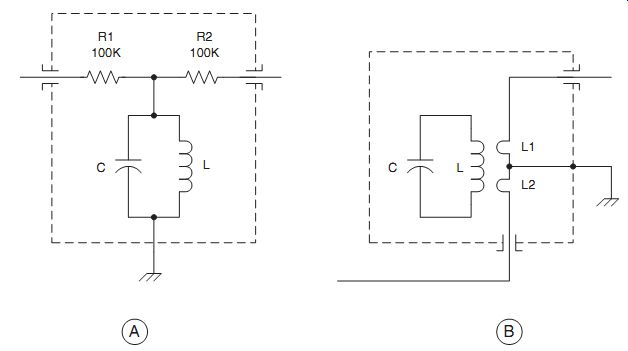
16-1 (A) VSWR method for measuring L and C; (B) VSWR-vs-Frequency curve.
The load impedance inside the shielded enclosure consists of a noninductive resistor (R1) that has a resistance equal to the desired system impedance resistive component (50-ohm in most RF applications and 75 ohm in television and video). An inductive reactance (XL) and a capacitive reactance (XC) are connected in series with the load. The circuit containing a resistor, capacitor, and inductor simulates an antenna feedpoint impedance. The overall impedance is given by:

Note the reactive portion of Eq. (16-1). When the condition exists, the series network is at resonance and VSWR is minimum (Fig. 16-1B). This gives us a means for measuring the values of the capacitor or inductor, provided that the other is known. That is, if you want to measure a capacitance then use an inductor of known value. Alternatively, if you want to know the value of an unknown inductor use a capacitor of known value.
Using the test set-up in Fig. 16-1A, adjust the frequency of the signal source to produce minimum VSWR.
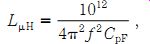
For finding an inductance from a known capacitance:
(16-2)
where L_H _ inductance in microhenrys (_H)
CpF is the capacitance in picofarads (pF)
f is the frequency in hertz (Hz)
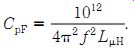
For finding a capacitance from a known inductance:
(16-3)
The accuracy of this approach depends on how accurately the frequency and the known reactance are known and how accurately the minimum VSWR frequency can be found.
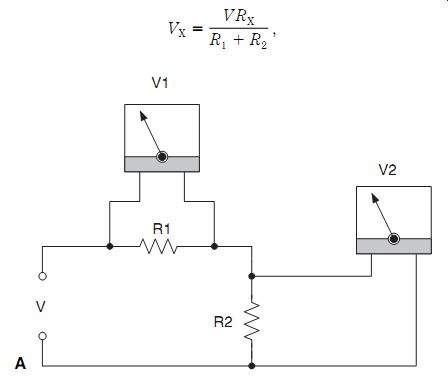
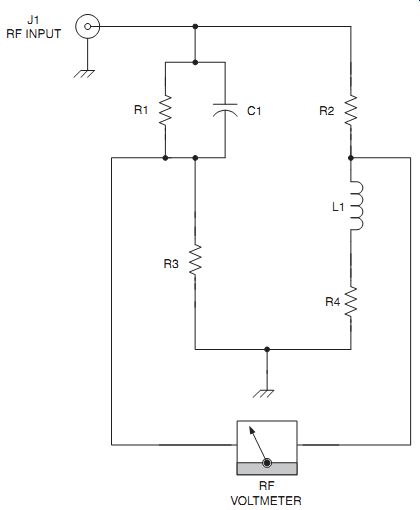
16-2 (A) Simple voltage divider; (B) reactance voltage divider.
Voltage divider method
A resistive voltage divider is shown in Fig. 16-2A. This circuit consists of two resistors (R1 and R2) in series across a voltage source, V. The voltage drops across R1 and R2 are V1 and V2, respectively. We know that either voltage drop is found from:
where VX is V1 and RX is R1 or VX is V2 and RX is R2, depending on which voltage drop is being measured.
We can use the voltage divider concept to find either inductance or capacitance by replacing R2 with the unknown reactance. Consider first the inductive case. In Fig. 16-2B resistor R2 has been replaced by an inductor (L). The resistor R1 is the inductor series resistance. If we measure the voltage drop across R1 (i.e., "E" in Fig. 16-2B) then we can calculate the inductance from:
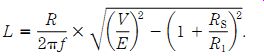
(16-5)
As can be noted in Eq. (16-5) if R1 __ RS, then the quotient RS/R1 becomes negligible.
In capacitors the series resistance is typically too small to be of consequence. We can replace L in the model of Fig. 16-2B with a capacitor and again measure voltage E.
The value of the capacitor will be:
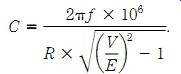
(16-6)
The value of resistance selected for R1 should be approximately the same order of magnitude as the expected reactance of the capacitor or inductor being measured. For example, if you expect the reactance to be, say, between 1K and 10K at some frequency then select a resistance for R1 in this same range. This will keep the voltage values manageable.
Signal generator method
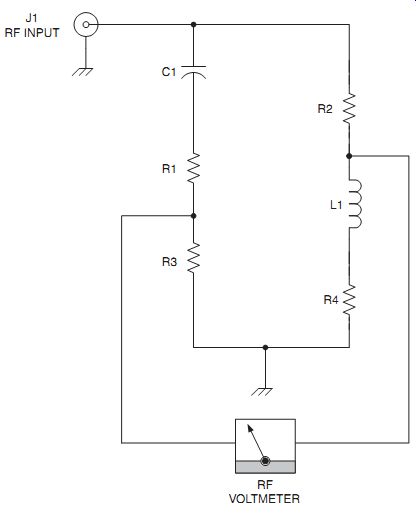
If the frequency of a signal generator is accurately known then we can use a known inductance to find an unknown capacitance or use a known capacitance to find an unknown inductance. Figure 16-3 shows the test set-up for this option. The known and unknown components (L and C) are connected together inside a shielded enclosure. The parallel tuned circuit is lightly coupled to the signal source and the display through very low value capacitors (C1 and C2). The rule is that the reactance of C1 and C2 should be very high compared with the reactances of L and C.
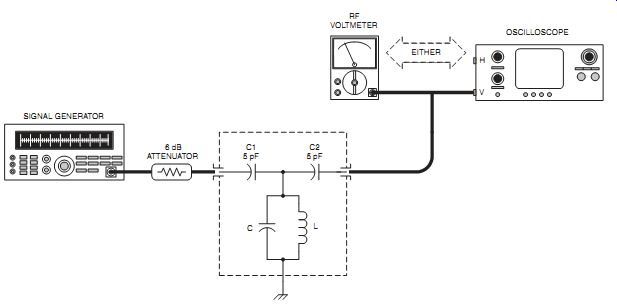
16-3 Signal generator method.
The signal generator is equipped with a 6-dB resistive attenuator in order to keep its output impedance stable. The output indicators should be any instrument that will read the RF voltage at the frequency of resonance. For example, you could use either an RF voltmeter or an oscilloscope.
The procedure requires tuning the frequency of the signal source to provide a peak output voltage reading on the voltmeter or 'scope. If the value of one of the components (L or C) is known, then the value of the other can be calculated using Eq. (16-2) or Eq. (16-3), as appropriate.
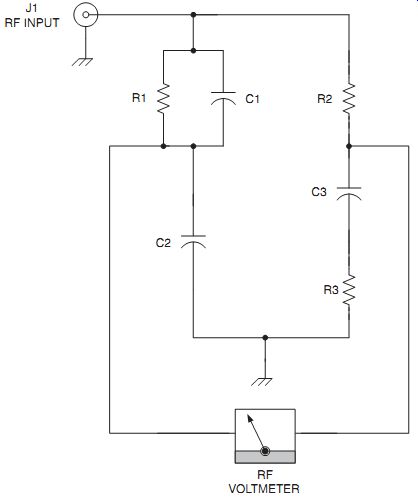
Alternate forms of coupling are shown in Fig. 16-4. In either case, the idea is to isolate the instruments from the L and C elements. In Fig. 16-4A the isolation is pro vided by a pair of high-value (10K to 1 Meg) resistors, R1 and R2. In Fig. 16-4B the coupling and isolation is provided by a one- or two-turn link winding over the inductor. The links and the main inductor are lightly coupled to each other.
16-4 Alternative coupling methods.
Frequency-shifted oscillator method
The frequency of a variable-frequency oscillator (VFO) is set by the combined action of an inductor and a capacitor. We know that a change in either capacitance or inductance produces a frequency change equal to the square of the component ratio. For example, for an inductance change:
(16-7)
........where.....
L1 is the original inductance
L2 is the new inductance
F1 is the original frequency
F2 is the new frequency.
From this equation we can construct an inductance meter such as Fig. 16-5. This circuit is a Clapp oscillator designed to oscillate in the high-frequency (HF) range up to about 12 MHz. The components L1, C2, and C3 are selected to resonate at some frequency. Inductor L1 should be of the same order of magnitude as L1. The idea is to connect the unknown inductor across the test fixture terminals. Switch S1 is set to position "b" and the frequency (F1) is measured on a digital frequency counter.
The switch is then set to position "a" in order to put the unknown inductance (L2) in series with the known inductance (L1). The oscillator output frequency will shift to F2. When we know L1, F1, and F2 we can apply Eq. (16-7) to calculate L2.
If we need to find a capacitance, then modify the circuit to permit a capacitance to be switched into the circuit across C1 instead of an inductance as shown in Fig. 16-5.
Replace the "L" terms in Eq. (16-7) with the corresponding "C" terms.
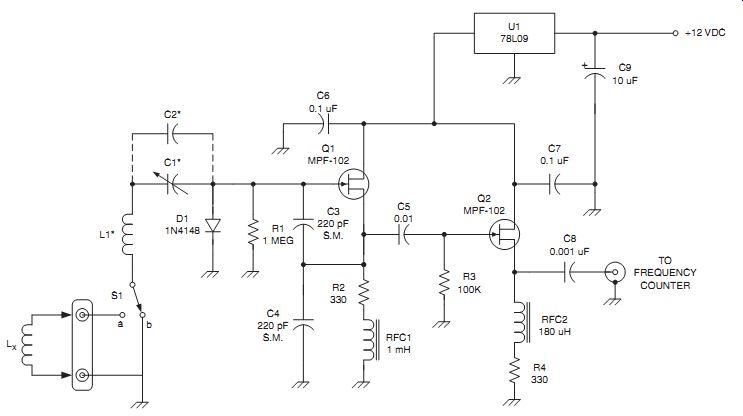
16-5 Frequency shift method.
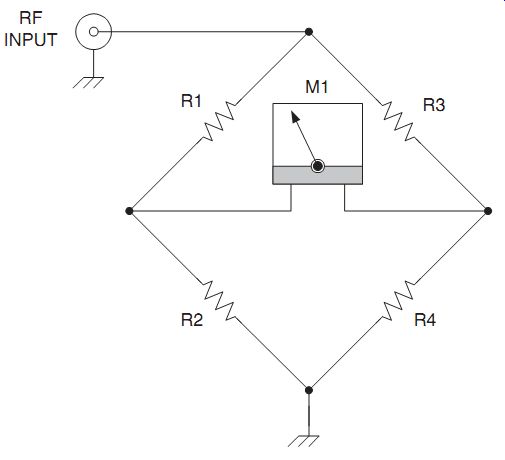
16-6 Wheatstone bridge
16-7 Maxwell bridge.
16-8 Hay bridge.
Using RF bridges
Most RF bridges are based on the dc Wheatstone bridge circuit (Fig. 16-6). In use since 1843, the Wheatstone bridge has formed the basis for many different measurement instruments. The null condition of the Wheatstone bridge exists when the voltage drop of R1/R2 is equal to the voltage drop of R3/R4. When the condition R1/R2 _ R3/R4 is true, then the voltmeter (M1) will read zero. The basic measurement scheme is to know the values of three of the resistors and use them to measure the value of the fourth. For example, one common scheme is to connect the unknown resistor in place of R4 and make R1 and R3 fixed resistors of known value and R2 a calibrated potentiometer marked in ohms. By adjusting R2 for the null condition and then reading its value, we can use the ratio (R2 _ R3)/R1 _ R4.
The Wheatstone bridge works well for finding unknown resistances from dc to some relatively low RF frequencies, but to measure L and C values at higher frequencies we need to modify the bridges. Three basic versions are used: Maxwell's bridge (Fig. 16-7), Hay's bridge (Fig. 16-8), and Schering's bridge (Fig. 16-9).
16-9 Schering bridge.
Maxwell bridge
The Maxwell bridge is shown in Fig. 16-7. The null condition for this bridge occurs when:

(16-8)
.......and.....

(16-9)
The Maxwell bridge is often used to measure unknown values of inductance (e.g., L1) because the balance equations are totally independent of frequency. The bridge is also not too sensitive to resistive losses in the inductor (a failing of some other methods). Additionally, it is much easier to obtain calibrated standard capacitors for C1 than it is to obtain standard inductors for L1. As a result, one of the principal uses of this bridge is inductance measurements.
Maxwell bridge circuits are often used in measurement instruments called Q-meters, which measure the quality factor (Q) of inductors. The equation for Q is, however, frequency sensitive:

(16-10)
…where F is in hertz R1 is in ohms C1 is in farads.
Q _ 2 ___ F _ R1 _ C1,
Hay bridge--The Hay bridge (Fig. 16-8) is physically similar to the Maxwell bridge except that the R1/C1 combination is connected in series rather than in parallel. The Hay bridge is, unlike the Maxwell bridge, frequency-sensitive. The balance equations for the null condition are also a little more complex:
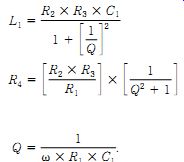
(16-11)

(16-12)

where (16-13)
The Hay bridge is used for measuring inductances with high Q figures while the Maxwell bridge is best with inductors that have a low Q value.
Note: A frequency-independent version of Eq. (16-11) is possible when Q is very large (i.e., _100):
L1 _ R2 _ R3 _ C1.

(16-14)
Schering bridge The Schering bridge circuit is shown in Fig. 16-9. The balance equation for the null condition is:
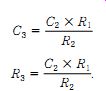
(16-15)

(16-16)
The Schering bridge is used primarily for finding the capacitance and the power factor of capacitors. In the latter applications no actual R3 is connected into the circuit, making the series resistance of the capacitor being tested (e.g., C3) the only resistance in that arm of the bridge. The capacitor's Q factor is found from:

(16-17)
Finding parasitic capacitances and inductances
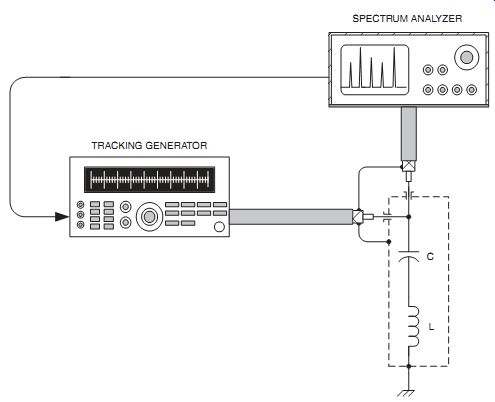
16-10 Measuring series inductance in a capacitor.
Capacitors and inductors are not ideal components. A capacitor will have a certain amount of series inductance (called "parasitic inductance"). This inductance is created by the conductors in the capacitor, especially the leads. In older forms of capacitor, such as the wax-paper dielectric devices used prior to about 1960, the series inductance was very large. Because the inductance is in series with the capacitance of the capacitor, it forms a series resonant circuit.
Figure 16-10 shows a test set-up for finding the series resonant frequency. A tracking generator is a special form of sweep generator that is synchronized to the frequency sweep of a spectrum analyzer. They are used with spectrum analyzers in order to perform stimulus response measurements such as Fig. 16-10.
The nature of a series resonant circuit is to present a low impedance at the resonant frequency and a high impedance at all frequencies removed from resonance.
In this case (Fig. 16-10), that impedance is across the signal line. The display on the spectrum analyzer will show a pronounced, sharp dip at the frequency where the capacitance and the parasitic inductance are resonant.
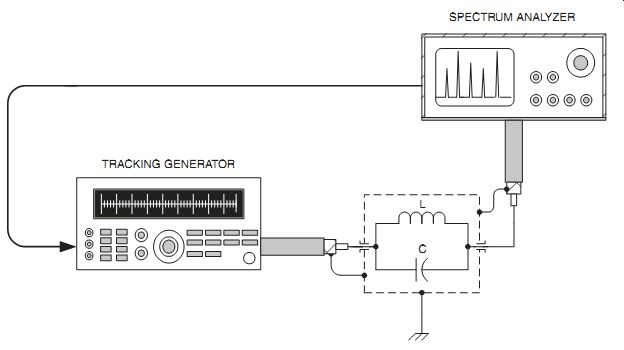
The value of the parasitic series inductance is:
(16-18)
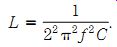
Inductors are also less than ideal. The adjacent turns of wire form small capacitors which when summed up can result in a relatively large capacitance value. Figure 16-11 shows a method for measuring the parallel capacitance of an inductor.
16-11 Measuring parallel capacitance in an inductor.
Because the capacitance is in parallel with the inductance, it forms a parallel resonant circuit. These circuits will produce an impedance that is very high at the resonant frequency and very low at frequencies removed from resonance. In Fig. 16-11 the inductor and its parasitic parallel capacitance are in series with the signal line, so will (like the other circuit) produce a pronounced dip in the signal at the resonant frequency. The value of the parasitic inductance is:
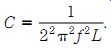
(16-19)
Conclusion
There are other forms of bridge, and other methods, for measuring L and C elements in RF circuits, but those discussed above are very practical, especially in the absence of specialist instrumentation.