AMAZON multi-meters discounts AMAZON oscilloscope discounts
Although all electronic components are inductive, an inductive component is defined as one in which inductive reactance is the dominant parameter. Inductive reactance is similar to capacitive reactance in that it stores energy. Inductive reactance is measured in ohms-it opposes current flow but does not dissipate energy. The inductor stores energy in its magnetic field. The principle of inductive reactance is basically very simple ; inductance in electronics resembles weight or mass in mechanics.
INDUCTANCE ANALOGY
Consider a water pipe that is bent in a circle and connected to a pump. As explained in the previous section, the pipe can be compared to an electric circuit, and the pump can be compared to a battery. Now, let "inductance" be placed in the pipe ; this can take the form of a metal ball or piston that is free to move inside the pipe. The piston has weight, or mass. The heavier is the piston, the greater is its "inductance." When the pump is started, water presses against the piston. However, because the piston has mass, it does not respond instantly ; it starts to move slowly and gradually gains velocity.
Although the pump initially applies maximum force (voltage ) across the piston, the motion (current) is zero at first.
Then, as the piston begins moving, the applied force is relieved (voltage is reduced) while the velocity of the piston (current) starts to rise. As the action continues, the piston moves even faster (current increases ), and the rapid movement decreases the pressure across the piston still more (voltage decreases ). It is clear that the current maximum occurs latest, at the time of zero voltage. Conversely, the voltage maximum occurs first, at the time of zero current. This is simply another way of saying that current and voltage are 90° out of phase.
CURRENT LAG
The current lags the voltage because the current maximum occurs later than the voltage maximum. The piston, once accelerated into motion, has stored energy. In other words, it tries to continue its forward motion when the pressure (voltage ) is absent. Now, although voltage is zero, current is maximum. If the pipe valve is opened, the energy of the moving piston will cause water to spurt out of the pipe. In an electric circuit containing inductance the energy of the magnetic field in the coil will cause a spark when the circuit is opened, analogous to the spurt of water from the pipe.
When a coil is connected in series with a circuit, its inductive reactance opposes current flow. This is a different kind of opposition from that imposed by resistance, because inductance stores energy instead of dissipating it. Inasmuch as the current in an inductive circuit is 90° out of phase with the current in a resistive circuit, inductive ohms must be added at right angles to resistive ohms. Inductive reactance is expressed as XL = 2 pi fL. Hence, inductive reactance increases with frequency. It is meaningless to state that an inductor has such-and-such ohms of reactance, unless the test frequency is given. Ohm's law states that I = E/X". Consider an inductor that has 100 ohms of inductive reactance at the frequency of test. If this inductor is connected in series with a 100-ohm resistor, the resistive ohms are drawn as the base of a right triangle, and the inductive ohms are drawn as the altitude of the triangle. Then, the hypotenuse, which is equal to 141 ohms (approximately), is the impedance of this RL circuit. Ohm's law states that I = E/Z, where Z is the impedance of the circuit.
Inasmuch as the current lags the voltage in an inductive circuit, but leads the voltage in a capacitive circuit, inductive reactance is opposite to capacitive reactance. Suppose a hypothetical series circuit with a 100-ohm capacitive reactance and a 100-ohm inductive reactance. The two reactances cancel, and the result is a circuit reactance of 0. Again, suppose a circuit with a 100-ohm capacitive reactance is in series with a 50-ohm inductive reactance. Then only 50 ohms of capacitive reactance are cancelled, and the circuit acts simply as a capacitive reactance of 50 ohms.
SERIES AND PARALLEL RESONANCE
Now assume that we have a series circuit comprising a 100-ohm resistance, a 100-ohm inductive reactance, and a 100 ohm capacitive reactance. The reactances cancel out, leaving a circuit resistance of 100 ohms. However, this resistance is seen only at the frequency at which the inductor and capacitor each have 100 ohms of reactance. For example, a ohmmeter test of this series LCR circuit would indicate an infinite resistance. This is because the ohmmeter makes a zero-frequency test. Now suppose the LCR circuit is tested on an AC Wheatstone bridge, driven at the frequency at which the inductor and capacitor each have 100 ohms of reactance. Then, the bridge indicates a resistance of 100 ohms-the bridge sees only the 100-ohm resistor at this resonant frequency.
Next, suppose that the 100-ohm inductive reactance is connected in parallel with the 100-ohm capacitive reactance. This time, the reactances do not cancel each other. Instead, the total reactance must be found just as the total resistance of two resistors connected in parallel is found:
XT = XLXC'/XL + XC', and if this is calculated for the foregoing values, the value is XT = 10,000/0, a number which for practical purposes is considered to be infinite, meaning that the total reactance XT of the parallel combination is infinite. This is simply the distinction between parallel resonance and series resonance.
All inductors have distributed capacitance, which makes the tuning coil in a broadcast receiver self-resonant (parallel resonant ) at some upper frequency. All inductors have some winding resistance, which means that their effective reactance is less than infinite at their self-resonant frequency. The AC resistance of a coil in a parallel-resonant circuit makes the coil appear to be a resistor at its resonant frequency. The value of this apparent resistance at resonance has a value of approximately L/RC ohms.
With this basic understanding of the electrical action in an inductive circuit, one is in a good position to consider how inductance values are measured, and how inductive components are tested. Different methods are employed to test various types of inductive components. All these methods are based on the principle of inductive reactance.
DC RESISTANCE TESTS OF COIL WINDINGS
Inductors are generally more complex components than capacitors in that they have substantial series resistance. This resistance makes it more difficult to measure inductance values than to measure capacitance values-the winding resistance usually cannot be neglected in practical test procedures. When AC voltage is applied to a paper or mica capacitor, the current flow is determined by the reactance of the capacitor. On the other hand, when AC voltage is applied to typical inductors, the current flow is determined by the impedance of the inductor. In turn, the impedance must be separated by the test into its resistance and reactance components before the inductance can be determined. These requirements are subsequently explained in greater detail.
Since most coils and transformers have appreciable series (winding) resistance, this parameter is often selected as the basis of preliminary tests. Thus, an ohmmeter measurement is made of the winding resistance, and the ohmmeter reading is compared with the value specified in the receiver service data.
Examples of specified winding resistances are given in Fig. 1. An infinite reading means that the winding is open. A zero reading indicates a completely shorted coil. These test results show that a coil or transformer is definitely defective. There is a serious limitation encountered in this test when there are a few shorted turns in the winding. The DC resistance de
creases so slightly that the fault is not noticeable on the ohmmeter. However, a few shorted turns cause a large change in the AC characteristics of the component and impair receiver operation. Hence, supplementary tests are required to localize such defective inductors.
WAVEFORM TESTS
Waveform tests are in-circuit checks. Note the waveforms illustrated in Fig. 1 . The waveforms are characterized by wave shape and amplitude. When an inductor is defective, the associated circuit waveform is changed. This is a much more definitive test than a DC resistance measurement. This is a vital point as the amplitude (peak-to-peak voltage ) of the waveform is as significant in trouble analysis as is the waveshape.
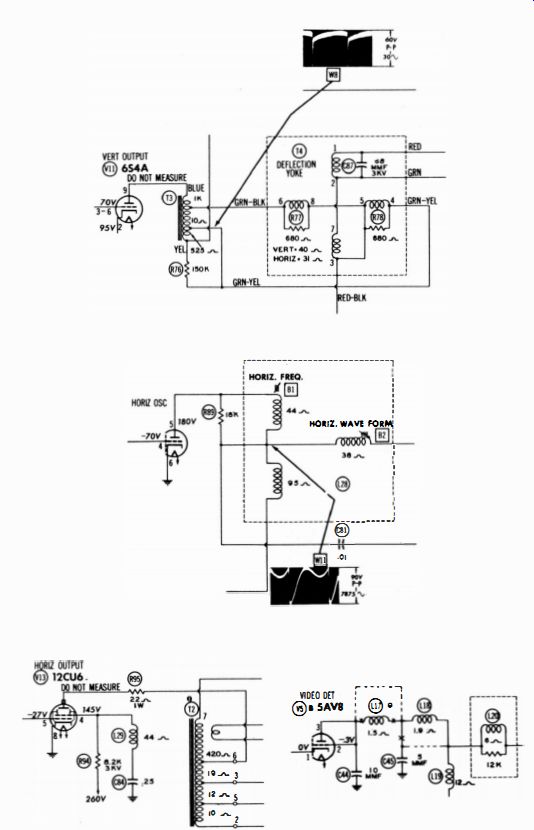
Fig. 1. Typical winding-resistance specifications.
In other words, a defective winding might cause a change in waveshape only ; or, it might cause a change in amplitude only ; again, it might cause a change in both waveshape and amplitude. These effects have their causes, and the astute technician trains himself to reason backward from effect to cause. If his reasoning is correct, he can then pinpoint a defective inductor that is causing a trouble symptom. Waveform analysis is seldom easy, and requires considerable study, plus experience, before proficiency is acquired.
Waveform tests are generally made with a low-capacitance probe. The probe minimizes circuit loading. The waveforms specified in receiver service data are always taken with a low-capacitance probe, unless otherwise noted. The chief exception to the use of a low-capacitance probe is found in the high-frequency signal sections. For example, waveforms tests of the IF coils (Fig. 2 ) are made with a demodulator probe.
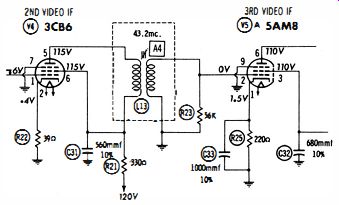
Fig. 2. Signal circuit coil tested with demodulator probe.
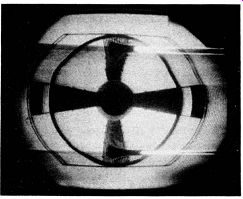
Fig. 3. Pattern showing regenerative IF amplifier.
If a waveform is present at the plate of V 4, but little or none at the grid of V5, strong suspicion is cast on the secondary winding of L13.
Transformer coils in IF amplifiers are tuned. For example, L13 in Fig. 2 is normally peaked to 43.2 mhz. Suppose a picture symptom such as the one illustrated in Fig. 3 is observed. This is a typical IF -regeneration symptom. The first test to make in this case is to check the resonant frequency of each transformer. When the grid and plate coils of an IF stage are peaked near the same frequency, a TPTG oscillator action often results. In other words, the troublesome coil is not defective-it is merely tuned to an incorrect frequency.
PEAKING-FREQUENCY TESTS
To check the resonant frequencies of IF coils, an IF sweep and marker generator is used with a scope. The test signals are applied to a floating tube shield over the mixer tube. The scope is connected through a 50K isolating resistor to the video detector output. An override bias of -3 volts is applied to the AGC bus. It is often advisable to disable the local-oscillator tube in the front end, to avoid the possibility of confusing spurious markers.
Set the marker generator to the peaking frequency specified in the receiver service notes. A marker appears on the IF response curve, as illustrated in Fig. 4. Turn the slug in the coil until the marker rises to a maximum height above the base line, and starts to fall . Leave the coil slug set for maximum marker height. The coil or transformer is now peak aligned. Repeat the procedure for each IF stage. Of course, an IF coil that cannot be tuned through the specified peaking frequency is probably defective-but first be sure that the associated circuit capacitors and resistors are not defective.
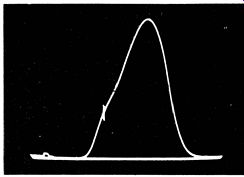
Fig. 4. Waveform at video detector.
Coil Leakage
A defective coil may develop shorted turns, or an open circuit. The powdered-iron core might be broken or otherwise defective. In addition to these defects, you will occasionally discover leakage between primary and secondary-particularly in the case of bifilar coils. In the configuration of Fig. 2, leakage will affect the tuning of the transformer and reduce the stage gain. Moreover, in the circuit of Fig. 5, leakage between primary and secondary of L8 bleeds positive voltage into the AGC line and causes picture overloading.
If this defect is suspected, clip the lead from the secondary of the transformer to the AGC bus, and check for positive DC voltage at the secondary. It is advisable to remove V 4 when testing L8 (Fig. 5) , to avoid possible confusion due to grid current flow and clamping action. If a voltage reading occurs on the VTVM, the presence of leakage between primary and secondary is confirmed, and the IF transformer must be replaced.
Leakage in Iron-Core Coils
In iron-core coils such as the one depicted in Fig. 1, leakage to the core imposes excessive DC current drain, that can burn out the winding in a flyback transformer. The flyback pulse sometimes arcs through the leakage resistance, causing fluctuation of width or height in the picture. In other cases, the coil winding is damped excessively, causing a stubborn
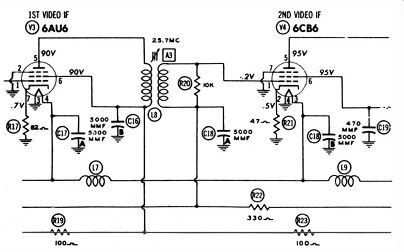
Fig. 5. Leakage in L8 upsets AGC action.
lack of picture height or width. All yokes have cores (not shown in Fig. 1), and leakage to the core may cause keystoning of the picture, in addition to loss of normal height or width.
Tests of output transformers and yokes for leakage can be made on the leakage function of a capacitor tester. However, since only a few hundred volts can be applied, the leakage resistance does not always show up. If there is any doubt, a substitution test is advised.
WINDING-TO-CORE CAPACITANCE
Sometimes we need to know the winding-to-core capacitance of a transformer. For example, when selecting a replacement power transformer for critical damper circuitry, the damper heater winding must not exceed a specified maximum capacitance to core. Otherwise, the picture will lack sufficient width.
The winding-to-core capacitance can be easily measured on a service-type capacitance bridge, as shown in Fig. 6.
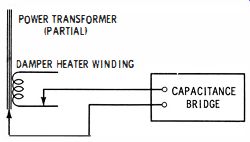
Fig. 6. Measurement of winding to core capacitance in II transformer.
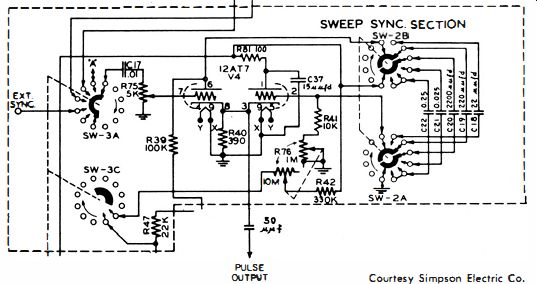
Fig. 7. Typical pulse take-off circuit.
RINGING TESTS
Ringing tests of inductive components have become increasingly popular in the past year or two. Much of their appeal is doubtlessly due to the simplicity of the tests. When a suitable standard of reference is available, a ringing test is definitive. Ringing tests are made with a scope and a source of pulse voltage. In service applications, the pulse voltage is obtained from the horizontal-deflection section of the scope itself. Some of the more recent service-type scopes are provided with a pulse-output terminal on the front panel. In any case, it is easy to bring out a pulse voltage on any scope.
If a scope utilizes a cathode-coupled multi vibrator, as in Fig. 7, the common cathode resistor (R40) is a convenient pulse source. The pulse voltage is brought out in series with a small coupling capacitor--50 mmf is typical. When the scope does not have a cathode-coupled multivibrator, you can use the plate of the sawtooth amplifier tube as a pulse source. In this instance a coupling capacitance of 10 mmf is usually ample, because of the comparatively high amplitude of the sawtooth voltage.
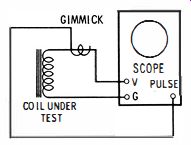
Fig. 8. Setup for ringing test.
The test procedure is very simple. Connect the coil under test to the vertical-input terminals of the scope, as shown in Fig. 8. There are two common methods of injecting the pulse voltage. A "gimmick" is preferred by some technicians, because the coupling is very loose and imposes the least loading on the coil. However, in case the amplitude of the pattern is too low, you can connect the pulse lead directly to the vertical input terminal.
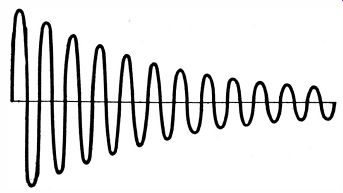
Fig. 9. Exponentially damped sine wave.
Advance the vertical-gain controls of the scope as required, and the ringing pattern will appear on the screen. The pattern is automatically in sync, because the pulse is initiated during the retrace interval. To display a suitable number of ringing cycles, adjust the horizontal deflection rate so that the pattern shows the major portion of the decay interval in the damped sine waveform (Fig. 9) . The waveform has an exponential envelope, just as the discharge of a capacitor through a resistance has an exponential waveform. This is the type of waveform displayed when a ringing test is made on a width coil, for example.
This is a comparative test. This means that the decay rate is observed on the scope screen and compared with the decay rate of a similar coil that is known to be good. Whereas it is possible to evaluate the waveform for various electrical data, most technicians do not wish to take the time required to make the incidental calculations. Note in Fig. 9 that the ringing waveform has decayed to Vs of its initial amplitude after 11 cycles. Now, if a test coil decays the same amount after 6 hz for example, it is concluded that shorted turns or an equivalent defect is present.
Transformer Waveforms
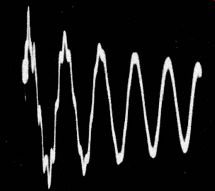
Fig. 10. Ringing waveform of transformer winding.
Next, consider a ringing test of a flyback transformer. The pattern is more complex than for a simple coil. A low-amplitude wave at higher frequency is superimposed on the main decay wave. This modified waveform results from transformer action.
Since there is more than one winding on the transformer, and the windings are coupled to each other, when the tests pulse is applied, the pulse is coupled into all of the windings on the core, and a multiple ringing pattern occurs (Fig. 10 ). However, the principle of the ringing test is the same as before two transformers of the same type display the same ringing waveform, if they are both good.
It will be found that some transformers will not ring. Such transformers may be overdamped (have a low Q) , as exemplified by many audio types, while others may not respond to a ringing test because their natural resonant frequency is too high to pass through the scope. Thus, you might or might not observe a ringing waveform in a test of an intercarrier-sound coil or transformer, whereas, any service scope will display the ringing waveform produced by the IF transformer from a broadcast radio receiver.
VIDEO-FREQUENCY SWEEP TEST
(A) Test setup. (b) Normal curve. (C) Peaking coil open.
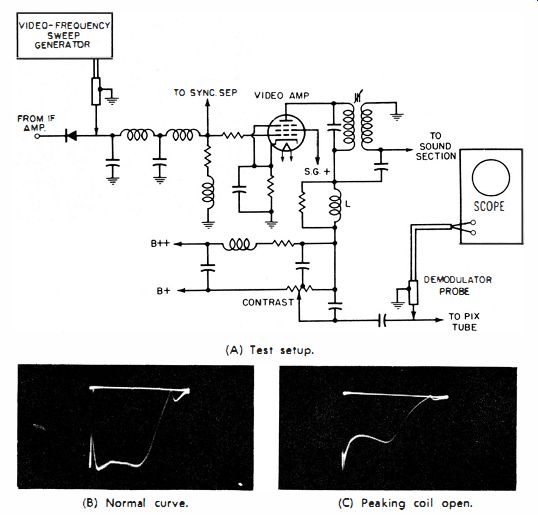
Fig. 11. Sweep frequency test of video amplifier.
Peaking coils are used in video amplifiers and scope amplifiers to maintain a uniform high-frequency response. Some peaking coils are shunted by damping resistors ; for example, L in Fig. 11A is damped. If the coil should open, the circuit continuity is maintained by the damping resistor. However, the high-frequency response of the amplifier then is impaired.
This defect is readily detected in a sweep-frequency test. The normal frequency response appears in Fig. 11B, and the effect of an open circuit in L is seen in Fig. 11C. Open coils are usually the result of mechanical damage, although corrosion occasionally eats through the small wire.
Poor solder joints are sometimes offenders. Damaged or corroded peaking coils may also have shorted turns, which reduces the inductance and increases the coil losses. This type of defect is also discovered in a video-frequency sweep test ; the high frequency response is attenuated, and the response curve may also show excessive mid-band dip.
It is easier to check out the peaking coils in a scope than in a TV receiver. The advantage here is that the scope serves as its own indicator. The output from a video-frequency sweep generator is applied to the vertical-input terminals of the scope. If a 4-mhz trap is connected as shown in Fig. 12, an absorption marker appears at the 4-mhz point on the pattern envelope. If one or more of the peaking coils in the scope vertical amplifier are defective, the pattern will be attenuated and distorted over the high-frequency region.
(A) Test setup. (b) Scope display.
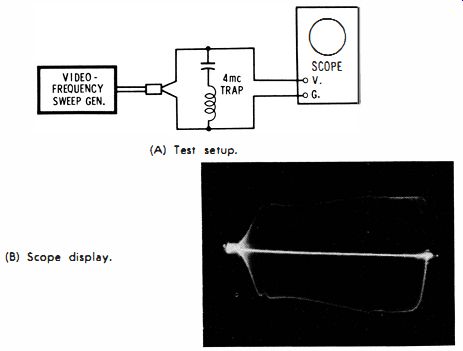
Fig. 12. Frequency response of scope vertical amplifier.
COIL TESTS WITH AN INDUCTANCE BRIDGE
An inductance bridge is usually one function of an impedance bridge ; the other functions typically comprise a capacitance bridge and a Wheatstone bridge. Kit-type impedance bridges are reasonably priced, and are a valuable addition to shop instrumentation. The most common type of inductance bridge balances inductance in one arm of the bridge against capacitance in the opposing arm, as illustrated in Fig. 13.
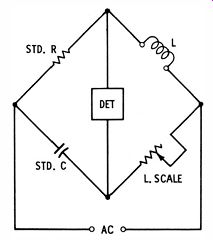
Fig. 13. Simplified schematic of inductance bridge.
Note that the inductor under test (L) is connected into the arm opposite the standard capacitor. This configuration is necessary because the inductor draws a lagging current, whereas the capacitor draws a leading current.
High-Q Coils
If the inductor under test should have a very high Q, an adequate null indication can be obtained with the simple bridge shown in Fig. 13. The rheostat opposite the standard resistance is provided with a scale that is calibrated in henrys or millihenrys. This type of bridge must be driven at the frequency at which it is calibrated (usually 1 khz), and the AC source must have a good sine waveform. Otherwise, the inductance dial calibration will not read accurately.
Since the majority of inductors tested in service shops have appreciable resistance, the coil under test consists effectively of inductance in series with resistance. The effective series resistance lowers the Q of the coil and prevents obtaining a complete null on a simple bridge such as the one shown in Fig. 13. Moreover, the inductance scale reads incorrectly on a partial null. A practical inductance bridge makes provision for balancing the effective series resistance of a coil which, incidentally, gives a measure of the Q. Testing a Coil for L and Q Values A complete, basic bridge circuit for measuring L and Q values is shown in Fig. 14. A rheostat with a scale calibrated in Q values is connected in series with the standard inductor inside the bridge. Now, a complete null can be obtained for coils having moderate or low Q values. Beginners are sometimes confused because they do not understand that it is often necessary to "chase the null" at some length. That is, a partial null is obtained in many tests while the L and Q controls are still far from the complete balance settings. To obtain a better null-indication, the inductance control must be turned a small step in the suitable direction ; then when the Q control is reset, the bridge becomes more nearly balanced.
The complete null (zero indication ) is obtained only after a number of back-and-forth adjustments of the L and Q controls.
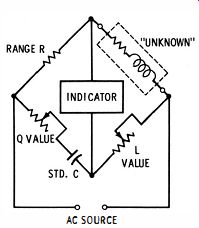
Fig. 14. Complete bridge for measuring.
Coils Which Provide a Minimum Null Only
Beginners are also sometimes puzzled by the fact that only a minimum null-indication can be found when some types of iron-core coils are tested. No adjustment of the L and Q controls suffices to obtain a complete null, and the readings of the minimum null must be accepted. This characteristic results from the fact that some iron cores produce an appreciable iron third-harmonic distortion of the bridge current in the unknown arm. In other words, the magnetic flux produced in the coil has a nonlinear relation to the coil current. The resulting distortion of the bridge-voltage waveform prevents the determination of a complete null. In the first analysis the dial readings at the minimum null indication are accepted.
The essential point is to understand bridge operation and to know inductor theory. Technicians often condemn a good inductance bridge simply because they do not understand the properties of practical iron-core coils and have not become sufficiently familiar with inductance-bridge operation. The configuration shown in Fig. 14 is called a Hay bridge. It is well suited to measurement of inductance values that are associated with Q values from 10 to 1,000. However, some coils encountered in service work have a Q value less than 10. In this case, the Maxwell bridge shown in Fig. 15 is more suited to accurate measurement. Note that the Q rheostat is connected across the standard capacitor, instead of in series. A separate dial scale is used.
Why a Standard Capacitor Is Used
Most bridges measure inductance values with reference to standard capacitances. A standard capacitor is preferred to a standard inductor, for two reasons. First, its cost is comparatively small. Second, a standard capacitor has a negligible external field ; it neither induces spurious voltages in nearby circuits nor picks up spurious stray fields. In addition, a standard capacitor makes a more compact bridge possible. Finally, in an impedance bridge the standard capacitors do double duty in the capacitance-bridge function.
Meaning of a Q Value
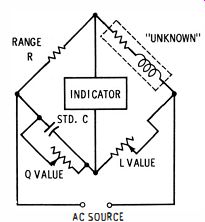
Fig. 15. Bridge for measuring low Q.
A Q value is termed a quality factor. It is the ratio of inductive reactance to resistance, or, Q = XL/R. Consider a 100 millihenry coil that has a resistance of 60 ohms. Since XL = 2 pi fL, the inductive reactance of the 100-mh coil at 1 khz is approximately 600 ohms, and its Q at 1 khz is equal to 600/60, or 10. It is important to note that inductive reactance is a function of frequency ; therefore, a Q value is meaningless unless you state the frequency at which the Q was measured.
Since inductive reactance is directly proportional to frequency, a coil that measures a Q of 10 at 1 khz is expected to have a Q of 20 at 2 khz, and a Q of 5 at 0.5 khz. Therefore the Q of a coil at any frequency can easily be calculated after its Q has been measured at a certain frequency. This simple relation of Q values at various frequencies becomes less accurate as you depart widely from the frequency of measurement. It is less accurate in the case of iron-cored coils than air-core coils. In summary, unless you are considering operating frequencies fairly close to the frequency of the Q measurement, the bridge should be powered from an external oscillator and the test made at the actual operating frequency.
INDUCTANCE SHIFT OF IRON-CORE COILS
Beginners sometimes assume that if a coil has a certain inductance at 1 khz, it will have the same inductance at 60 cycles.
This assumption is approximately correct for air-core coils, but is often in serious error for iron-core coils. The reason is that iron cores often have a very different magnetic characteristic at different frequencies. This effect is minimized in hi-fi audio transformers, but it is still present to some extent.
In the case of low-quality, iron-core coils, an inductance value might be very misleading unless the test frequency is noted.
Some iron-cored inductors also shift their inductance value when the test current is varied in the bridge. Most inductance bridges have a level control that can be set to pass small or large AC currents through the coil under test. In many cases the inductance reading shifts to a lower value when the bridge current is increased. If the shift is substantial, a valid measurement must state the current flow that is present at the measured value of inductance. An AC current meter can be connected in series with the coil under test to measure the current flow.
Obtaining Maximum Accuracy
Recall that an iron-core inductor may generate an iron third harmonic, due to the lack of ideal characteristics in the magnetic core. This impairs the accuracy of indication in a simple inductance bridge. Nevertheless, suitable methods permit accurate measurement of inductance values at the bridge driving frequency, such as 1 khz. One method employs a tuned transformer between the bridge arms and the indicator. Thus, if the bridge operates at 1 khz, the transformer is also tuned to 1 khz. The passband of the tuned transformer is made sufficiently narrow so that any harmonics of 1 khz are rejected.
This permits a true and complete 1- khz null to be obtained.
A simpler method is to use a pair of earphones as the null indicator. After a little practice, you can easily distinguish between the 1- khz tone and the higher-pitched harmonic tones.
Then the bridge is nulled on the 1- khz tone, and the higher tones are neglected. While the residual harmonics tend to mask the 1- khz null, a trained operator can make an accurate null determination.
Courtesy Paco Electronics Co., Inc.
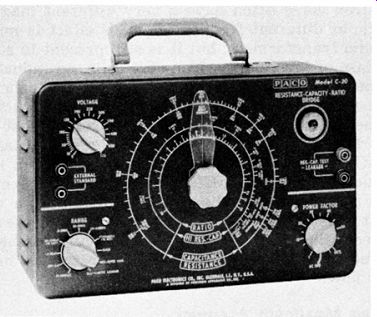
Fig. 16. Capacitance bridge with ratio scale.
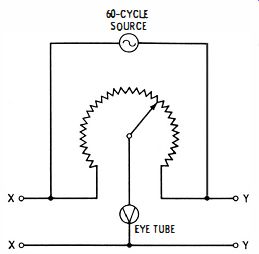
Fig. 17. Plan of a ratio bridge.
COIL TESTS WITH A RATIO BRIDGE
Some capacitance bridges, such as the one illustrated in Fig. 16, have a ratio or comparator function with a ratio scale calibrated from 0.05 to 20, corresponding to ratio values over a range of 400 to 1. The basic plan of all such ratio bridges is shown in Fig. 17. This function of a capacitance bridge makes possible the measurement of impedance and inductance values of coils. When a ratio bridge is employed, it operates as a 60 -hz Wheatstone bridge, with two pairs of test terminals XX and YY, as depicted in Fig. 17. The calibrations on the ratio scale correspond to potentiometer settings.
If two identical coils are connected at XX and YY respectively, the ratio bridge will balance at 1 on the scale. This simply means that the two have the same impedance value.
Also, if one coil has twice the impedance of the other coil, the ratio bridge will balance at 2 on the scale. The scale, of course, might read 0.5 instead of 2; this depends on which coil you connect to the YY terminals. With the large coil at YY and the small coil at XX, the scale reading will be 2. With the large coil at XX, and the small coil at YY, the reading will be 0.5 at balance. Either reading, of course, is correct-the ratio bridge is indicating that one coil has twice the impedance of the other coil.
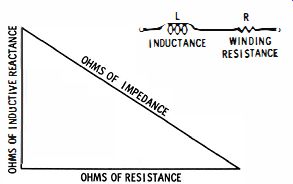
Fig. 18. Inductance and resistance form impedance.
STANDARD INDUCTANCE
Instead of merely comparing the impedance of two coils, one is usually interested in specific values. Two basic questions will be asked :
1. What is the impedance of a certain coil, in ohms?
2. What is the inductance of the coil, in henrys or milli-henrys? To measure these values, a suitable standard of inductance is needed. Lab standards are available and are ideal for this they are also quite expensive. For shop applications, commercial inductors for replacement purposes are adequate, provided they have a reasonably accurate inductance rating. Thus, you might choose a good-quality width coil rated at 100 mh or a choke that is rated at 1 henry.
Any coil has winding resistance as well as inductance. The winding resistance can be measured with an ohmmeter. Together, inductance and winding resistance form the impedance of the coil, as shown in Fig. 18. Resistance combines with inductive reactance at right angles to form the impedance of the coil. Recall that inductive reactance is equal to 2 pi fL, or in 60 -hz tests, the inductive reactance is equal to 377L ohms, where L is given in henrys.
For example, if a coil has 40 ohms resistance and 30 ohms reactance at 60 cycles, it has 50 ohms of impedance at 60 cycles.
This is just another way of saying that if a right triangle is drawn with a base 4 inches long and an altitude 3 inches high, the hypotenuse will measure 5 inches in length.
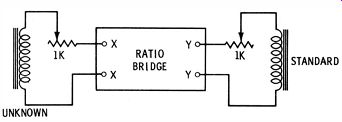
Fig. 19. Potentiometers used to equalize Q values.
Measurement of Coil Inductance
To measure the inductance of a coil, using a ratio bridge and a standard inductor, connections are made as depicted in Fig. 19. Note that a pair of 1K resistors have been included.
These are utilized to balance the winding resistances of the two coils, so that the ratio bridge can be completely balanced.
At the outset, it is unknown which coil will require additional series resistance to obtain a complete null. So start with both 1K potentiometers set to zero resistance, and adjust the bridge for a partial null. Then, advance one of the potentiometers to see if the null is improved ; if not, return it to zero, and advance the other potentiometer. At balance, suppose the ratio scale reads 3, with a 100-mh coil connected in the standard position (to terminals YY in Fig. 19 ). It follows that the inductance of the coil under test is 300 mh.
Q Value at 60 Cycles
After measuring the inductance of a coil on the ratio bridge, the question may be asked what the Q value at 60 cycles might be. Continuing with the previous example in which the coil under test measures an inductance of 300 mh, an ohmmeter might indicate a winding resistance of 37.7 ohms.
In this case, its 60 -hz Q is equal to 3. In other words, Q = Xr./R = 113.1/37.7 = 3. At some other frequency, of course, the coil will have some other value of Q. The change of magnetic core characteristics with frequency has been noted previously.
Changing resistance must also be taken into consideration at higher frequencies, even if the coil has an air core ; at low frequencies, the AC resistance of the coil approaches the DC resistance, but at high frequencies the AC resistance is much greater than the DC resistance. The Q factor is based on AC resistance. At 60 cycles, the AC resistance of a coil is practically the same as its DC resistance.
DISTRIBUTED CAPACITANCE OF AUDIO-FREQUENCY COILS
Any coil has some value of distributed capacitance and this capacitance operates effectively as a capacitor shunted across an ideal inductance. Hence, all coils are self-resonant at a frequency given by the familiar resonant-frequency formula : f = 1/ (2 pi LC ). This is a parallel-resonant situation, so that the coil has a very high terminal impedance at its self-resonant frequency. Obviously, if a coil should be self-resonant at 1 khz, an inductance bridge would not respond on the basis of inductive reactance, but would read a much higher value-the value of the coil impedance at resonance.
It follows that an inductance bridge must be driven at a frequency considerably away from the self-resonant frequency of the coil under test ; otherwise, the inductance reading will be false. This source of error is encountered in the shop chiefly when measuring the inductance of audio-frequency coils. For example, if you measure the primary inductance of an audio-output transformer on a 1- khz bridge, you will obtain an absurd inductance reading. Hence, it is standard practice to measure the inductance of audio-frequency coils at 60 cycles which is usually readily available.
MEASUREMENT OF SELF-RESONANT FREQUENCY
It is clearly helpful to know the self-resonant frequency of an unknown coil before proceeding with bridge measurements of inductance. If the self-resonant frequency is known, you can choose a bridge-driving frequency that is sufficiently low so that the distributed capacitance of the coil can be disregarded. The easiest way to measure the self-resonant frequency of a coil is to make a ringing test (Figs. 8, 9) . Count the number of cycles displayed in the ringing pattern and, then, without changing the scope controls, disconnect the coil and apply the output from an audio oscillator. Tune the audio oscillator to display the same number of cycles observed in the ringing pattern. The dial of the audio oscillator then indicates the self-resonant frequency of the coil.
FREQUENCY-CORRECTION FACTOR
When the self-resonant frequency of a coil is near 1 khz, the internal oscillator in a 1-khz inductance bridge cannot be used.
Instead, the bridge must be driven from an external source such as an audio oscillator. A 500-hz test frequency would be suitable, for example. Use of the lower test frequency will not affect the reading of the dial on the inductance bridge. In addition, the Q dial must be corrected for the new test frequency. In this example, the measurement is being made at half the frequency for which the Q dial was calibrated ; therefore, the reading of the Q dial must be divided by 2. If the Q dial should read 12, the actual Q value is 6 when the bridge is driven at 500 cycles. Furthermore, if the bridge were driven at 250 cycles, the Q dial reading of 12 must be divided by 4- the actual Q value will be 3.
BRIDGE TESTS OF TRANSFORMERS
Many iron-core transformers, such as those used in audio circuitry and power supplies, are designed to have the maximum coupling possible between primary and secondary. That is, the mutual inductance between primary and secondary is maximized. All other things being equal, an audio-output transformer is considered better than another comparable transformer if it has a greater mutual inductance. It is comparatively difficult to obtain full mutual inductance in such transformers, because of the large winding ratio.
If a transformer primary has an inductance L1 when measured by itself, and the secondary has an inductance L2 when measured by itself, the maximum mutual inductance attainable in theory is equal to VL1L2. Two tests are necessary to measure mutual inductance (Fig. 20) . In the case of an audio-output transformer, which is likely to be self-resonant in the vicinity of 1 khz, the measurements must be made at a reduced bridge frequency. The primary and secondary are connected in series, and their total inductance Lt1 is measured.
Then, the secondary connections are reversed, and the total inductance Lt2 is measured. The mutual inductance of the transformer is then given by (Lt1 - Lt2 ) /4.
The same method is applicable to measurement of mutual inductance in air-core transformers, which have comparatively loose coupling. As an example, an IF transformer from a hi-fidelity AM receiver has a primary inductance which measures 29 mho The secondary inductance measures 124 mho The theoretical maximum mutual inductance should be 60 mh. When series-aiding and series-opposing inductance measurements are made next, the measured values are 188.6 mh and 117.4 mh. By calculation, the mutual inductance of this IF transformer is 17.8 mh.
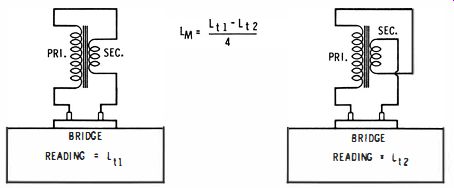
Fig. 20. Measurement of mutual inductance.
COIL TESTS WITH VTVM AND AUDIO OSCILLATOR
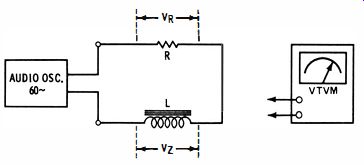
Fig. 21. Inductance test circuit.
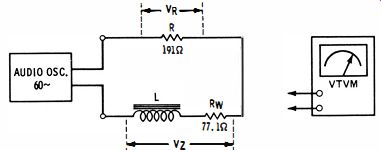
Fig. 22. Separation of inductance and winding resistance.
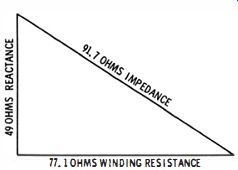
Fig. 23. The impedance triangle.
You can also measure the inductance of iron-core or large air-core coils with a VTVM and an audio oscillator. The basic test circuit is shown in Fig. 21. A low test frequency (such as 60 cycles ) is employed so that AC and DC coil resistance will be essentially the same. An audio oscillator is used to ensure a good waveform, thereby providing maximum accuracy of AC voltage measurements. The winding resistance of the inductor is measured with an ohmmeter or on a resistance bridge. In a typical example, the winding resistance of the coil under test measured 77.1 ohms.
In the test circuit detailed in Fig. 22, the winding resistance is shown separate from the inductance. Together, inductance L and the 77.1-ohm winding resistance form an impedance. The series resistor R that was utilized had a measured value of 191 ohms. A measurement of V R gave a reading of 4.6 volts. Since I = E/R, the current flow in the circuit is evidently 24 ma.
A measurement of V 7. gave a reading of 2.2 volts. Since Z = Ell, the corresponding impedance was calculated to be 91.7 ohms. Now, the impedance and winding resistance must be scaled off and combined in a right triangle, as shown in Fig. 23. The triangle has an altitude that scales off as 49 ohms.
From this fact, the inductance L can be calculated. Since XL = 2 pi fL, it is clear that L = 49/377, or 130 mh, in this example. To check the apparent error, a cross-check was made with an inductance bridge, which gave a reading of 114 mh.
The apparent error is about 14 %, which could be roughly charged to the VTVM method of test (the actual accuracy of the bridge measurement was of course unknown). However the bridge test is assumed to be more accurate.
Inasmuch as the preceding method requires calculations, it is more time-consuming than an inductance-bridge test. However, when a bridge is not available, the alternate method is highly desirable.
REFLECTED RESISTANCE OF A TRANSFORMER
Audio technicians, in particular, are often concerned with the reflected resistance of a transformer. This knowledge is required to match impedances and obtain maximum power transfer. A transformer steps-up or steps-down impedance as well as voltage and current. Consider the simple configuration shown in Fig. 24. The generator has an emf of 80 volts and an internal resistance of 400 ohms. It is desired to transfer maximum power to a 25-ohm load. A 4 to 1 stepdown transformer is required.
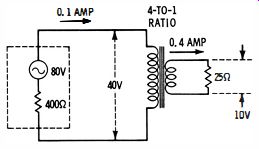
Fig. 24. Maximum power transfer to 25-ohm load.
The transformer steps 40 volts at the primary down to 10 volts at the secondary. The secondary current is given by Ohm's law, I = E/R, or I = 400 ma. The primary current is 100 ma, because the 25-ohm load on the secondary is reflected back into the primary as a 400-ohm load. In other words, the impedance transformation is equal to the square of the turns ratio; the impedance transformation is 42 to 1, or 16 to 1. The primary current is stepped-up four times, from 100 ma in the primary to 400 ma in the secondary.
The generator supplies 8 watts (80 volts times 0.1 ampere ) to the primary circuit. The secondary dissipates 4 watts. Half the primary power is dissipated by the internal resistance of the generator. This is the matched condition. So when impedances (in this example, resistances ) are matched, half of the generated power is transferred to the load.
Transformer Test
A good audio-output transformer not only provides a match of the load to the source, but also reflects a purely resistive load. That is, if the secondary of a transformer is connected to a resistor, as in Fig. 25, a test with an impedance bridge across the primary should give a resistance reading only-no inductance should be measurable across the primary terminals.
This is an ideal situation ; in practice, there is at least a little residual inductance present in this test. The better the trans- former is, the less is the inductance found at the primary.
Hence, this is a good comparative test in selection of output transformers.
Note that the value of R used in the test of Fig. 25 is not critical-merely use a value in the general range for the intended application; it makes no difference what resistance value is reflected back into the primary. The chief concern in this test is whether excessive inductance might appear with the reflected resistance. What is the source of spurious inductance in this configuration? It stems from uncoupled inductance in the primary and secondary windings ; the mutual inductance of primary and secondary is not maximized in actual transformer design. In an ideal transformer, there is no stray flux and no uncoupled inductance. A resistive load on the secondary would be reflected as a pure AC resistance at the primary terminals.
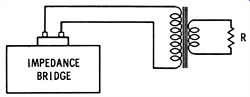
Fig. 25. Test of reflected resistance.
Test of Winding Ratio
The winding ratio of a transformer can be easily measured, provided the transformer has an iron core. You can apply a convenient AC voltage to the primary and measure the voltage at the secondary. The voltage ratio is equal to the winding ratio. Another easy method of testing the winding ratio is to use a ratio bridge, as previously described. Simply connect the primary leads of the transformer to one pair of terminals on the ratio bridge, and connect the secondary leads to the other pair of bridge terminals. If a null is not obtained on the first test, reverse the primary terminals. The scale of the ratio bridge reads the winding ratio when the bridge is balanced.
Note that such tests presuppose that the primary is tightly coupled to the secondary. This is almost always true of iron-core transformers. However, in the case of air-core transformers, other methods are required to accurately measure winding ratios. For reasons that will be explained in the next section, the winding ratio of air-core transformers is usually minor or of no concern, since other parameters dominate the action of air-core transformers in most situations.