AMAZON multi-meters discounts AMAZON oscilloscope discounts
Oscilloscope-pattern reading might seem to be one of the "occult arts;" however, it is very easy to obtain considerable information from a scope pattern even when you disregard most of the fine points. For example, the height of a waveform immediately shows its peak-to-peak voltage (on a calibrated scope) , because a scope is basically a voltmeter. A few scopes indicate peak-to-peak voltages directly, but most must be previously calibrated from a source of known peak-to-peak (or DC) voltage. Calibration procedure is not covered in this book, but you may consult your scope instruction booklet or such texts as 101 Ways to Use Your Oscilloscope and Troubleshooting With the Oscilloscope. Although a scope is fundamentally a voltmeter, it is a much more versatile instrument.
CAPABILITIES OF THE OSCILLOSCOPE
A scope has the ability to measure basic electrical quantities and to show the relation between two or more of these quantities. It can relate one or more of these quantities to a controlled time reference. Thus, a scope can display characteristics such as waveform, frequency, and phase in addition to various voltage values. Attenuators and amplifiers are used in a scope to displace the electron beam vertically on the cathode-ray tube screen. Simultaneously, and in step with the signal voltage, the electron beam is swept, or deflected, horizontally by a sawtooth voltage generated inside the scope. The horizontal-deflection frequency is a simple fraction, or subharmonic, of the signal frequency.
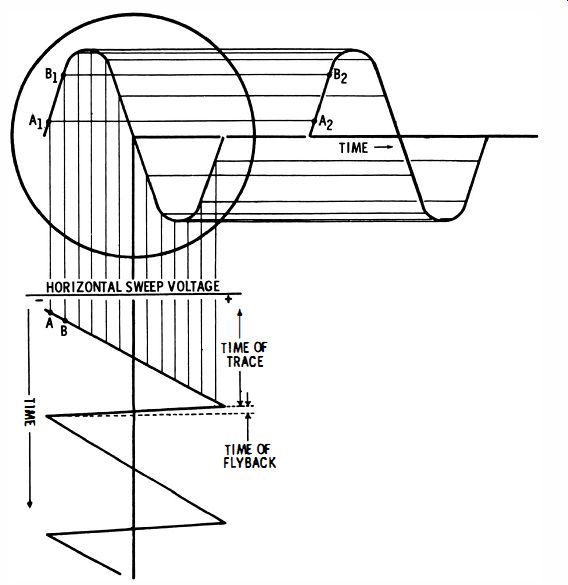
Fig. 2-1 . Development of a sine-wave display using sawtooth sweep.
Fig. 2-1 shows how this display action occurs. Start at an instant when the sawtooth horizontal sweep voltage is close to maximum negative polarity (point A) . The CRT beam at that instant will be at the left side of the screen, because the sawtooth voltage is negative. At this same instant the sine-wave voltage applied to the scope vertical input terminal is close to zero (point A2) . Accordingly, the beam at this point has little vertical deflection, and the spot is located at point A1 on the scope screen.
Next, the horizontal sweep voltage is less negative (point B) , and the beam is at a point nearer the center of the screen. At this same instant the sine-wave voltage applied to the vertical input terminals has risen to a more positive voltage (point B2) , causing the beam to be deflected upward on the screen.
Thus, the beam has moved upward and to the right and is now located at point B1. This action continues, Le. , the beam moves horizontally toward the right side of the screen, while its vertical position follows the polarity and instantaneous voltage of the sine wave applied to the vertical input terminals. In this wave a complete waveform is traced on the screen.
BASIC ELECTRICAL QUANTITIES
An understanding of waveforms stems from recognition of the basic electrical quantities. The volt is the unit of electrical pressure. It is the force which must be applied before current will flow. Current consists of the transport of electrons, and the ampere is the unit of current flow. If 6.28 X 10¹⁸ electrons are passing a given point each second, 1 ampere of current is flowing. The ohm is the unit of resistance. It is an opposition to current flow in the same manner that friction opposes mechanical motion. If 1 volt forces a current of 1 ampere to flow through a circuit, the resistance of the circuit is 1 ohm. This is simply the statement of Ohm's law: 1 = E/R. Ohm's law applies to both DC and AC circuits. In other words, voltage, current, and resistance are related in the same way in either an AC or DC circuit. However, an AC circuit often has an additional opposition to current flow that is called reactance. Thus, a capacitor has capacitive reactance, which is measured in ohms. Also, an inductor has inductive reactance, which is measured in ohms. The combination of resistance and reactance is called impedance, which is also measured in ohms. If you apply 117 volts from a 60-cycle AC line to an impedance of 117 ohms, 1 ampere of alternating current will flow. The symbol for impedance is Z. Ohm's law for AC is : 1= E/Z.
WHAT IS A WAVEFORM?
Technicians who are unacquainted with oscilloscopes often ask: "Just what is a waveform?" Most waveforms are electronic graphs of AC voltages with respect to time. In other words, a waveform shows instantaneous voltage values and how the voltage rises and falls with time. Students in technical schools usually prefer to approach waveforms on the basis of graphs.
For example, Fig. 2-2 shows a sine graph compared with a sinewave display on a scope screen. In this illustration y corresponds to voltage, and x corresponds to time. If you are discussing a 60-cycle sine wave, one complete cycle occurs in 1/60 second, and one-half cycle occurs in 1/120 second.
Instantaneous voltages are evident in the Fig. 2-2A graph.
The peak or crest value of the sine wave is 1 (or 100%). Observe that the sine wave has a value of 50% at 300. If a 60-cycle sine wave is being considered, the time interval from 00 to 300 is 1/720 second, since one complete cycle, or 360 degr. occupies an elapsed time of 1/60 second, and 300 is 1/12 of a complete cycle.
A sine wave such as that depicted in Fig. 2-2B repeats itself until the voltage is removed. In other words, the sine waveform goes through a positive excursion (or half cycle), then through a negative excursion (or half cycle) , after which it repeats the positive excursion and the negative excursion. A sine wave is therefore a recurrent waveform.
The sine wave has only one frequency. In this respect it differs from many other waveforms which will be explained subsequently. The frequency of the sine wave is related to the time required to complete one full cycle. In the case of a 60 cycle sine wave, one cycle is completed in 1/60 second. In turn, 60 cycles are completed in one second, so that its frequency is stated as 60 cycles per second. The word second is often dropped, and the waveform is then said to have a frequency of 60 cycles. Nevertheless, it is always implied that the stated number of cycles occurs in one second.
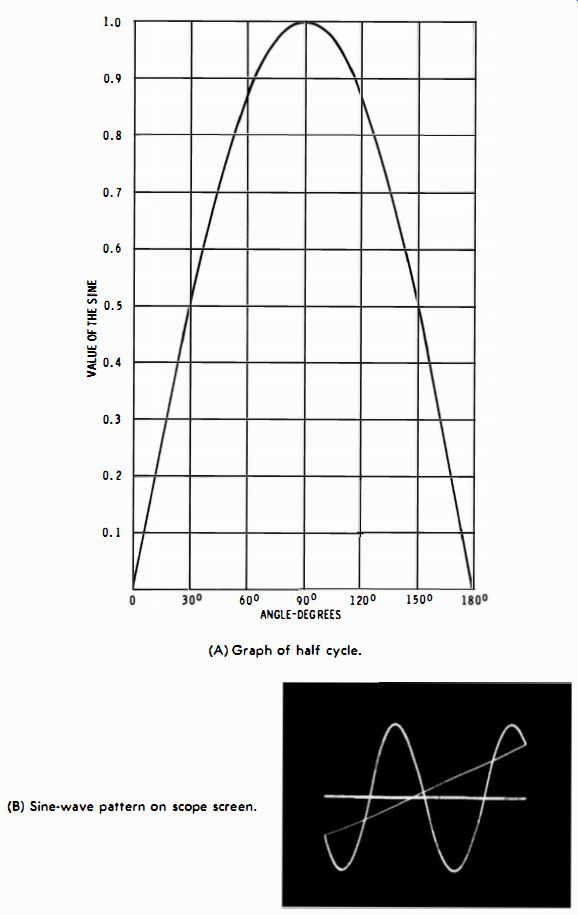
Fig. 2-2. Sine waves. (A) Graph of half cycle. (B) Sine-wave pattern on scope
screen.
Construction of a Sine Wave
Just what is meant by the term "degrees ?" Why does the complete cycle occupy 360°, and why are instantaneous voltages related to angles ? These terms result from circle characteristics and sine-wave characteristics. In Fig. 2-3, the full circle contains 360 degr. by definition. If you travel counterclockwise around the circle from zero and stop at P1, you have gone 1/12 of the total circumference, or 30°. At point P1 the vertical distance is half of the maximum value. In other words, the angle theta (B) is 30° at P1, and the related sine wave has half its peak value. Next, if you proceed to point P2, you have gone 1/6 of the total circumference, or 60° . At P2 the vertical distance is about 0.866 of the maximum value. Otherwise stated, the sine of 30 ° is 0.5, and the sine of 60 ° is approximately 0.866.
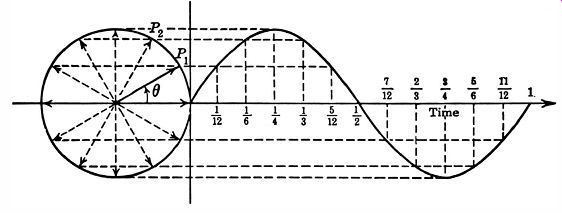
Fig. 2-3. Construction of sine wave based on angles of a circle.
The correspondence between angles and voltage amplitude should now be clear. This is a vital point, because you will eventually need to measure the phase difference between two sine-wave voltages. The phase difference is stated as an angle of separation between the two sine waves. A phase angle can also be expressed as a time difference. Hence, if one sine wave starts after another, you can state either the phase angle or the time delay between them.
At this point, it is not essential to consider details of phase measurements. What is important is that you understand what is meant by a phase angle and how the instantaneous voltages of the sine wave are tied in with the instantaneous phases of the wave. You have probably heard, for example, that the current in a capacitor leads the voltage across the capacitor by 90°. This simply means that the voltage starts 90° or 1/4 cycle after the current. The current through a pure inductance lags the voltage across the inductor by 90 °, which means that the current starts 90 ° or 1/4 cycle after the voltage. Later it will be shown how equipment can be connected to display both voltage and current waveforms simultaneously, thereby showing on the scope the phase difference between voltage and current.
SINE-WAVE VOLTAGE SOURCES
Ordinarily 117-volt 60-cycle power sources provide a sine waveform. (In some cases this waveform may be distorted.) Another basic source of sine waves is a freely oscillating LC circuit; this is an electrical system which is analogous to a vibrating string. Audio oscillators widely used in electronics test procedures generate a sine waveform. Generally, an RC (resistance and capacitance) circuit is suitably connected to a vacuum tube to form an oscillator. Either the capacitance or the resistance, or both, are variable in order to adjust the frequency of the sine-wave source. Signal generators, also used widely in test work, generate waveforms from LC (inductance and capacitance) circuits connected to vacuum tubes in oscillator configurations. The generated frequency is varied by changing the capacitance and/or inductance values.
The output from an audio oscillator or a signal generator is much less than that from a 117-volt power line. An audio oscillator might have a maximum output of 10 volts, and a signal generator might have a maximum output of 1 volt. Many instruments have still less output voltage. The frequency range of an audio oscillator is typically from 20 to 20,000 cycles per second.
More elaborate audio oscillators have an upper frequency limit of 100,000 hz. A typical AM (amplitude-modulated) signal generator has a frequency range from 100 khz to 50 mhz. Some AM generators have a top frequency of 250 mhz. Marker generators are accurately calibrated signal generators used in television service procedures. They commonly have a frequency range from about 4 mhz to 250 mhz and a maximum output of 0.1 volt. All such generators have one basic feature in common: their output has a sine waveform.
MARKING TIME AND INSTANTANEOUS VOLTAGES
Basic electrical quantities noted in the foregoing pages are not simply theoretical matters; quite to the contrary, each can be displayed and measured with the aid of a scope. Instantaneous voltages along a sine wave can be displayed with the arrangement depicted in Fig. 2-4A. Observe how the pattern appears as a series of dots. The dots are spaced more closely on the peaks of the sine-wave pattern than on the sides of the sine wave. Furthermore, the dots are stretched out far apart on the retrace interval. This difference is simply the result of equal time intervals between each pair of dots.
(A) Method of showing instantaneous voltages. (B) Meaning of peak-to-peak voltage.
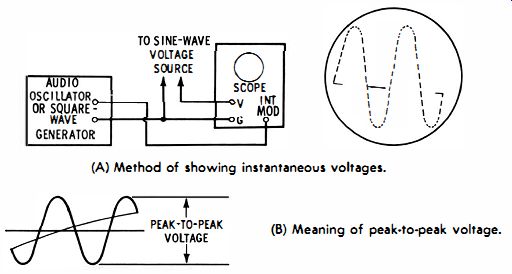
Fig. 2-4. Sine-wave voltage
Note how the pattern is developed in Fig. 2-4A. The sine wave voltage source provides the vertical deflection. This source might be from any circuit or device which generates a sine-wave voltage. Dots along the pattern are obtained by feeding an AC voltage into the intensity-modulation terminal of the scope. The action of the intensity-modulation AC voltage is to cut off the CRT beam and turn it back on at the frequency of the modulating voltage. Either an audio oscillator or a square-wave generator can be used, because the exact waveshape of the intensity-modulating voltage is not a primary consideration.
It can be seen from the time-marked pattern in Fig. 2-4A that the retrace time is quite rapid. There are 36 dots in one complete cycle of the sine-wave pattern, but there are only two dots in the retrace interval. This means that the retrace time is only 1/18 of the time taken by one cycle of the sine wave.
Suppose you are intensity-modulating the sine-wave pattern with a frequency of 2,160 hz. The time from one dot to the next is accordingly 1/2,160 second. Inasmuch as there are 36 dots in one complete cycle of the pattern, the frequency of the displayed sine wave is 60 hz.
Fig. 2-4 also clarifies the distinction between instantaneous voltages and the peak-to-peak voltage of a waveform. An instantaneous voltage might be measured at any arbitrary point on the waveform of Fig. 2-4A, but the peak-to-peak voltage is measured from the positive peak to the negative peak (Fig. 2-4B) . It is not anticipated that you will immediately proceed to set up equipment and measure instantaneous or peak-to-peak voltages; however, this understanding is very important to the beginner in electronics, because these are facts which you will use as a base on which to add future knowledge.
SYNCHRONIZATION
If you connect a test setup as shown in Fig. 2-4A, the first operating feature that you will observe is the necessity to set the audio oscillator critically to an exact harmonic of the pattern frequency. Unless the oscillator is carefully tuned, you will see the dots moving, or running along the pattern. The dots stand still only when the oscillator is tuned to an exact harmonic of the pattern frequency. Any drift of either input frequency makes the dots start to run on the pattern. This fact points up the necessity for synchronizing the marking frequency with the pattern frequency.
For this reason the audio oscillator is usually replaced by a shock-excited oscillator in laboratory or industrial instrumentation. Shock-excited oscillators are discussed in some detail subsequently; at this point you need merely note that a shock-excited oscillator is triggered by the sawtooth voltage of the scope. Because of this, the first dot in the pattern always starts exactly at the beginning of the waveform, no matter what the frequency of the shock-excited oscillator. To put it another way, this triggering method synchronizes the intensity-modulating voltage with the sweep waveform, which is in turn synchronized with the pattern frequency.
Triggering action is employed in all scopes to synchronize the sawtooth sweep frequency with the signal frequency in the scope vertical channel (Fig. 2-5) . Otherwise stated, the sawtooth waveform maintains the same phase relation to the signal at all times. The sawtooth oscillator in most scopes is a multi-vibrator configuration, and a sample of the incoming signal voltage is injected into the grid circuit of the multivibrator.
Thus, the multivibrator is triggered, and its oscillating frequency is locked to the signal frequency.
(A) Idealized sawtooth waveform with zero retrace time. (B) One-cycle display produced by actual equipment.
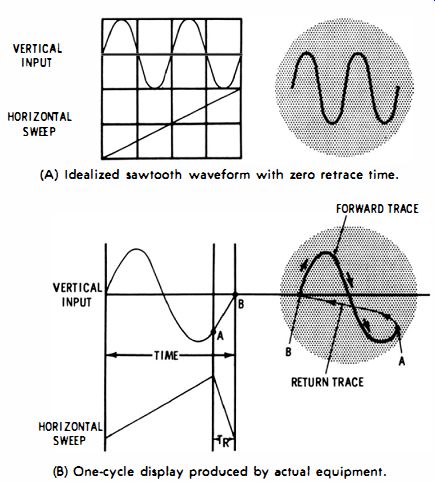
Fig. 2-5. Sawtooth wave-form synchronized with sine-wave signal.
Note also in Fig. 2-5B that the time required for retrace takes a portion out of the pattern (from A to B) . The retrace time TR is made as short as practical, but it is never possible to obtain a zero retrace time. Hence, you will never be able to see the entire signal pattern if you display only one cycle of the signal.
It is standard practice to set the sawtooth oscillator to one-half the signal frequency. This results in the display of one complete cycle, plus most of the following cycle. It is commonly said in such a case that two cycles of the signal waveform are being displayed, but if you observe the pattern closely, you will see that a small portion of the second cycle in the pattern is "bit off" by retrace, just as in the single-cycle display shown in Fig. 2-5B. Observe that the pattern depicted in Fig. 2-5B is not a true sine wave. Instead, it is a distorted sine wave--the positive peak is narrower than the negative peak. Such a waveform is often described loosely as a sine wave, but it is in fact a complex waveform. Any waveform that departs from a true sine wave is a complex waveform. This means that a distorted sine wave has more than one frequency; that is, the distorted sine wave contains harmonics. These harmonics are exact multiples of the pattern repetition rate. In other words, if the distorted sine wave has a repetition rate of 60 cycles, the harmonics in the waveform have frequencies that are 120 cycles, 180 cycles, etc.
FREQUENCY VERSUS REPETITION RATE
The terms frequency and repetition rate are often used interchangeably, although strictly speaking you can speak of frequency only for a sine wave. The reason is that a complex waveform has many frequencies. You may properly state the frequencies contained in a complex wave. On the other hand, the time occupied by one complete cycle of a complex wave is properly described by the term repetition rate. The repetition rate of a complex wave is the frequency of its fundamental frequency. Thus, a distorted 60-cycle sine wave has a fundamental frequency of 60 cycles, and its repetition rate is 60 times per second. These fine points of waveform description might seem like hairsplitting; however, you will find that when highly complex waveforms are to be analyzed, the distinctive terms become vital to avoid confusion.
What are the harmonic frequencies in a distorted sine waveform? This depends on the way in which the wave is distorted.
Some types of distortion give rise to even harmonics only (even harmonics are 2, 4, 6, etc. times the repetition rate. ) Other types of distortion give rise to odd harmonics only (3, 5, 7, etc. times the repetition rate). Still other types of distortion give rise to both even and odd harmonics. Harmonic generation is an extensive subject, and details of the process are covered subsequently.
GENERAL WAVEFORM CHARACTERISTICS
(A) Horizontal oscillator frequency panel control. (B) Display showing two cycles of waveform.
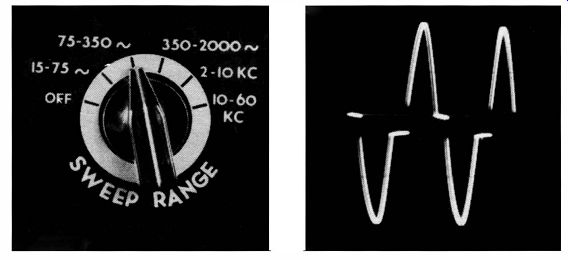
Fig. 2-6. Determination of the frequency of a waveform.
The general characteristics of any waveform are apparent from a pattern. Thus, you can observe whether the waveform in question is a sine wave, square wave, sawtooth, pulse, or some combination of basic waveforms, such as peaked-sawtooth, half-sine, sine-and-pulse, narrow pulse on a wide pulse, and so on. A peaked-sawtooth waveform is typical in vertical-sweep circuits, a half-sine waveform (hybrid sine and square wave) is typical in half-wave rectifier circuits, sine-and-pulse waveforms are typical in sync circuits, and a narrow pulse on a wide pulse forms a horizontal sync pulse.
You can determine the approximate frequency of the waveform, because the horizontal-oscillator frequency control in the scope (Fig. 2-6A) will be set to a position which corresponds to the repetition rate of the waveform. If there is one cycle displayed on the scope screen, the repetition rate will fall within the range limits indicated. Its repetition rate can be estimated more closely by observing how far the fine-frequency control has been advanced, because the continuous control fills in between the steps of the coarse control.
Thus, if the coarse-frequency control indicates that the displayed waveform has a frequency between 150 and 700 cycles, as in Fig. 2-6A (note that there are two cycles of the waveform for every cycle of the sweep), and you observe that the fine frequency control is set at the midpoint of its range, the pattern frequency will be about half way between 150 and 700 cycles, or 375 cycles. This 375-cycle estimation is necessarily approximate for two reasons. First, the sweep frequencies of a service scope are not calibrated to high accuracy. Second, internal synchronization is used in this example; this tends to force the sawtooth oscillator slightly higher than its indicated frequency.
This limitation is not present in lab-type scopes, which have accurately calibrated horizontal sweeps and trigger circuitry which does not affect the sweep frequency. This book is concerned chiefly with the analysis of patterns displayed by service-type scopes; hence, suitable procedures will be explained to determine the repetition rates of waveforms with high accuracy whenever this becomes a matter of interest. In general, these procedures utilize the accuracy provided by auxiliary equipment such as audio oscillators.
PATTERN BRIGHTNESS VERSUS BEAM SPEED
Most patterns show considerable variation in brightness. Thus, in Fig. 2-6B the retrace is just barely visible, due to its comparatively high speed of travel. This is a distorted sine-wave pattern in which the beam moves very rapidly up and down the "step" intervals. The beam speed is so high through these intervals that the trace is invisible. If the scope brightness control were advanced sufficiently to make the invisible intervals apparent, the main portion of the pattern would be badly defocused; the CRT beam current would, in turn, become so high that possible damage to the tube would result. Hence, the technician must learn to "join up" a pattern when it appears to be comprised of segments.
WAVEFORM PROPORTIONS
Although an experienced technician takes waveform proportions into account as a matter of course, the neophyte is sometimes confused by changes of proportions caused by changes in settings of the scope operating controls. A common example is confusion between a square-wave and a pulse waveform. When the vertical and horizontal gain controls are adjusted to make the amplitude of the waveform approximately equal to the width occupied by one complete cycle (Fig. 2-7 A) , the distinction between a square wave and a pulse is apparent.
When the vertical gain control is advanced and the horizontal gain control is turned back, the amplitude of the waveform is then considerably greater than the width occupied by one cycle
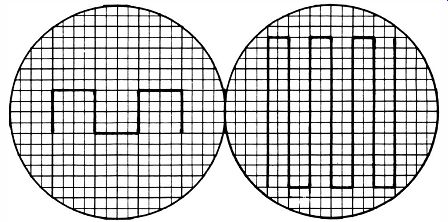
Fig. 2-7. Two displays of the same waveform. (A) Square wave displayed in
standard proportions. (B) Same square wave expanded vertically and compressed
horizontally. (Fig. 2-7B) .
There is no question as to whether the same waveform is displayed in both cases; however, an uncritical observer may jump to the conclusion that the tall square-wave display represents a pulse waveform. This error in analysis results from a limited familiarity with waveform proportions. It is customary in theory books to show waveforms in so-called standard proportions. This custom does not imply that a waveform must appear in the same proportions on a scope screen. Actually, any waveform may appear in any proportions whatsoever in the display. Note that the so-called standard proportions can always be obtained by suitable adjustment of the vertical and horizontal gain controls, plus adjustment of the horizontal deflection rate.
Theory books often limit waveform presentation to one complete cycle, although some discussions limit the presentation to two complete cycles. Receiver service data standardizes on two-cycle presentation as in Fig. 2-6B. This is simply a function of the deflection-rate adjustment. The operator has a choice of displaying one, two, three, or an indefinite number of cycles in the screen pattern. It is disadvantageous to display only one cycle, because more or less of the waveform will then be lost on retrace. On the other hand, it is also disadvantageous to display a very large number of cycles, because the pattern becomes so cramped that it is difficult to evaluate. The best practice is to adjust the horizontal-deflection rate to display two cycles, inasmuch as all details of the waveform are then clearly apparent.
BASIC FACTS OF COMPLEX WAVEFORMS
In conventional situations the sine wave is considered to be the basic waveform. Fig. 2-8 illustrates what this means. A sine wave (Fig. 2-8A) is considered to be an electrical "atom" in the building up of complex waveforms. The complex waveform in Fig. 2-8B has a fundamental frequency, or repetition rate, which is the lowest frequency in the wave. The higher frequencies are in harmonic relation to the fundamental frequency. This simply means that the harmonics are exact integral multiples of the fundamental frequency.
Thus, if the sawtooth wave depicted in Fig. 2-8B has a fundamental frequency of 60 cycles per second, its harmonic frequencies are 120, 180, 240, 300, etc., cycles per second. As higher and higher harmonics are included, the waveform becomes less wavy. To obtain a perfect sawtooth waveform with no waviness in its outline, an infinite number of harmonics must be added.
It must not be supposed that infinity is a number in any sense of the word. Infinity is something that is "always still more." You cannot say that a million-million-million cycles per second is an infinite frequency. An infinite frequency is always higher than any frequency that you can state. To put it another way, infinity is not a number at all; it is a concept which is outside of the class of real numbers.
-------------
LEGEND
A. FUNDAMENTAL B. 20 HARMONIC C. FUNDAMENTAL PWS 20 HARMONIC D. 3D HARMONIC E. FUNDAMENTAL PWS 20 AND 3D HARMONICS F. 4TH HARMONIC G. FUNDAMENTAL PW5 20. 31> AND 4TH HARMONICS H. 5TH HARMONIC J. FUNDAMENTAL PWS 2 D. 3 D. 4TH. AND 5TH HARMONICS K. 6TH HARMON IC L FUNDAMENTAL PWS 2 D. 3 D. 4TH. 5TH. AND 6TH HARMONICS M. 7TH HARMON IC N. FUNDAMENTAL PWS 2 D. 3 D. 4TH. 5TH. 6TH. AND 7TH HARMONICS
(A) Basic sine wave. (B) Sawtooth wave composed of sine waves.
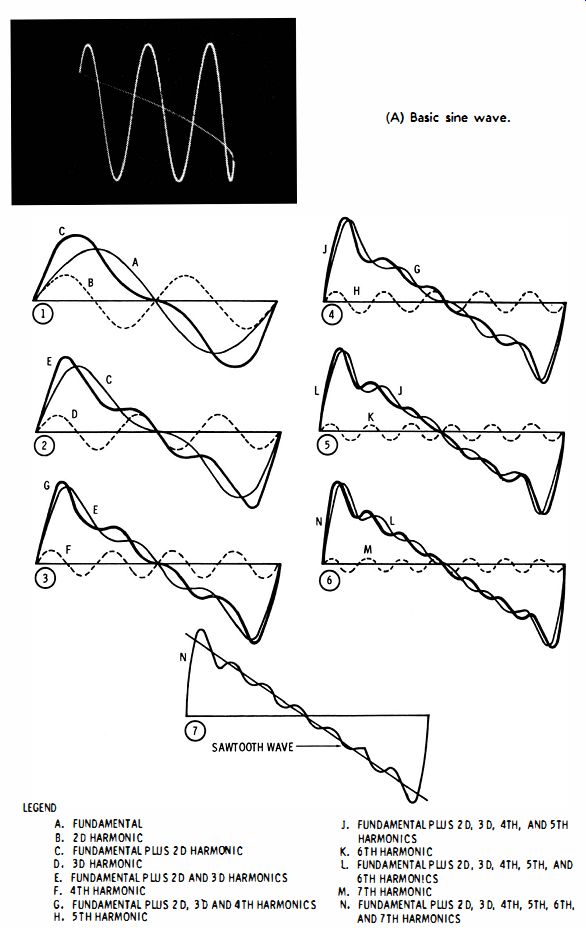
Fig. 2-8. Composition of a complex waveform.
---------------
Fig. 2-8 shows the synthetic approach to waveform description. In other words, any practical waveform can be considered to be composed of a series of sine waves having suitable voltages, frequencies, and phase relationships. As will be explained in the next few paragraphs, waveforms are not actually produced in this way; this is merely a mathematical device for studying the waveform. In many cases this is the most convenient way to study a particular waveform, but in other cases it is much easier to consider the waveform in other ways. Some examples follow.
WAVEFORMS CONTAINING STRAIGHT LINES
A sine wave contains no straight lines. Even the "straightest" portions of the sine wave in Fig. 2-SA are curves, although they are "slow" curves. On the other hand, a true sawtooth wave consists of a succession of straight lines with no curvature whatsoever. Accordingly, it might seem surprising that a true sawtooth wave with perfectly straight lines could be built up from the sine waves that have no straight lines at all! This is possible if the sawtooth wave is regarded as containing an infinite number of sine waves.
Otherwise stated, waveforms comprised of straight lines can be built up from sine waves only with the proviso that an infinite number of harmonics is present. How can this be possible in real circuits and real scopes which never have an infinite bandwidth? As a matter of fact, it is impossible. No practical device can generate or display a perfect complex waveform, although many devices can produce an approximation that for all practical purposes is as good as the ideal waveform. As a familiar example, consider the display of a sawtooth wave on the screen of a scope-you will often observe such waveforms which contain straight lines, in spite of the fact that the scope bandwidth has an upper limit of a megacycle or two. The scope does not build up the waveform from its harmonics; it merely reproduces a waveform which has been generated by some circuit. In turn, the generating circuit does not build up the sawtooth waveform from its harmonics; it simply charges a capacitor from a DC-voltage source or a constant-current source.
Natural Laws of Growth and Decay
Fig. 2-9 shows the response of simple differentiating and integrating circuits. When a square-wave voltage is applied, the circuit action is the same as if a battery were switched first in one polarity and then in the other polarity. It is clear that resistance limits the current flow into and out of a capacitor.
This current flow is exponential, because its rate of increase or decrease depends on the existing charge; that is, it depends on how nearly the capacitor voltage approaches the driving voltage. Exponential curves are natural laws of growth and decay.
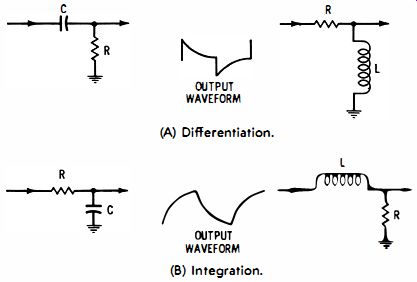
Fig. 2-9. Differentiating and integrating circuits. (A) Differentiation. (B)
Integration.
Another illustration of the exponential concept in this regard follows from the fact that the curved intervals in differentiated or integrated waveforms can be straightened by an opposite curvature. In other words, one type of nonlinearity can be cancelled by the opposite type of nonlinearity to obtain a straight-line trace. This method is utilized in vertical-deflection circuits of TV receivers--the curvature in a generated saw tooth wave is cancelled out by a following circuit which introduces an opposite curvature. Thus, a linear sawtooth wave is obtained. Again, these are direct circuit responses, having no reference to suppositions of harmonics.
PRINCIPLES OF WAVE ANALYSIS
When the treacheries of infinity are clearly recognized, the idea of a complex wave as a combination of a fundamental plus an infinite number of harmonics can be very useful--even indispensable on occasion. The reason is that some circuits see a complex wave as if it were built up in this way.
(A) A simple waveform-analyzer arrangement. (B) Square-wave pattern with third harmonic ripple.
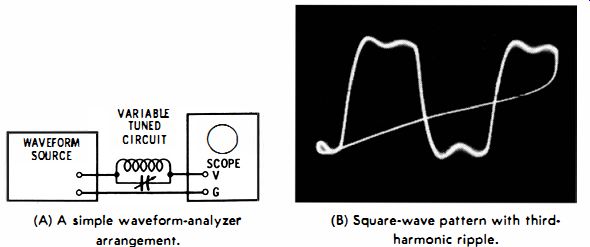
Fig. 2-10. Waveform analysis.
To quickly determine the harmonic frequencies in a complex waveform, the circuit current can be passed into a scope through a variable tuned circuit (Fig. 2-10A). As the LC circuit is tuned through a harmonic frequency, a sine-wave ripple appears in the scope pattern. This is a simple wave-analyzer arrangement.
RINGING OUT THE HARMONICS IN A WAVEFORM
Consider how a high-Q tuned circuit "rings out" the harmonics in a complex waveform. The excursions of the complex wave must necessarily sustain the ringing pattern to display a ripple in the reproduced waveform. Fig. 2-11 indicates how the ringing pattern is sustained when the high-Q circuit is tuned to the fundamental frequency of the waveform. When the square-wave voltage increases upward, the sine-wave voltage also increases upward, and vice versa.
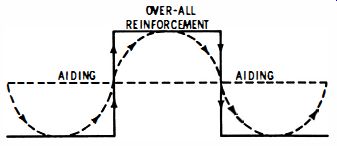
Fig. 2-11. A square wave sustains ringing at the fundamental frequency of
the square wave.
In a commercial spectrum analyzer the arrangement depicted in Fig. 2-10A is considerably elaborated. It is common to use superheterodyne circuitry with narrowband IF response. In some cases a quartz-crystal filter is used in the IF amplifier to obtain an extremely high Q. Thus, the effective resonant circuit is set to a constant frequency. The effect of tuning, obtained by means of a variable capacitor in Fig. 2-10A, is electronically controlled in a commercial spectrum analyzer. An FM oscillator (search frequency) is heterodyned with the waveform under analysis. As each harmonic frequency is swept through, an IF beat output occurs. This IF -beat interval is passed by the quartz-crystal filter and appears as a pulse on the screen of the spectrum analyzer.
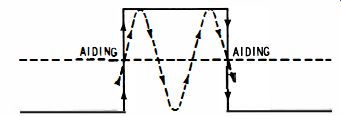
Fig. 2-12. A third-harmonic ringing oscillation is sustained in a tuned circuit
by a square wave.
Reinforcement of the Third Harmonic Fig. 2-11 shows how a ringing circuit reinforces the fundamental frequency of a square wave. As would be expected, the ringing circuit reinforces the third harmonic of the square wave (Fig. 2-12) . When the square-wave voltage increases upward, the sine-wave voltage also increases upward, and vice versa. You will find that the ripple amplitude decreases as the tuned circuit is resonated at higher frequencies. This results from the fact that the higher harmonics in a square wave have lesser amplitudes (Fig. 2-13) . The square wave contains odd harmonics only. Tests at higher ringing frequencies show less ringing voltage than should theoretically be present, and eventually the ringing becomes so low in amplitude that it is no longer visible. There are two chief causes for this :
1. The bandwidth of the scope may be too narrow to pass the higher ringing frequencies.
2. The applied square wave may not approximate a true square wave sufficiently.
The implications of these points will be considered next.
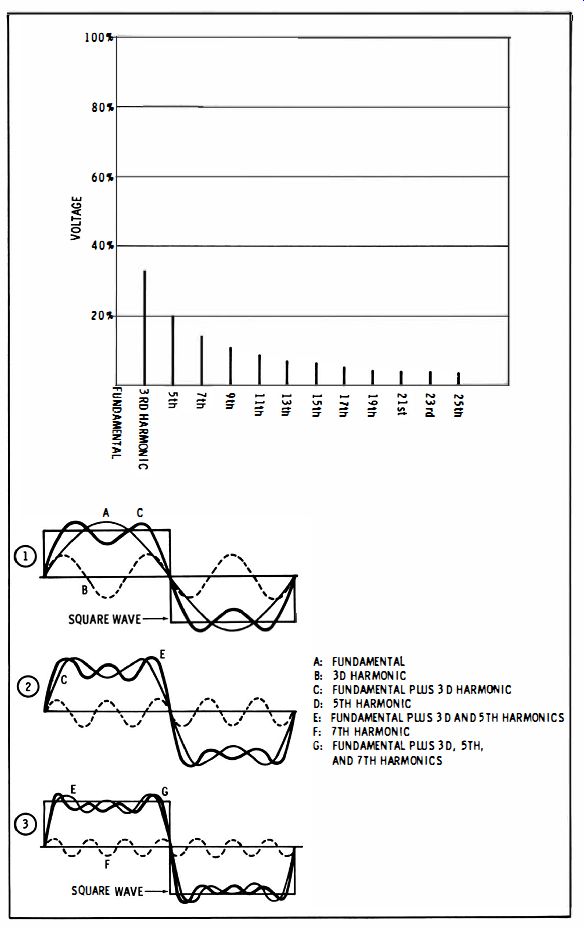
Fig. 2-13. Relative harmonic voltages in an ideal square wave.
A: FUNDAMENTAL B: 3D HARMONIC C: FUNDAMENTAL PWS 3 D HARMONIC D: 5TH HARMONIC E: FUNDAMENTAL PWS 3 D AND 5TH HARMONICS F: 7TH HARMONIC G: FUNDAMENTAL PWS 3 D. 5TH. AND 7TH HARMONICS
WHAT IS RISE TIME?
In theory, a perfect square wave is built up from an infinite number of harmonics. But in practice, actual square waves have a more or less limited number of detectable harmonics.
This limitation results from the finite bandwidth of square wave generator circuits. Obviously, if a perfect square wave could be generated, the associated circuitry would require an infinite bandwidth. This is not possible. Because an infinite number of harmonics cannot be generated, practical square waves do not change from positive to negative, and vice versa, in zero time. Furthermore, the perfectly square corners predicted by theory cannot be realized in practice. Observe in Fig. 2-13 that the leading edge of a synthesized square wave becomes steeper as the number of harmonics is increased but no finite number of harmonics will suffice to get a perpendicular leading edge. Again, in Fig. 2-13 observe that the corner of a synthesized square wave is always rounded as defined by the rounding of the highest harmonic. No finite number of harmonics will suffice to get a completely square corner.
Thus, actual square waves have a finite rise time, as depicted in Fig. 2-14. This is the time required for the voltage to rise from 10% to 90% of its total excursion. Rise time can be easily measured with a good scope having calibrated sweeps. For example, the sweep speed indicated in Fig. 2-14 is 0.5 microsecond per major division on the screen, and the rise time is 0.05 microsecond. The reason for defining rise time between the 10% and 90% points is to eliminate cornering from the rise-time measurement.
It is a basic precept that an instrument used as an indicator must have better characteristics than the unit under test. For example, if a scope is used to check the rise time of a square-wave generator output, the scope must have a faster rise time than the generator. Otherwise, the displayed rise time is that of the scope, not of the generator.
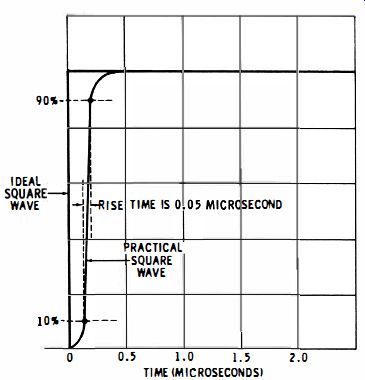
Fig. 2-14. Rise time.
RISE TIME VERSUS FREQUENCY RESPONSE
As a rough rule of thumb, note that the rise time of a scope amplifier is equal to 1/3 the period at the high-frequency cutoff point. In other words, a scope might have a pass band which cuts off at 4 mhz. The cutoff point is said to occur at the point where response is 3 db down (about 30% down) . Thus, if the response of a scope is 3 db down at 4 mhz, the period is 0.25 microsecond at the cutoff point, since the period is the reciprocal of frequency:
T = 1/f.
Hence, in this example, the scope's rise time will be approximately 1/3 of 0.25 microsecond, or about 0.08 microsecond.