AMAZON multi-meters discounts AMAZON oscilloscope discounts
You will encounter numerous types of waveforms in electronic circuits. Three basic types are the complex waveform, frequency-response curve, and cyclogram (Fig. 5-1) . The complex waveform is usually displayed on a linear time base (sawtooth deflection); the frequency-response curve is usually displayed on 60-cycle sine-wave deflection; the cyclogram is displayed as the resultant of two different signal voltages, each deflected with respect to the other. Sawtooth deflection is most commonly used to display complex waveforms, because it displays the waveform voltage as a linear function of time. This is the meaning of the term linear time base.
A frequency-response curve displays output voltage versus frequency; that is, the horizontal deflection is proportional to frequency. Note carefully that horizontal deflection is not proportional to time in this type of display. The fact that 60-cycle sinewave deflection is commonly used is incidental to the frequency display; economic considerations in the design of FM generators dictate the use of power-frequency deviation of the output frequency. When the scope horizontal deflection is at the same 60-cycle sine-wave rate, deflection is proportional to frequency deviation.
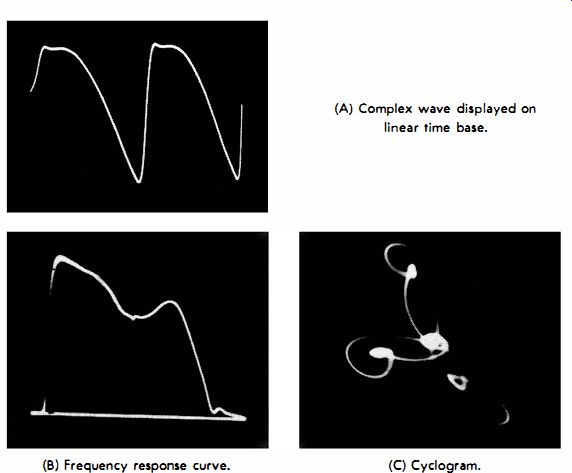
Fig. 5-1 . Basic types of waveform display. (A) Complex wave displayed on linear
time base. (B) Frequency response curve. (C) Cyclogram.
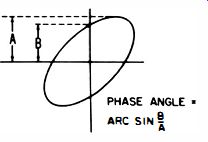
Fig. 5-2. Determination of power from a cyclogram.
A cyclogram contains the information of two waveforms; one waveform voltage is applied to the vertical input terminals, and the other to the horizontal input terminals of the scope. Thus, horizontal deflection is proportional to signal voltage-not to time or frequency. Most cyclograms are displayed from waveforms having the same repetition rate; thus, the current waveform in a circuit might be displayed against the voltage waveform. In this case a particular type of cyclogram results which is sometimes called a power pattern (Fig. 5-2) . The pattern shows the phase relation between current and voltage from which the power factor (cos 8) can be read.
ASPECT OF A WAVEFORM
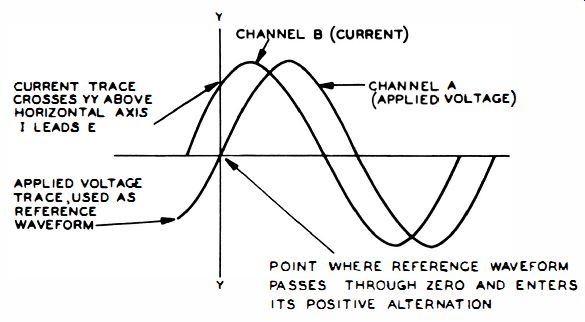
Fig. 5-3. Representation of phase difference displayed on line, sweep by means
of an electronic switch. POINT WHE REREFERENCE WAVEFORM PASSES THROUGH ZERO
AND ENTERS ITS POSITIVE ALTERNATION
A waveform displayed on a linear time base might appear right side up, or upside down. The aspect merely depends on the number of stages in the vertical amplifier of the scope each stage inverts the waveform. Most scopes produce an up ward deflection for a positive-going input voltage, although this is not true of all scopes. A linear time base always displays a pattern with time increasing toward the right. Hence, if current and voltage are displayed with an electronic switch, you can observe whether the current leads or lags the voltage (Fig. 5-3). It makes no difference whether the current and voltage waveforms are displayed right side up or upside down as long as both are displayed in the same aspect.
As the name indicates, an electronic switch is a vacuum-tube device which operates automatically. It rapidly samples the two source voltages back-and-forth, with the result that an ordinary scope becomes effectively a dual-trace scope. An electronic switch usually operates at a considerably higher frequency than the sawtooth oscillator in the scope, and the switch need not be synchronized with the sawtooth oscillator. In case the switch should be synchronized with the sawtooth oscillator, the two traces appear broken up into dots in accordance with the sampling rate. When the switch is unsynchronized however, the dots appear at arbitrary points along the pattern on successive sweeps, with the result that the display blends into an apparently continuous pattern.
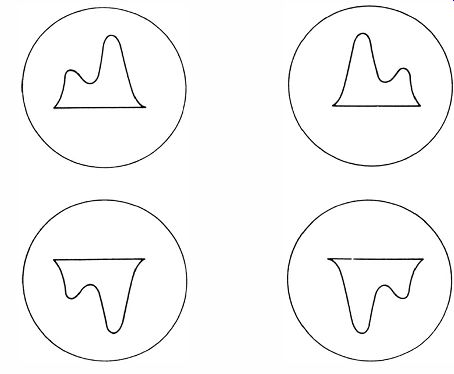
Fig. 5-4. Frequency response curve shown in four different aspects.
Aspects of Frequency-Response Curves
Frequency-response curves may be displayed either right side up or upside down and either left to right or right to left.
Whether a response curve is inverted with reference to a published waveform depends not only on the number of stages in the scope vertical amplifier, but also on the polarity of the detector output. The detector might be a video detector in a TV receiver, or it might be a semiconductor diode in a demodulator probe. Whether a response curve is displayed with frequency increasing from left to right or right to left depends on the number of stages in the horizontal amplifier (Fig. 5-4) . Most scopes provide a beam deflection from left to right when a positive-going voltage is applied, but a few recently manufactured scopes are designed in such a manner that the beam deflects from right to left when a positive-going voltage is applied to the horizontal input terminal.
A few scopes provide a vertical polarity-reversing switch.
In such scopes, you can turn the pattern upside down when desired by merely throwing the reversing switch. Most scopes have no control of vertical aspect, however. A few sweep generators provide a control to reverse the pattern from right to left, but most generators do not. Inasmuch as these features are usually absent, you must become familiar with the various aspects of frequency-response curves so that you can analyze the patterns regardless of aspect.
Distinction Between Lissajous Figures and Cyclograms
The basic distinction between a Lissajous figure and a cyclogram is that the former is produced by sine waves, while the latter is produced by complex waves. While this waveform classification is useful, there is actually no clear-cut dividing line between the two types of waveforms. This fact is evident from the photo shown in Fig. 5-5A; although the pattern has the essential characteristics of a Lissajous figure, it is a cyclogram in the strict sense. The input sine waves to the scope are not pure in this example, with the result that the pattern is a distorted Lissajous figure. A sine wave that is not ideal is a complex wave; hence, the photo in Fig. 5-5A actually falls in the class of cyclograms.
It should be noted that no sine waveform displayed on a scope screen is ideal, and that if sufficiently sensitive tests were made, a sine wave which appears to be perfect would be found to have at least a small trace of distortion. No audio oscillator supplies a 100% perfect waveform, regardless of its quality. Likewise, there is no such thing as a completely distortionless audio amplifier. In practice, however, if a waveform appears to be perfect, you can proceed with analysis on the assumption that no distortion is present, and your conclusions will be valid within the limitations of the particular test procedure. This is merely another way of saying that although nothing is perfect in actual practice, analytical methods must be based on various ideal assumptions.
Cyclogram Aspects
Whether a cyclogram appears right side up or upside down and whether it is displayed left to right or right to left depends on the number of stages in the scope vertical amplifier and the number of stages in the horizontal amplifier. Cyclograms, such as Lissajous figures used to determine frequency ratios (Fig. 5-5B) , display various aspects, depending on the phase relation of the two input voltages. In any case the information concerning frequency ratios is the same.
When Lissajous figures are displayed, the two frequency sources are seldom synchronized. In general, one source is being calibrated against another. No generator has absolute frequency stability, with the result that each of the input frequencies tends to drift more or less. This causes a moving aspect in the pattern as the two sources pull apart and come together alternately in phase. In Fig. 5-5B, the effect of this movement is seen in the four different patterns. In case the sources are synchronized, the pattern is stationary on the screen, and its aspect depends only on the fixed phase difference between the two sources.
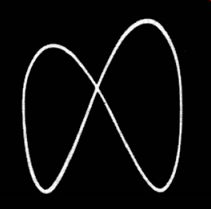
Fig. 5-5A. Photograph of typical scope trace of Lissajous figure.
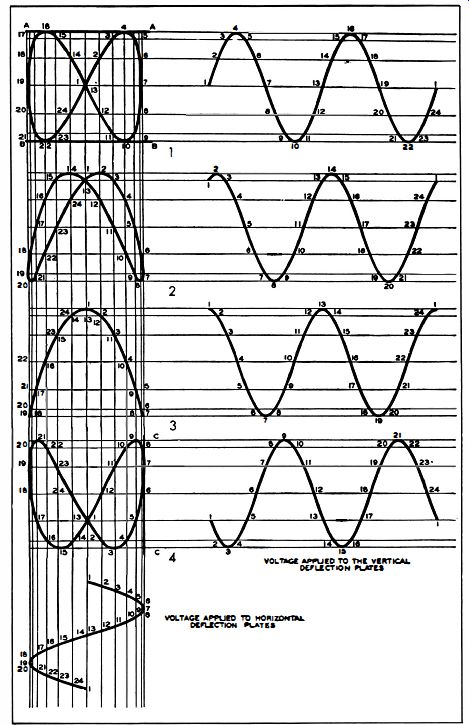
Fig. 5-5B. Development of Lissajous figures for various phase differences.
The aspect of the pattern indicates this phase angle. Thus, the Lissajous figure serves not only to measure the ratio of two frequencies, but also to measure the phase difference between them. The information concerning phase given in the Fig. 5-5B patterns is an extension of the single-frequency method shown in Fig. 5-2. For example, the initial phase difference in (1) of Fig. 5-5B is 00, while the initial phase difference in (3) is 90 deg. You will generally employ Lissajous pat-terns to measure frequency ratios, although it is apparent that phase differences can also be measured when the sources are synchronized, as when displaying voltage versus current from the same circuit.
MEANING OF POWER FACTOR
Recall that when reactance is present in a circuit, the current is out of phase with the voltage. Then there are three power values present. One is the apparent power, or volt-amperes it is given by the product of the rms voltage times the rms current. This is the largest of the three power values. Another is the real power, which does useful work-it is given by the product of the apparent power times the power factor. The power factor, cos {}, is equal to the resistance divided by the impedance. The third power value is the reactive power, which does no useful work; reactive power merely surges back and forth in the circuit and does not appear as load power. Reactive power is given by the product of the apparent power times sin {}-the value of sin {} is equal to the reactance divided by the impedance.
Note that the three power values combine in a right triangle, just as the three types of ohms (resistance, reactance, and impedance) combine in a right triangle. To clarify the meaning of the various types of power, it is helpful to consider three extreme examples. First, consider an amplifier which delivers power to a 600-ohm resistor-all of the output energy from the amplifier does work in heating the resistor. Next suppose you disconnect the resistor from the amplifier and replace it with a capacitor which has a reactance of 600 ohms at the operating frequency. Now, all of the energy merely surges in and out of the capacitor and does no work. Finally, if you connect a resistor and capacitor in series so that they present an impedance of 600 ohms to the amplifier output, the current flow through the resistor does work, but the current flow through the capacitor does no work.
Waveform of Amplifier With Impedance Load
When an amplifier drives an output transformer, the load is theoretically a pure resistance. However, in practice the trans-former primary usually presents inductance as well as resistance to the amplifier output terminals. In turn, the plate current of the output tube lags the plate voltage, and there is reactive power as well as real power present in the output circuit.
The load line is not straight but follows an elliptical path of operation on the family of tube plate characteristics.
The waveform of such a load impedance can easily be analyzed with a scope. A small resistor is connected in series with the primary of the output transformer. The voltage drop across this resistor is proportional to the output current flow. Connect the vertical input leads of the scope across the resistor, and connect the horizontal input leads of the scope across the primary of the output transformer. When the amplifier under test is driven by an audio oscillator, either a diagonal line or an ellipse will be displayed on the scope screen. If a line is observed, the output transformer and speaker present a purely resistive load; if an ellipse is displayed, the load is an impedance consisting of both resistance and reactance.
The proportions of the ellipse give the power factor, which is equal to the ratio of resistance to impedance. A change in operating frequency results in a change of power factor. Hence, the frequency at which the power factor is measured should be specified. This simple test makes it possible to compare the quality of one transformer-speaker system against another.
The most desirable system is one which gives the highest power factor over the widest frequency range. When the power factor is high, the output efficiency is also high. Moreover, less distortion can be expected when the power factor is high, because the path of operation does not dip down so far into the nonlinear region of the plate characteristics.
It is evident that a Lissajous figure which represents an impedance waveform is developed from synchronized sources; the current in the circuit is always in synchronism with the voltage, although there may be a phase difference between current and voltage. If the current waveform is different from the voltage waveform, as will be the case when the tube is operated over a nonlinear region of its plate resistance, the ellipse will be distorted accordingly. Nevertheless, the harmonics are synchronized with the fundamental, and the pattern is stationary on the screen.
MIXED WAVEFORMS
Many of the waveforms which are analyzed in the course of electronic circuit testing are of the mixed variety. For example, if hum voltage is present in a video signal, the pattern is a mixed waveform. Complex waveforms are not mixed waveforms, although they contain harmonics. The difference between a mixed waveform and a complex wave can be stated as a difference between inexact frequency relations and exact frequency relations. Consider, for example, a square wave which contains a fundamental, third harmonic, fifth harmonic, and so on. The square wave is a complex waveform because the frequency relations between the fundamental and its harmonics are absolutely exact. In other words, the third harmonic is exactly 3 times the fundamental frequency, and never 3.0001 or 2.9999.
On the other hand, a video signal is a mixed waveform; its components are complex waveforms. Recall that horizontal sync pulses have a repetition rate of 15,750 cycles per second and vertical-sync pulses have a repetition rate of 60 cycles per second. These are nominal repetition rates, which are held to close tolerances. Nevertheless, the horizontal pulse timing can vary slightly in one direction, while the vertical pulse timing may vary slightly in the other direction. Clearly, the horizontal-sync pulses do not have a true harmonic relation to the vertical sync pulses. Hence, the sync-pulse train is a mixed waveform.
The question may be asked why the relative timing of the horizontal- and vertical-sync pulses is not absolutely precise.
The answer is that the two types of pulses are developed by separate counter (trigger) circuits. There is always more or less jitter in a counter chain, even though it might be held to a very small amount. The result of residual jitter is that the horizontal-sync pulses cannot be an absolutely exact harmonic of the vertical-sync pulses. Fig. 5-6 illustrates a comparatively bad case of the "jitters." You will often see these extreme examples when adjusting the counter circuits in a pattern generator with the aid of a scope. When objectionable jitter is observed, a control is usually incorrectly set near the end of its lock-in range. If this is not the cause, there is a defect in the counter circuitry.
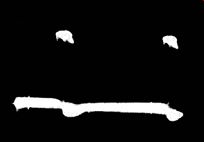
Fig. 5-6. Jitter in a 15,750· hz signal.
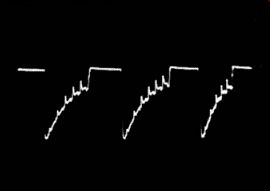
Fig. 5-7. Typical counter circuit waveform.
Counter-Circuit Waveforms
Counter circuits are used in a wide variety of modern electronic equipment, such as pattern generators, color-bar generators, and synchronizing circuits in oscilloscopes. Sophisticated equipment, such as radar systems and electronic computers, make extensive use of counter circuits. Frequency standards employed in commercial transmitting and laboratory research installations contain chains of multivibrators which are locked in synchronism by counter action.
A typical counter-circuit waveform is shown in Fig. 5-7.
This, of course, is a mixed waveform. The pattern represents the outputs from two or more locked oscillators, each of which triggers the next. Each individual oscillator generates a complex waveform.
The chief item of interest in such mixed waveforms is the number of triggers that appear in the lower-frequency interval of the wave. This characteristic indicates whether the counting action is correct. In a counter chain in which you are counting down from say, 31,500 cycles to 60 cycles, the final output waveform represents the outputs from several locked oscillators, each of which is triggered by the preceding oscillator in the chain. If any one of the oscillators is counting in correctly, the evidence is seen in the corresponding waveform.
In case of doubt, refer to the instrument instruction book in most cases the manufacturer illustrates the correct counter waveforms for the particular instrument.
When a circuit counts incorrectly, the troubleshooter must determine where the defect is located in the counter chain.
The waveforms are observed step-by-step through the system and the counter action is evaluated, as previously described.
When you replace tubes in a simple device such as a color-bar generator, tube tolerances will often throw the counter action into an incorrect mode of operation. The output pattern appears scrambled. When this happens, refer to the instruction book for the instrument; it will specify successive test points for checking the counter waveforms. The maintenance control in each stage is then adjusted to obtain the specified counter waveform. This can be a baffling procedure if a scope is not employed; if you have a chain of six counters in a color-bar generator and do not make progressive scope tests, you can waste a vast amount of time in aimless control adjustment it is not apparent from the output pattern whether one or more stages is counting incorrectly, nor does the output pattern indicate which stage or stages may be at fault.
Mixed Waveforms in Color-TV Circuits
Another important example of a mixed waveform is the color video signal (Fig. 5-8) . Here, a 3.579545-mc sine wave is switched into the black-and-white video signal at suitable intervals. The color burst appears on the back porch of the horizontal sync pulse, and the burst phase is not controlled with respect to the repetition rate of the sync tip; hence, the burst appears blurry if the scope is synchronized with respect to the sync tip. However, if you utilize the subcarrier-oscillator output for external synchronization of the scope, the burst phase then appears fixed on the screen-the burst can be expanded as desired, and a sine-wave pattern is displayed.
An expanded burst can be displayed either with a sweep magnifier or a triggered-sweep function in a scope. A sweep magnifier is somewhat limited in the amount of expansion which it provides (5 times is typical) , but it is easier to use.
The waveform is first displayed on the screen in the conventional manner, and the magnifier is then switched on. The magnifier-positioning control is then adjusted to bring the desired interval of the expanded waveform to the center of the screen.
Adjustment of triggered-sweep controls is somewhat more complicated. Trigger amplitude, slope, and stability must be suitably adjusted. However, the deflection rate can then be set to any desired value, and a very large expansion obtained.
Fig. 5-8. TV sign.1 with color burst.
When triggered sweep is used, flexibility is provided by a sweep-delay control; horizontal deflection can be started at any chosen time after the trigger pulse arrives. This gives a positioning action which is similar to the magnifier-positioning function noted previously. Sweep delay is applicable only to repetitive waveforms.
NON RECURRENT TRANSIENT WAVEFORMS
There is a special case of both mixed and complex waveforms called non-recurrent transients. This type of waveform is exemplified by the starting surge to a power supply in a TV receiver. When the receiver is turned on, there is a sudden in rush of current after which the current rapidly settles down to its steady state. This surge waveform does not recur, of course, until the switch is turned off and then on again. Non-recurrent transients cannot be displayed satisfactorily on ordinary scopes unless triggered sweep is provided. An additional facility is also required for completely satisfactory display.
When a waveform is not repetitive, but is a non-recurrent transient, a delay line is utilized in the vertical amplifier. This delay is comparatively short, and its purpose is to provide time for the sweep to get started before the transient signal arrives at the cathode-ray tube. If a delay line is not used, part or all of the leading edge in the pattern will be lost. Since the delay line must operate at the full bandwidth of the vertical amplifier without introducing frequency distortion or phase shift, requirements are stringent and much technical ingenuity has been directed to the development of high-performance delay lines.
FREQUENCY INDICATION
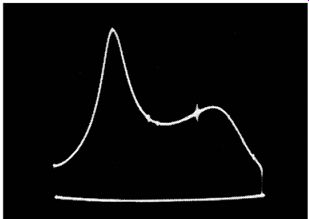
Fig. 5-9. Photograph of marked frequency-response curve.
Note the frequency marker on the response curve illustrated in Fig. 5-9. This is a mixed waveform-the output from a marker generator is mixed with the output from an FM generator to produce the complete waveform. Here, the mixture provides the unique function of measuring frequency along the horizontal excursion of the waveform.
By suitable observation of the marker interval it can readily be seen that the marked curve is a mixed waveform. If you reduce the sweep width to a low value and readjust the center frequency of the sweep generator to keep the marker in the center of the screen, you can expand the marker horizontally as much as desired. Then, if you advance the vertical gain control of the scope, the amplitude of the marker is increased.
Now, the details of the marking waveform become clearly apparent. You will see that the marker does not stand still, but instead writhes in its position on the curve. This is a consequence of mixing the outputs from two separate generators to produce the marker pattern. Inasmuch as the marker does not have an absolutely fixed relation to the sweep signal, the pattern is a mixed waveform.
ASPECT CONTROL
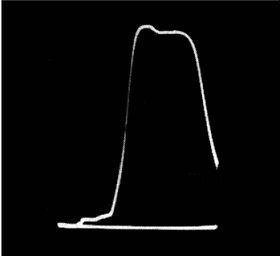
Fig. 5-10. Response curve not centered.
Some aspects of a waveform are under the control of the operator, while others are not. Thus, if a sweep-frequency waveform is not centered on the base line (Fig. 5-10), the center-frequency control of the FM generator can be adjusted as required. Compare this waveform with the response curve illustrated in Fig. 5-9; in the latter display both sides of the response curve are clipped (the waveform is centered on the base line) . If the sweep-width control of the FM generator has been advanced to maximum, then the aspect of the waveform is not under the control of the operator. However, this should not be assumed to imply that the off-screen portions of the response curve in Fig. 5-9 cannot e made visible; all that is required is to turn the center-frequency control sufficiently in the appropriate direction. Thus, if the curve in Fig. 5-10 is moved sufficiently far to the left, the off-screen portion on the right will become visible. It is often impossible to display an RF response curve completely, because the bandwidth is comparatively great and the deviation of conventional FM generators is somewhat limited. However, a few generators are designed to sweep all the low VHF channels simultaneously, or all the high VHF channels simultaneously. This type of generator is utilized in checking TV distribution amplifiers and wide-band boosters.
Another aspect of waveform display which often confuses the beginner is shown in Fig. 5-11. Here, the left portion of the pattern is cramped. This compression does not indicate a fault in the circuit under test; instead, it stems from a defect in the scope. It is an example of nonlinear horizontal deflection otherwise stated, the progression of the trace from left to right is not uniform in time; the beam moves more slowly at the left end than at the right.
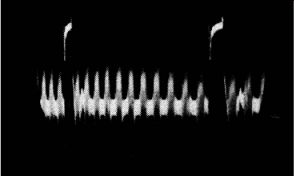
Fig. 5-11. Waveform compressed at left side.
Scanning nonlinearity can result from low supply voltage or a component defect in the sawtooth-oscillator circuit. Sometimes merely replacing a tube will clear up the distortion. If the sawtooth oscillator is functioning properly (this can be checked with another scope), the source of nonlinear scanning will be found in the horizontal amplifier. Low supply voltages and leaky coupling capacitors are common causes of this symptom.
When the supply voltage is low, the amplifier tubes tend to saturate on the peak of drive, and the bias may also shift to an unfavorable operating point. A leaky coupling capacitor permits positive voltage to bleed into the control-grid circuit, thus upsetting the normal grid-cathode bias.
It must not be supposed that nonlinear deflection always appears as shown in Fig. 5-11. In some scopes, depending on the nature of the defect, the pattern can appear compressed at the right. When push-pull amplifiers in a horizontal amplifier are incorrectly biased, the pattern can appear compressed in the center region. This latter type of distortion is often called cross over distortion. In another type of aspect distortion, the center portion of the pattern is displayed normally, but the waveform is cramped at both ends. This symptom results from low supply voltage to a push-pull amplifier, while the operating points of the tubes remain correct.
ONE SCOPE CHECKS ANOTHER
Beginners are frequently baffled when a scope develops defects; however, it is often easy to run down the trouble in a defective scope by testing it with another scope. Simply trace the waveforms through the areas which fall under suspicion.
Thus, if the symptom happens to be deflection nonlinearity, trace the sawtooth wave from its origin in the sawtooth-oscillator section through the amplifier stages to the deflection plates of the cathode-ray tube. Suppose that the sawtooth exhibits nonlinearity at the output of the sawtooth oscillator-the trouble will be found in this section. A capacitor might be leaky, a resistor may have changed in value, or a capacitor may have lost a substantial amount of its capacitance--sometimes a capacitor will open completely.
If you find that the sawtooth-oscillator output is linear, the trouble will be found in one of the subsequent amplifier stages.
When you come to the stage which first exhibits nonlinearity, check out the components in that stage. Capacitors can be tested on a capacitor checker or by substitution; bias and supply voltages can be measured with a voltmeter; resistors can be checked with an ohmmeter. In any case, remember that tubes are the most likely cause of faulty operation. From a statistical standpoint, capacitors are the next most likely culprits, followed by resistors.
When distortion is present in the vertical amplifier of a scope, you can localize the defect in the same manner by signal tracing with another scope. Apply any convenient AC signal to the vertical input terminals. Then follow the waveform from the vertical input terminals stage by stage to the deflection plates of the CRT. When you come to the first display of distortion in the waveform, the trouble will be found in that stage. Note that you can compare the waveform amplitudes at the input and output of a stage to measure the stage gain. In this manner, a low-gain symptom can also be localized.
MODULATION CYCLOGRAM ASPECTS
Another type of waveform is obtained when a modulated waveform is applied to the vertical input terminals of a scope, and the modulating waveform is applied to the horizontal input terminals. This is called a trapezoidal display (Fig. 5-12). The photo shows the modulated waveform as it appears on conventional sawtooth sweep. When it is converted to a trapezoidal pattern, it becomes easy to read the modulation percentage.
The formula for percentage modulation is :
where,
% Mod
= E"ul X - EIIlI" X 100 EIIlRx + ElIlill
E-max is the total vertical deflection at the large end of the pattern,
E-min is the total vertical deflection at the small end of the pattern.
100% modulation occurs when the trapezoid comes to a point.
If the pattern "tails off" into a horizontal line, overmodulation is present. Overmodulation is undesirable, because tone distortion occurs and sideband "splatter" is generated. These cause interference on other channels. Trapezoidal patterns also show whether modulation is symmetrical-thus the example of 50% modulation in Fig. 5-12 depicts unsymmetrical modulation, while the example of 90% modulation is symmetrical. Unsymmetrical modulation results from incorrect adjustments in the modulating circuitry of the transmitter.
When making a trapezoid read-out, the audio channel must be energized from a steady source, such as an audio oscillator.
The instrument need not have good waveform, since this does not affect the shape of the trapezoidal pattern. It is only necessary that the percentage modulation be maintained constant while the readout is made. Most scopes have vertical amplifiers with limited bandwidth, and the modulated ,RF signal must be coupled directly to the vertical deflection plates in the cathode ray tube. Details of such procedures are explained in specialized texts such as 101 ways to Use Your Ham Test Equipment.
The audio input to the scope horizontal amplifier must have the same phase as the envelope of the modulated-RF signal, or the trapezoidal patterns will overlap on trace and retrace, giving a confused double-image presentation. It is easy to phase the modulated-RF signal satisfactorily if a small loop is used to pick up the RF energy from the final tank in the transmitter.
(A) Modulated signal displayed with linear sweep. 0% modulation. 50% modulation. (B) Trapezoidal patterns for various modulation percentages.
By turning the loop and varying its distance from the tank coil, you can select a signal input of both correct phase and amplitude.
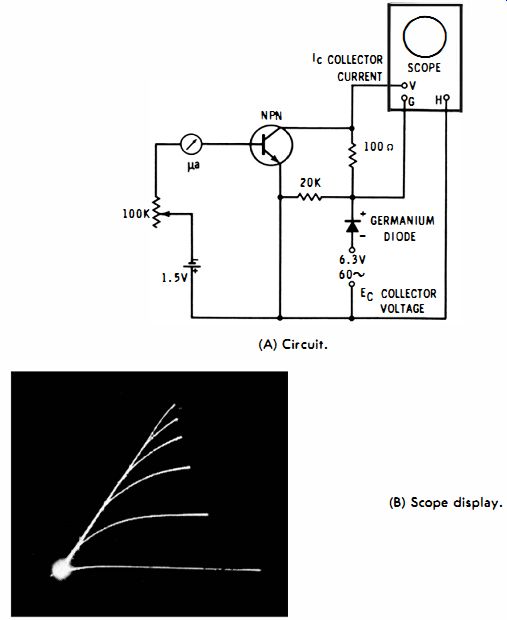
Fig. 5-13. Display of transistor characteristics. (A) Circuit. (B) Scope display.
TRANSISTOR CHARACTERISTICS
Still another type of pattern is obtained as shown in Fig. 5-13 in which a scope is used to display transistor characteristics.
Collector voltage is displayed along the horizontal axis, while collector current is displayed along the vertical axis. Base current is the running parameter. With the arrangement shown in Fig. 5-13A only one characteristic is displayed at a time. The base current must be changed to display the succeeding curve.
The photo is a multiple exposure.
You can display the entire family of collector characteristics by driving the base of the transistor from a staircase generator.
The "steps" of the generator output need not be synchronized with the rectifier output in the collector circuit. It is essential to use a DC scope in this application, because the origin will shift otherwise, offering a confusing pattern. The display in Fig. 5-13B shows the saturation region of the transistor, because the applied collector voltage is comparatively low. If more voltage is used, the curves are extended accordingly.
Note that the 20K resistor in Fig. 5-13A is employed to stabilize the output from the germanium-diode rectifier, so that the origin is sharply defined.
In tests of this type it is advantageous to utilize a scope which has differential input. Differential input balances out common-mode hum which is sometimes a problem because of circulating ground currents in the test setup. Circulating ground currents stem from capacitive coupling between primary and secondary windings of the power transformers in the scope and the 6.3-volt supply to the collector circuit. However, if the power transformers contain electrostatic shields, a single ended scope can be used without encountering difficulty from circulating ground currents.
TUBE CHARACTERISTICS
Vacuum-tube characteristics are displayed in the same general manner as transistor characteristics. Thus, the plate family is developed as a pattern on the scope screen. A staircase generator permits the grid voltage to be varied as the running parameter in any chosen number of steps. The staircase drive voltage should be limited to negative values to avoid possible damage to the tube under test due to grid-current flow. However, this does not mean that tube characteristics cannot be checked for positive grid voltages. If the grid drive signal is a narrow pulse, the grid dissipation can be reduced below the rated limit. Since a scope shows current and voltage values as readily for a narrow pulse as for a step voltage, you can check out a tube completely.
Sophisticated scopes are designed to accommodate plug-in vertical and horizontal units for displaying the plate family of a vacuum tube, the collector family of a transistor, and characteristics of various semiconductor diodes, including tunnel and zener diodes. The test units can be adjusted for any desired voltage and current ranges, so that the device under test is not operated out of limits. Other plug-in units provide display of transistor switching characteristics, so that their suitability may be determined for application in high-speed computers.
A scope used to display the switching characteristics of a tunnel diode must have a large bandwidth-up to 1000 mhz. An oscilloscope with 1,000-mc bandwidth does not use conventional vertical amplifier circuitry. Instead, it uses a sampling function, which is analogous to heterodyne action. To put it another way, the input waveform is converted by sampling action to a similar waveform with a much lower repetition rate. Note that a sampling-type oscilloscope can be used to display recurrent waveforms only. Nonrepetitive transients cannot be displayed.
HUM IN WAVEFORMS
The presence of hum voltage in a waveform changes its appearance in certain characteristic ways. Fig. 5-14 illustrates how 60-cycle hum voltage thickens a trace when the repetition rate of the waveform is much higher than 60 cycles. The hum voltage beats with the waveform, but the beat rate is so fast that it exceeds the persistence of vision; hence, the waveform displays no movement; it simply appears blurred. On the other hand, when the repetition rate of a waveform is near the 60 cycle hum frequency, the beating becomes evident-the waveform writhes about its average position.
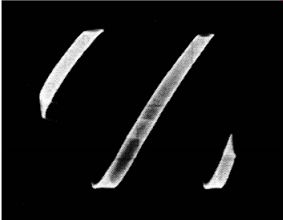
Fig. 5-14. Sawtooth pattern with 60-cycle hum.
If the waveform under observation has a 60-cycle repetition rate, the pattern is stationary; however, the 60-cycle hum changes the shape of the waveform. It is for this reason that a 50-cycle or 70-cycle square-wave test is better than a 60-cycle square-wave test-if hum voltage is present, the reproduced square wave will writhe. Thus, the operator does not run the risk of confusing hum voltage with amplitude distortion. The same observation applies at integral multiples of 60 cycles; it is better to make a square-wave test at 130 cycles, for example, than at 120 cycles.
In some cases, hum voltage can affect the triggering level of the sawtooth oscillator in the scope, as illustrated in Fig. 5-15.
In this case, the end of the pattern appears as if it were a section of a tube. Careful adjustment of the sync-amplitude control will usually square up the end of the pattern. This effect is similar to the appearance of a TV image when the vertical output tube is energized by 60-cycle hum voltage-the picture appears to be rolled up on a tube.
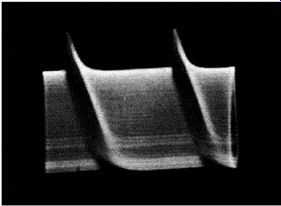
Fig. 5-15. Scope pattern showing effect of hum on triggering level.
Hum in Scope Circuitry
In the foregoing situations the hum source is in the circuit under test or in the test setup--not in the scope itself. It is possible for defective tubes or filter capacitors in the scope to produce hum interference or distortion in the display. The nature of the symptom depends on the type of defect which has occurred; for example, heater-cathode leakage in the cathode follower input stage of a vertical amplifier produces a 60-cycle sine-wave pattern on the scope screen which is unaffected by short-circuiting the vertical-input terminals. On the other hand, heater-cathode leakage in a well balanced push-pull stage produces little or no deflection; nevertheless, since the cathode grid bias is varying at a 60-cycle rate, the dynamic range of the stage is reduced, and you will be unable to obtain full-screen deflection without clipping of the displayed waveform.
When heater-cathode leakage is present in a sawtooth-oscillator tube, it becomes difficult to lock low-frequency waveforms, because the oscillator is self-locked on the power frequency. At higher frequencies, waveforms can be synchronized, but the pattern oscillates horizontally at a 60-cycle rate. If heater-cathode leakage occurs in a sync-amplifier tube, the locking symptoms are much the same as noted for the sawtooth-oscillator tube. However, you can distinguish between the two conditions, because the hum symptom disappears when the sync-amplitude control is turned down if the trouble stems from the sync-amplifier tube.
In case the high-voltage filter capacitor becomes open or loses a substantial proportion of its capacitance, intensity modulation of the trace appears. At low levels the trace is broken up into successive bright and dim intervals at a 60-cycle rate.
At higher intensity levels the bright intervals become defocused and mushroom. Defective filter capacitors in the low-voltage power supply produce a variety of pattern distortions which depend on the circuitry of the particular scope-the various decoupling circuits have different time-constants, so that the supply voltages of some stages and sections are better filtered than others.
Beginners should not be misled by the appearance of hum when the scope is operated with its case removed; the case usually serves an important shielding function and prevents stray external fields from entering the scope high-impedance circuitry. Another word of caution-because of the heavy filtering required in the 60-cycle high-voltage power supply, there is a possibility of fatal shock. Hence, never operate a scope with its case removed unless it becomes necessary to troubleshoot the circuitry. Never touch the circuitry until after the high-voltage filter capacitors have been completely discharged.
The high-voltage circuitry in a scope is tricky, because a negative high-voltage supply is almost always employed. This means that the heater, cathode, and control grid of the cathode ray tube are at high potential. Beginners tend to assume that the heater and cathode circuitry can be worked "hot" as in a television receiver, not realizing that the circuit configuration is different in a scope. Remember that the grim reaper makes no allowance for ignorance.
Pictures in Video Waveforms
Still another waveform aspect resulting from 50-cycle hum voltage is the appearance of picture information in a video waveform (Fig. 5-16) . This can result when hum voltage becomes mixed with the video signal either in the circuit under test or in the vertical amplifier of the scope itself. It is the result of the vertical deflection of the normal pattern by the hum voltage.
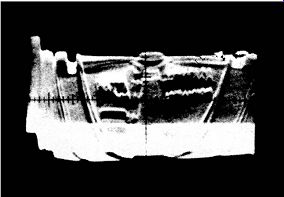
Fig. 5-16. Picture information caused by hum in video waveform.
COLOR WAVEFORM ASPECTS
It is disconcerting to the newcomer in color TV to look in vain for the color burst. The old-timer, on the other hand, proceeds to make systematic tests to track down the bug or bugs.
In case no burst is displayed in the station transmission (Fig. 5-17A) , remember that technical difficulties or propagation vagaries could be attenuating the burst below visible amplitude. To eliminate this possibility, check the chassis with signal from a color-bar generator. Fig. 5-17C shows a typical waveform provided by a generator. If this substitution does not correct the situation, the next logical step is to check the generator.
Check the Color-Bar Generator
Nearly all color-bar generators have a video output terminal provided. When the video signal is fed to the vertical input terminals of a wide-band scope, you should see a waveform, such as in Fig. 5-17C. The color burst normally has the same peak to-peak voltage as the horizontal-sync pulse. A burst-amplitude control is provided to adjust the burst voltage.
If, when the burst-amplitude control is turned to maximum, the burst voltage still appears too low, do not jump to the conclusion that the color-bar generator is defective. The difficulty could equally well be an inadequate or defective scope.
Check the Scope
The vertical amplifier should have a flat response through 3.58 mhz. To determine this point, apply the output from a video frequency sweep generator to the vertical input terminals. The test result is easy to judge if you use a 4-mhz absorption marker.
This may be a built-in feature of the sweep generator, or you may have to use an external marker box.
(B) Station transmission with normal color burst.
(A) Station transmission, color burst missing.
(C) Color-bar generator signal with normal burst display.
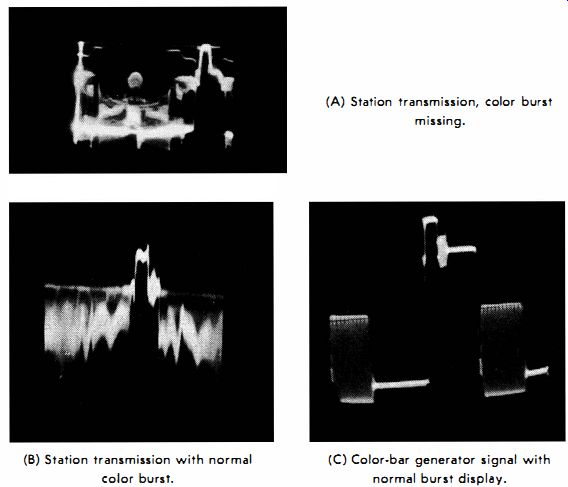
Fig. 5-17. Color TV waveforms.
A typical test display was shown in Fig. 4-3B. The notch near the right end of the pattern is a 4-mhz absorption marker. Note that the response at burst frequency is down about 20%, or 2 db. This is a usable frequency response, although it does have the undesirable action of attenuating all chroma voltages 20% in color-TV tests. If a scope has 100% response at the color burst frequency (3.58 mhz), no interpretation of chroma waveforms is required-what you see is really there.
The foregoing test result does not signify that you should immediately go into the scope to bring up the high-frequency response. While it is true that the burst frequency appears 2 db down in the pattern, the scope itself could be flat through the burst frequency. It is possible that the high-frequency attenuation is in the sweep generator.
Check the Sweep Generator
To confirm or eliminate this possibility, feed the output from the sweep generator through a demodulator probe to the vertical input terminals. In case a flat characteristic is displayed (Fig. 4-18) , the high-frequency loss is occurring in the scope.
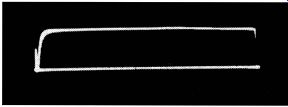
Fig. 5-18. Scope display showing flat output from video sweep generator.
But on the other hand, if the characteristic shows a 2-db attenuation at 3.58 mhz, the scope actually has a flat frequency response through the color-burst frequency.
To summarize: waveform aspects are not always what they seem to be, because a false assumption might have been made concerning the characteristics of associated instruments. Since you can make definitive cross-checks with basic instruments, it is a simple procedure to run down the source of unexpected waveform aspects.